Protein supplementation during an energy restricted diet induces visceral fat loss and gut microbiota amino acid metabolism activation: a ...
←
→
Page content transcription
If your browser does not render page correctly, please read the page content below
www.nature.com/scientificreports
OPEN Protein supplementation
during an energy‑restricted diet
induces visceral fat loss and gut
microbiota amino acid metabolism
activation: a randomized trial
Pierre Bel Lassen1,2, Eugeni Belda1,3, Edi Prifti1,4, Maria Carlota Dao1, Florian Specque4,
Corneliu Henegar1, Laure Rinaldi5, Xuedan Wang6, Sean P. Kennedy7, Jean‑Daniel Zucker1,4,
Wim Calame8, Benoît Lamarche9, Sandrine P. Claus5* & Karine Clément1,2*
Interactions between diet and gut microbiota are critical regulators of energy metabolism. The effects
of fibre intake have been deeply studied but little is known about the impact of proteins. Here, we
investigated the effects of high protein supplementation (Investigational Product, IP) in a double
blind, randomised placebo-controled intervention study (NCT01755104) where 107 participants
received the IP or an isocaloric normoproteic comparator (CP) alongside a mild caloric restriction. Gut
microbiota profiles were explored in a patient subset (n = 53) using shotgun metagenomic sequencing.
Visceral fat decreased in both groups (IP group: − 20.8 ± 23.2 cm2; CP group: − 14.5 ± 24.3 cm2) with
a greater reduction (p < 0.05) with the IP supplementation in the Per Protocol population. Microbial
diversity increased in individuals with a baseline low gene count (p < 0.05). The decrease in weight, fat
mass and visceral fat mass significantly correlated with the increase in microbial diversity (p < 0.05).
Protein supplementation had little effects on bacteria composition but major differences were seen at
functional level. Protein supplementation stimulated bacterial amino acid metabolism (90% amino-
acid synthesis functions enriched with IP versus 13% in CP group (p < 0.01)). Protein supplementation
alongside a mild energy restriction induces visceral fat mass loss and an activation of gut microbiota
amino-acid metabolism.
Clinical trial registration: NCT01755104 (24/12/2012). https://clinicaltrials.gov/ct2/show/record/NCT01
755104?term=NCT01755104&draw=2&rank=1.
Abbreviations
BMI Body Mass Index
BMR Basal Metabolic Rate
CP Comparator Product
CRP C-reactive Protein
CT scan Computerized Tomography scan
DNA Deoxyribonucleic Acid
FAS Full Analysis Set
1
Sorbonne Université, Inserm, Nutrition and Obesity: Systemic Approaches Research Unit, NutriOmics,
Sorbonne Université, 91 boulevard de l’Hôpital, 75013 Paris, France. 2Assistance Publique Hôpitaux de
Paris, Nutrition Department, Pitié Salpêtrière Hospital, Assistance Publique Hôpitaux de Paris, 75013 Paris,
France. 3Integrative Phenomics, Paris, France. 4Sorbonne Université, IRD, UMMISCO, Unité de Modélisation
Mathématique et Informatique des Systèmes Complexes, Sorbonne Université, 93143 Bondy, France. 5YSOPIA
Bioscience, 17 place de la Bourse, 33076 Bordeaux, France. 6Department of Food and Nutritional Sciences, School
of Chemistry, Food and Pharmacy, The University of Reading, Reading RG6 6AP, UK. 7CNRS, Institut Pasteur,
Department of Computational Biology, USR 3756, CNRS, 75015 Paris, France. 8StatistiCal BV, Strandwal 148, 2241
MN Wassenaar, The Netherlands. 9Laval University, Institute On Nutrition and Functional Foods, Laval University,
Québec, QC G1V 0A6, Canada. *email: sandrine.claus@ysopia.bio; karine.clement@inserm.fr
Scientific Reports | (2021) 11:15620 | https://doi.org/10.1038/s41598-021-94916-9 1
Vol.:(0123456789)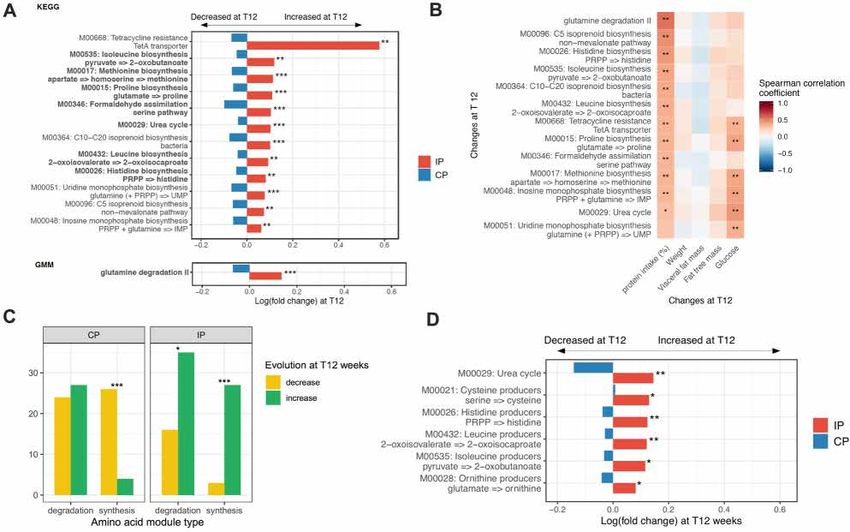
www.nature.com/scientificreports/
FDR False Discovery Rate
GMM Gut Metabolic Modules
HDL High Density Lipoprotein
HGC High Gene Count
IL6 Interleukin 6
IP Investigational Product
KEGG Kyoto Encyclopedia of Genes and Genomes
LGC Low Gene Count
MGS Metagenomic Species
PP Per Protocol
SEM Standard Error of Mean
SD Standard Deviation
TNF alpha Tumor Necrosis Factor alpha
VFA Visceral Fat Area
Obesity is a pandemic disease affecting today an alarming 650 millions adults worldwide and representing the
main risk factor for developing chronic metabolic disorders such as type 2 diabetes and other cardiometabolic
disorders. Obesity is defi ed in the western population by an elevated body mass index (BMI = body weight (kg)/
[height (m)]2) > 30 kg/m2. However, there is increasing evidence that adiposity is a better predictor of developing
cardiometabolic diseases1. One explanation is that the adipose tissue, and particularly visceral fat, is an endo-
crine organ secreting hormones that regulate appetite and energy metabolism and contributes to systemic low
grade inflammation in obese individuals2. Consistently, it has been recently documented that visceral obesity
and insulin resistance increase the risk of cardiovascular d iseases3 and type 2 d
iabetes4. Hence, there is increas-
ing interest in identifying factors that control the expansion of visceral fat mass in the hope that acting on these
components will help limit the development of obesity-related metabolic co-morbidities.
Fat mass development is strongly correlated with total body weight but currently available strategies to induce
weight loss (i.e. hypocaloric diets, increased physical activity, drug-induced reduction of appetite and bariatric
surgery) have shown no specific effect on visceral fat m ass5.
Recent studies identified that gut microbiota are an important factor influencing visceral fat mass indepen-
dently of diet6 and some specific microbial metabolic pathways are associated with visceral fat7.Th s may explain
the contrasting fi dings about the links between dietary macronutrient intake and visceral fat mass. For example,
while Le Roy et al. reported that increasing dietary protein intake is associated with higher visceral fat mass6, oth-
ers have reported the opposite8,9. The protein composition may also be an important element to consider that may
be responsible for diverging results in these studies. Th s has been well illustrated by a Japanese study comparing
milk-derived to soy-derived protein formula where only the milk-derived proteins induced significant visceral
fat mass reduction10. Most dietary proteins are digested in the upper gastrointestinal tract but low-digestibility
protein intake leads to undigested peptides reaching the colon where they can be metabolised by gut bacteria11.
In the distal intestine, they contribute to the overall production of colonic short-chain fatty acids and there is
accumulating evidence of protein-derived metabolites influencing host m etabolism12–16. Hence, gut microbiota
protein metabolism may constitute a key pathophysiological link between obesity, fat mass development and
its metabolic c omplications17,18. Previous studies investigating the effects of high protein diets on gut bacteria
community composition have reported increased abundance of bile-tolerant microorganisms (e.g. Alistipes,
Bilophila and Bacteroides) and decreased levels of Firmicutes that metabolise dietary plant polysaccharides (e.g.
roseburia, Eubacterium rectale, bifidobacteria and Ruminococcus bromii)19–22. A recent study also reported an
increase in Akkermansia spp. during a high protein dietary i ntervention23.
Therefore, in order to investigate the impact of dietary proteins on visceral fat mass reduction and on the gut
microbial ecosystem at both taxonomic and functional levels, we analysed data from a 12-week-long randomized
double-blind placebo-controlled energy restriction intervention study in 107 overweight/obese individuals with
metabolic syndrome supplemented with high protein formula versus an isocaloric comparative product.
Our hypothesis was that the investigational product (IP) containing a mixture of milk-derived proteins would
induce fat mass reduction better than the isocaloric normoproteic comparator containing pea-derived proteins
(CP). We also hypothesised that high protein intake would modulate gut microbial functions and questioned
whether the protein source would induce a specific functional shift. We observed lower visceral fat mass after
12 weeks of treatment in the IP group. At the gut microbial community level, we observed a modest impact of
protein supplementation but a strong functional shift was noted with milk-derived protein supplementation.
Subjects and methods
Patient population. Th s double-blind controlled, multicentre, interventional, randomized in parallel
groups (1:1), clinical study was performed in France (Pitié-Salpêtrière hospital, Center of Research of Clini-
cal Nutrition, Institut de Cardiométabolisme et de Nutrition, Paris) and in Canada (Institute on Nutrition and
Functional Foods from Laval University, Québec). Patients aged between 18 and 65 years, overweight or obese
(body mass index (BMI) ≥ 25 kg/m2 and < 40 kg/m2) with metabolic syndrome24, were selected for inclusion.
A complete list of exclusion criteria and study details are provided in supplemental material. Briefly, patients
were expected to be free from any known inflammatory disorder, not diabetic and not treated within the last
3 months with drugs affecting visceral fat mass. Antibiotic exposure within the last month, regular intake of
food supplements known to affect body weight, satiety or appetite and probiotics were prohibited. Any form of
hypocaloric diet or specific diet such as vegetarian or vegan within the last 6 months were also exclusion criteria.
The study was registered at Clinicaltrials.gov as NCT01755104 (24/12/2012). Informed consent was obtained
Scientific Reports | (2021) 11:15620 | https://doi.org/10.1038/s41598-021-94916-9 2
Vol:.(1234567890)www.nature.com/scientificreports/
form all participants before initiation of any study-related procedure. Research was performed in accordance to
the Declaration of Helsinki.
Dietary intervention and product allocation. A diagram of the study design is available in Supplemen-
tal Figure S1. Eligible subjects were randomized to receive a daily supplement of two sachets per day of the high
protein investigational product (IP) or the comparator product (CP). IP was a high protein powder preparation
containing 34 g of protein, 2 g of fat and 6 g of carbohydrates (i.e. 75%, 12% and 13% of total energy content,
respectively) per sachet. Protein sources for the IP were composed of a mixture of milk protein fractions and free
amino acids (patent reference: US 20140287057 A1). CP was an isocaloric mixture containing only 7.3 g of pro-
tein, 7.6 g of fat and 24.5 g of carbohydrates designed to not alter the overall balance of a conventional diet (i.e.
15% protein, 35% fat, 50% carbohydrate). Protein sources for the CP were composed of hydrolysed pea proteins
and calcium caseinate in equal proportion. Both powders were manufactured by ProDietic (France) and were
reconstituted in 250 mL of water and taken twice a day as morning and afternoon snacks. A detailed nutritional
composition of the IP and CP is given in Supplemental Table S1. The IP and the CP were administered along
with a balanced (50% carbohydrates, 35% fat and 15% proteins) diet with a moderate caloric restriction defi ed
by a reduction of 600 kcal from the estimated daily caloric needs, for 12 weeks and for another 4-week diet-
free, maintenance period. Daily caloric needs were estimated by a registered dietician, as product of the energy
expenditure (REE) following the Harris and Benedict formula multiplied by a coeffici t of 1.3 (for a sedentary
lifestyle). The daily portion provided by the IP or the CP (360 kcal/day), was included in the calculation of the
total energy intake. Subjects in both study groups were instructed to maintain their usual physical activity habits
during the study period. Dietary advice was given to subjects in the investigational centre at the inclusion visit,
follow-up visit 1 and follow-up visit 2. A phone call, initiated by the dietitian, was planned every week for the
whole period of the study. Before and at the end of the intervention, food intake was quantitatively measured
using population-specific validated food frequency questionnaire completed by both French and Canadian sub-
jects online25.
Study endpoints. The primary endpoint was a change in the abdominal visceral fat area (VFA) measured in
c m2 from baseline to Week 12 (end of intervention). Abdominal VFA was measured 5 cm above L4–L5 interver-
tebral disc using a computed tomography (CT) scan at both centres. Reading of the CT scan was performed
centrally (Philips NCTC 965 Software), for the complete set of subjects, by a single reader (radiologist). Second-
ary endpoints included changes in body composition, cardiometabolic risk factors, inflammatory parameters
and gut microbiota composition. Compliance was assessed by recording the number of delivered and returned
sachets, including empty sachets. Safety was assessed based on the reporting of adverse events monitored from
the time that the subjects gave informed consent to the end of the study.
Fecal microbiota analysis. Participants to this study in the French centre had faecal sampling before and
after the intervention.
Extraction, sequencing and analysis of faecal genomic DNA. Detailed information about extraction, sequenc-
ing and analysis of faecal microbiota is provided in the supplementary methods. Briefly, DNA sequencing data
were generated using Illumina HiSeq2500. Normalisation and downsizing were performed and the abundance
of MGS (metagenomic species) > 500 genes was computed as described26. Alpha-diversity was measured in two
ways: gene richness i.e. the average number of genes (meaning at least one read mapped) per sample and MGS
richness i.e. the MGS present in each sample. Enterotyping of the cohort was performed following the Dirichlet
Multinomial Mixture (DMM) method27 using MGS abundance matrix of the entire cohort collapsed to genus
level. Functional characteristics of the metagenomes were assessed for each sample by collapsing gene abun-
dance into KEGG modules as described28 based on KEGG functional mappings of the IGC gene catalog (PMID:
24997786; PMID: 10592173). To complete this functional module matrix (where amino-acid degradation mod-
ules are not fully represented), gut metabolic modules as described by Viera-Silva et al.29 were computed for each
sample using omixerRPM v0.2.3 R p ackage30. Using functional annotations of the 9.9 M genes catalogue, preva-
lence matrices (presence/absence) of functional annotation per MGS were computed allowing the bioinformatic
constitution of amino-acid synthesis and degradation functional groups of MGS.
In vitro batch fermentation. Detailed information on in vitro anaerobic batch fermentation proto-
cols and faecal microbiota analyses are provided in supplementary methods. Briefly, pre-digested protein mix
(0.35 g) was added to the sterile vessels with basal nutrient medium prior to inoculation with 2 mL of faecal
inocula from 6 selected donors (3 lean and 3 obese, matched for sex and age). Samples were collected at baseline
(T0) and after 48 h fermentation (T48). Following faecal DNA library preparation, metagenomic sequencing was
performed with Illumina HiSeq. Microbiota characteristics were assessed using the same process as for clinical
study samples.
Statistical methods. Sample size calculation is detailed in supplementary methods. The Full Analysis Set
(FAS) population consisted of all randomized subjects who consumed at least one sachet of the study IP. The Per
Protocol (PP) population included all subjects who completed the study without any major protocol deviation
(as detailed in supplementary methods). Since microbiome samples were only available at T0 and T12 weeks,
in the present manuscript we focused entirely on results at these two time points and data from T16 weeks were
not considered.
Scientific Reports | (2021) 11:15620 | https://doi.org/10.1038/s41598-021-94916-9 3
Vol.:(0123456789)www.nature.com/scientificreports/
IP (n = 54) CP (n = 53) p value
Age (years) 47.7 (10.2) 48.1 (11.3) 0.64
Male (N,%) 24 (44.4) 20 (37.7)
Female (N, %) 30 (55.6) 33 (62.3)
BMI (kg/m2) 32.4 (3.8) 32.2 (3.7) 0.73
Waist circumference (cm) 104.5 (9.4) 103.4 (8.3) 0.54
Waist/Hip circumference ratio 1.0 (0.1) 0.9 (0.1) 0.56
Visceral fat area (mm2)* 213.0 (87.7) 181.6 (59.2) 0.10
Fasting plasma glucose (mmol/L) 5.53 (0.71) 5.62 (0.63) 0.49
HDL (mmol/L) 1.2 (0.4) 1.2 (0.4) 0.71
LDL cholesterol (mmol/L) 3.2 (0.8) 3.4 (0.9) 0.62
Triglycerides (mmol/L) 1.6 (0.9) 1.7 (0.8) 0.58
CRP (mg/L) 7.31 (21.54) 4.35 (6.21) 0.34
TNFalpha (pg/mL) 1.85 (1.56) 1.40 (0.66) 0.05*
IL-6 (pg/mL) 2.68 (5.11) 1.72 (0.89) 0.18
Table 1. Baseline subject characteristics for the FAS population. Mean +/− SD; BMI: Body mass index;
*p < 0.05 between IP and CP; Distribution in men and women was equivalent in both groups (p = 0.48).
Statistical analysis of clinical data. Absolute changes of the primary and secondary outcomes, based
on FAS population and measured at Week 12, were compared between the two groups using stepwise General
Estimating Equations (GEE) analysis in a repeated fashion adjusted for centre (French/Canadian), age, sex, BMI,
treatment, time, interaction between treatment and time, and starting value. Additional analyses for the primary
endpoint were conducted using the PP population. Quantitative variables were described using mean, standard
deviation, median, minimum and maximum. Qualitative variables were described using frequency and percent-
ages. To investigate whether consumption of IP decreased the visceral fat mass to a greater extent than CP, a
dummy stepwise multifactorial (GEE) model was applied in a repeated (participant) fashion. The multifactorial
model was stratifi d by centre and adjusted for age, sex, BMI, treatment, time, interaction term of treatment
and time, start value. Change in visceral fat mass per person between week 6, week 12 and week 0 was used as
dependent parameter. Goodness of Fit of the model was evaluated using a Wald Chi-square statistic. Th ough-
out the study a p value below 0.05 was considered to detect a statistically relevant difference applying two-sided
evaluation. Outlier analysis was conducted via the Grubbs test (two-sided with α-level of 0.05). Patients with
inconsistent dietary declarations i.e. energy intake < 0.5 * Basal metabolic rate (BMR; estimated using Harris and
Benedict formula) or energy intake > 3 * BMR were excluded from dietary intake statistical analysis.
Statistical analysis of microbiome data. Microbiome dynamic changes were calculated as the log-ratio
of abundance at T12 versus T0 at the different taxonomic levels after filtering for > 20% prevalence at baseline.
For representation of changes over time, cliff delta effect of time was shown for MGS and 16S calculated genera
(nonparametric distribution). For other microbiota features, log fold change (i.e. log (T12/T0)) is shown. Micro-
biota changes were analysed in linear mixed models using fi ed effect of time, adjusted for baseline age, sex
and baseline for pooled analysis and interaction of time with intervention with same adjustments for between
groups analysis. Beta-diversity was computed using Bray–Curtis distance with vegdist function of the vegan R
package (v2.5–6)31 from MGS abundance matrix collapsed at genus level. Principal Coordinate Analysis (PCoA)
of Bray–Curtis beta-diversity matrix was carried out with the cmdscale function of vegan R package. When
relevant, adjustment for multiple comparison was performed using the False Discovery Rate method (FDR). For
FDR adjusted analysis, the statistical signifi ance threshold was set to 0.1. Statistical analyses and conception of
figu es were carried out using R version 3.3.2, R Core Team (2019), https://www.R-project.org/.
Ethics approval and consent to participate. The study was registered at Clinicaltrials.gov as
NCT01755104. The study protocol was reviewed and approved in local ethical committee For France, local
ethical committee was CPP IDF 1; 00008522 (study approval reference: 2012-sept-13025) and for Canada, local
comitee was the comité d’éthique de la Recherche de l’IUCPQ (study approval reference: 20922). Informed consent
was obtained from each subject before initiation of any study-related procedure.
Results
Results of the main clinical trial analyzing the whole cohort of both French and Canadian
patients: effects of protein supplementation on body composition and metabolic parame‑
ters. Baseline characteristics in IP and CP groups. A total of 107 subjects were included in the Full Analysis
Set (FAS) population and 99 in the per protocol (PP) population (Study fl w chart, Figure S2). Overall baseline
characteristics were similar in both groups (Table 1, Table S2).
Compliance and safety analysis. Median compliance was high, reaching 96.5% at week 12 and was similar in
each group. Over 96% of subjects in each group reported good tolerance of the IP and CP products. Detailed
Scientific Reports | (2021) 11:15620 | https://doi.org/10.1038/s41598-021-94916-9 4
Vol:.(1234567890)www.nature.com/scientificreports/
Baseline (T0) T12 weeks: diet only T12 weeks: diet + daily supplement
IP n = 48 CP n = 46 p IP n = 48 CP n = 46 p IP n = 48 CP n = 46 p
Energy intake (kcal) 2436 (899) 2255 (872) 0.32 1414 (483) 1414 (518) 0.99 1770 (496) 1790 (530) 0.85
Fat (g) 99.9 (43.1) 85.4 (40.1) 0.01 51.2 (22.3) 49.1 (24.6) 0.66 56.9 (23.1) 63.7 (25.0) 0.17
Fat (%) 36.3 (5.30) 33.6 (5.56) 0.02 32.1 (7.33) 30.3 (5.78) 0.17 28.2 (5.91) 31.5 (4.39) 0.003
Carbohydrates (g) 271 (101) 269 (102) 0.92 166 (61.6) 168 (63.8) 0.85 176 (62.0) 214 (65.0) 0.005
Carbohydrates (%) 44.9 (5.90) 48.1 (7.18) 0.02 46.6 (8.60) 47.9 (6.61) 0.42 39.3 (6.93) 48.0 (5.13) < 0.001
Protein (g) 108 (45.7) 97.2 (42.3) 0.25 68.8 (24.0) 73.3 (23.4) 0.36 134 (24.8) 87.5 (23.9) < 0.001
Protein (%) 17.7 (3.77) 17.2 (3.12) 0.43 20.0 (5.81) 21.2 (3.55) 0.23 31.5 (5.50) 19.8 (2.62) < 0.001
Fibre (g) 23.5 (10.8) 23.7 (10.3) 0.91 17.9 (8.14) 18.2 (6.68) 0.83 21.3 (10.4) 18.1 (6.5) 0.09
Table 2. Description of the nutritional intake before and after the intervention. Data is expressed as mean
(SD) for continuous variables. Macro-nutrient intake is expressed as g/day or percent of total energy intake
when specifi d. P values of Student t test.
information about adverse events is provided in Supplementary Table S3 and S4. There were no signs of kidney
toxicity with no signifi ant changes in creatininemia in neither IP nor CP groups (Table S5).
Dietary intake. For 9 patients dietary data were missing and 4 were excluded because of inconsistent declara-
tions. Dietary intervention led to an energy restriction that was similar in IP and CP groups, while maintaining
constant fibre intake (Table 2). At the end of the intervention (T12), although carbohydrate intake by design also
differed, the main difference between the 2 groups was protein intake.
Effect of protein supplementation on body composition and cardiometabolic risks. Protein
supplementation induces changes in visceral fat and body composition. Mean visceral fat area (VFA) in the FAS
population decreased signifi antly from baseline to Week 12 in both IP (− 20.7 ± 23.2 cm2 i.e. − 9.7% from base-
line, p < 0.0001) and CP (− 14.5 ± 24.3 cm2 i.e. − 8.0% from baseline, p < 0.0001) groups. Elimination of 2 outliers
(determined via Grubbs test) revealed a signifi ant difference in the absolute reduction of visceral fat area be-
tween the IP and CP group (− 20.8 vs. − 14.2 mm2 resp, p < 0.05). The absolute reduction of visceral fat area from
baseline to Week 12 was not signifi antly higher in the IP compared to CP groups (p = 0.09) in the FAS popula-
tion but was signifi antly higher in the PP population (− 20.5 vs. − 12.6 cm2 resp., p < 0.05) (Fig. 1). In the FAS
population, the between group adjusted difference was signifi ant for total fat area (p < 0.05), Subcutaneous Fat
Area (p < 0.05) and Fat-free mass (p < 0.05) in favour of the IP group (Table 3). There was no absolute change in
fat-free mass (i.e. lean mass) from baseline to Week 12 in the IP group, whereas a signifi ant decrease (p < 0.001)
was observed in the CP group (p < 0.01 between groups).
Changes in cardiometabolic risk factors and inflammatory markers. Systolic and diastolic blood pressures,
BMI, waist circumference, fasting blood glucose, total cholesterol, LDL cholesterol and triglycerides levels sig-
nifi antly decreased from baseline to 12 weeks (p < 0.001) without signifi ant between group effects (IP vs. CP)
(Table S5). CRP (C-reactive Protein) and TNF alpha, two inflammatory markers commonly associated with low
grade inflammation in obesity, were signifi antly lower in the IP group versus CP group (p < 0.05 and p < 0.01
respectively) (Table 3). On the other hand, the decrease in HbA1c was signifi antly more substantial in CP group
versus IP (Table S5).
Results of the ancillary study focusing on the subcohort of French patients: effects of protein
supplementation on the gut microbiota. Eff ct of protein supplementation on the gut microbiota com-
position. Out of the 53 participants with microbiota sampling (i.e. the French participants), 2 were excluded
because of an inter-current antibiotic treatment (Figure S3).
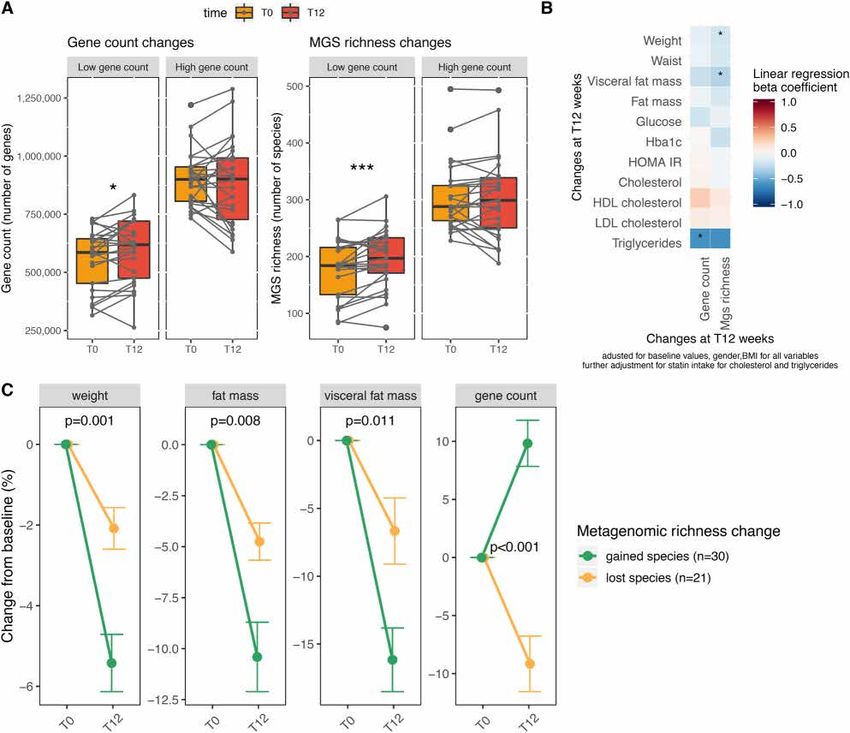
Increase in gut microbiota richness associates with visceral fat mass loss. Overall, the dietary intervention was
not associated with changes in microbial diversity neither in number of genes or number of species and there
was no difference between groups. However, individual trajectories were highly heterogeneous and consistently
with previous observations19, the change in diversity after the intervention depended on the baseline diversity
status. Independently of IP or CP supplementation, individuals with a baseline low gene count, had a signifi ant
increase in diversity (gene count: 6.6 ± 13.6% vs. − 2.3 ± 13.9% for low vs. high baseline gene count individuals;
p = 0.015; metagenomic richness: 11.6 ± 17.8% vs. − 0.4% ± 12.3% for low vs. high baseline gene count individu-
als; p = 0.0009) (Fig. 2A). Interestingly, individuals that increased their number of metagenomic species during
the intervention were those who showed the greatest weight, fat mass and visceral fat mass loss (Fig. 2B,C).
Protein supplementation had modest impact on microbial diversity and composition. Calorie restriction-induced
weight loss was similar in IP and CP and the main difference between the two intervention groups in terms of
dietary intake changes was protein intake (Table 2). Despite this major low-digestibility protein supplementa-
tion, no signifi ant changes were observed in alpha-diversity in IP versus CP group (Fig. 3A). Beta-diversity did
not differ between the two groups at baseline (permanova p = 0.47; R2 = 0.018) nor at the end of intervention
Scientific Reports | (2021) 11:15620 | https://doi.org/10.1038/s41598-021-94916-9 5
Vol.:(0123456789)www.nature.com/scientificreports/
Figure 1. Investigational Product improved fat mass, maintained lean mass and reduced inflammation at week
12 post intervention. Changes in visceral fat area as established via CT scan in the (A) FAS population, (B) FAS
without outliers and (C) PP population. Changes in fat mass (D) and lean mass (E) as established via DEXA
scan and in TNFα (F) in FAS without outliers. Mean (SEM) for at least n = 51. *p < 0.05 (GEE model) Key: Circle
is Control Product; Square is Investigational Product.
IP (N = 54) CP (N = 53) IP versus CP (N = 107)
Mean absolute change Mean absolute change
(SD) p value (SD) p value Mean absolute change p value
Body weight (kg) − 3.56 (3.12) < 0.001 − 3.07 (3.09) < 0.001 0.49 0.701
Total fat mass (kg) − 3.21(2.47) < 0.001 − 2.22 (2.53) < 0.001 0.99 0.004
Visceral Fat Area (cm2) − 20.7 (23.2) < 0.001 − 14.5 (24.3) < 0.001 − 6.2 0.088
Total Fat Area (cm2) − 46.6 (43.8) < 0.001 − 30.8 (48.3) < 0.001 − 15.8 0.010
Subcutaneous Fat Area
− 25.9 (32.3) < 0.001 − 16.3 (32.5) < 0.001 − 9.6 0.029
(cm2)
Fat-free mass (kg) − 0.08 (1.24) 0.644 − 0.58 (1.24) 0.001 0.50 0.003
Fasting glucose (mmol/L) − 0.17 (0.45) < 0.001 − 0.3 (0.49) < 0.001 0.47 0.249
HDL cholesterol
− 0.02 (0.19) 0.468 0.03 (0.14) 0.115 0.05 0.301
(mmol/L)
LDL cholesterol (mmol/l) − 0.3 (0.6) < 0.01 − 0.2 (0.7) < 0.01 − 0.1 ns
Triglycerides (mmol/L) − 0.28 (0.61) < 0.002 − 0.37 (0.55) < 0.001 0.09 0.296
CRP (mg/L) − 3.4 (19.8) 0.205 1.0 (9.9) 0.457 4.4 0.049
TNF alpha (pg/mL) − 0.47 (1.57) 0.023 0.06 (0.48) 0.401 0.53 0.002
IL-6 (pg/ml) − 0.83 (5.03) 0.223 0.17 (1.46) 0.383 1.00 0.151
Table 3. Between-group differences in absolute changes in body composition from baseline to Week 12 in the
FAS Population (N = 107). Mean values (standard deviation); Between group difference denotes IP effect versus
CP.
Scientific Reports | (2021) 11:15620 | https://doi.org/10.1038/s41598-021-94916-9 6
Vol:.(1234567890)www.nature.com/scientificreports/
Figure 2. Evolution of metagenomic richness 12 weeks after dietary intervention. (A) Evolution of gene count
(number of genes) and metagenomic richness (number of MGS) depending on baseline gene richness status
The fi ed effect of time (the intervention) was analysed in a mixed linear model with patients as random effects.
*p < 0.05, **p < 0.001. (B) Evolution of richness associations with the clinical evolution. Heatmap of standardized
beta coeffici t from linear regression. Model is adjusted for baseline values + baseline BMI and sex. For
cholesterol and triglycerides, the model is also adjusted for baseline statin intake. (C) Evolution of weight, fat
mass, visceral fat mass and gene count depending on richness response. Change from baseline is (T12–T0/)
T0 * 100. Gained species are individuals who increased their MGS richness. Lost species are individuals
who decreased their metagenomic (MGS) richness. P values of the effect of MGS richness change in a linear
regression model adjusted for baseline value, sex and BMI. Points are mean, bars are SEM. Figure conceived
using R version 3.3.2, R Core Team (2019), https://www.R-project.org/.
(T12) (p = 0.34 R2 = 0.021). There was no effect of intervention on beta-diversity in the CP group (p = 0.629;
R2 = 0.014) nor in the IP group (p = 0.93; R2 = 0.007) (Figure S4A–D).
After 12 weeks, 8 patients switched their enterotype (15%). The proportion of subjects that changed their
enterotype was lower when the baseline enterotype was Bacteroides (n = 1, 2.0% vs. n = 7, 13.7%; p value = 0.024).
The proportion of enterotype change was not different between the 2 groups (9.8% in IP group vs. 5.8% in CP
group, p = 0.34) (Fig. 3B).
We next investigated whether microbiome changes induced by higher protein supplementation with IP could
be observed at lower taxonomic levels. The 16S targeted analysis of known taxa associated with metabolic health
revealed modest, but interesting, modulations (Figure S5). Akkermansia spp. tended to increase with energy
restriction (in both groups) while bifid bacteria tended to decrease. Christensenella spp. and Lactobacillus sp.
tended to increase in the IP group, while Turicibacter spp. tended to be boosted in the CP group (non-signifi ant
trends). Regarding untargeted shotgun metagenomics results, some MGS were increased in the IP versus CP
groups, such as Bilophila wadsworthia but none of these changes were signifi ant after adjusting for multiple
comparisons (False discovery rate < 0.1) (Fig. 3C).
Scientific Reports | (2021) 11:15620 | https://doi.org/10.1038/s41598-021-94916-9 7
Vol.:(0123456789)www.nature.com/scientificreports/
A C
B
Figure 3. Effects of protein supplementation on gut microbiome composition (IP vs. CP). (A) Evolution
(relative change at T12) of gene count and MGS richness (number of present species) in investigational
product group (IP, red colours) and Comparator group (CP, blue colours) depending on baseline metagenomic
richness. LGC: low gene count at baseline (light colours). HGC: high gene count at baseline. p value of the effect
intervention interaction with time in LGC patients (a) and HGC patients (b); (B) Alluvial plot showing the
evolution of enterotype between T0 and T12 in CP group (left anel) and IP group (right panel); (C) Untargeted
analysis of the effects of IP on metagenomic species (MGS) abundance changes with the intervention. MGS
shown are the ones with a signifi ant interaction of time with intervention in a mixed linear model with patients
as random effects adjusted for baseline age, sex and BMI (p < 0.05 without adjustment for multiple comparisons).
Bars represent the cliff d lta effect of time (T12 vs T0) on MGS abundance in each group. *p < 0.05; **p < 0.01;
***p < 0.001 No signifi ant differences resist to adjustment for multiple comparisons. IP: investigational product
(high protein); CP: comparator product. Figure conceived using R version 3.3.2, R Core Team (2019), https://
www.R-project.org/.
IP supplementation induces amino acid metabolism functional changes in the gut microbiota. Twelve KEGG
functional modules were induced by the IP with a signifi ant difference compared to the CP group (Fig. 4A)
(IP vs. CP adjusted for age, BMI and sex; p < 0.001 and FDR < 0.1). Interestingly, most of these modules were
involved in amino acid metabolism such as urea cycle, amino-acid biosynthesis modules (histidine, leucine,
lysine, proline and methionine biosynthesis). One amino acid degradation module (glutamine degradation II)
was induced by the IP based on the same statistical approach on the Gut Metabolic Modules (GMM) reposi-
tory (Fig. 4A). Moreover, these functional changes were positively correlated with patients’ individual % protein
intake changes from baseline (Fig. 4B) and were not linked with weight loss. Complementing this approach, we
then focused on amino-acid metabolism and compared the evolution of amino acid synthesis and degradation
modules in IP versus CP groups. Most amino acid synthesis modules were enriched (i.e. mean abundance higher
at T12 vs T0) during intervention in the IP group whereas the opposite was observed for the CP group (90.0% for
IP group vs. 13.3% in CP group; chi square p < 0.001). A majority of amino acid degradation modules were also
enriched in the IP group but this did not reach signifi ance compared to the CP group (68.6% in the IP group vs.
52.9% in the CP group; chi square p = 0.10) (Fig. 4C). To further explore these functional changes, we projected
amino acid metabolism modules from KEGG and GMM databases on metagenomic species (MGS), computing
functional groups of bacteria with the capacity to synthesise (i.e. producers) or degrade (i.e. degraders) amino
acids. We observed signifi ant increases in amino-acid producers (Cysteine, Th eonine, Isoleucine, Leucine,
Histidine and Ornithine) induced by IP (vs. CP) with no effect on amino acid degraders (Fig. 4D). However,
when comparing the coverage of these functional modules across MGS gene content, we found that the comple-
tion of biosynthesis modules was from far higher than degradation modules (Figure S6A), with a large overlap
between biosynthesis and degradation phenotypes for different amino acids (Figure S6B).
Scientific Reports | (2021) 11:15620 | https://doi.org/10.1038/s41598-021-94916-9 8
Vol:.(1234567890)www.nature.com/scientificreports/
Figure 4. Effects of protein supplementation on gut microbiota function. (A) Effects of IP on functional
modules from KEGG and GMM databases. Shown modules are those which changed differently (FDR < 0.1)
between the two groups (IP vs. CP) adjusted for baseline BMI, age and sex. Bars represent log(fold change)
at T12 of modules abundances in each group (IP vs. CP). Modules in bold: amino-acid metabolism modules.
*p < 0.05; **p < 0.01; ***p < 0.001. (B) Heatmap of spearman correlations between functional modules fold
changes and bio-clinical relative changes after the intervention (T12-T0/T0); *p < 0.05; **q < 0.05 (adjusted for
multiple comparison, FDR method). (C) Evolution of the amino acid metabolism (degradation and synthesis)
functional modules (KEGG and GMM) with the intervention. Increase is defi ed by a mean fold change > 0
and decrease by a mean fold change < 0 for each module. The observed proportion of increased module
was compared to a theoretical value of 0.5 with a binomial test. *p < 0.05; **p < 0.01; ***p < 0.001 (adjusted
for multiple comparisons, FDR method). (D) Effects of IP on amino acid metabolism functional groups of
metagenomic species. Shown functional groups are those which changed differently (p < 0.05) between the two
groups (IP vs. CP) adjusted for baseline BMI, age and sex. Bars represent log(fold change) at T12 of modules
abundances in each group (IP vs. CP). *p < 0.05; **p < 0.01; ***p < 0.001. IP: investigational product (high
protein); CP: comparator product. Figure conceived using R version 3.3.2, R Core Team (2019), https://www.R-
project.org/.
Results of the in vitro study: effects of the protein fraction alone on the gut microbiota. Pro-
tein supplementation induces functional microbiota changes during in vitro bacterial fermentation. To confi m
that metagenomic changes observed in the IP group were due to an increased amount of protein reaching the co-
lon, we examined the effects of a direct supplementation of the protein extracted from both CP and IP on micro-
biota function using an in vitro fermentation approach. We confi med that exposure to proteins from IP or CP
was associated with increased amino acid metabolism in both cases (Figure S7), with a moderate specific effect
of IP versus CP (Figure S8A,B). Th s suggests that the differences observed in the clinical dietary intervention
study could partially be due to the low digestibility qualities of the proteins contained in the IP. Furthermore,
in this experiment where proteins were the only source of carbon for bacteria, most of the increases observed
corresponded to amino acid degradation modules with a less marked effect for synthesis modules (Figure S8C).
Discussion
In this 12-week long energy-restricted dietary intervention, we observed visceral fat mass loss without lean mass
loss in subjects that received the high milk-derived protein investigational product (IP) in the per protocol popu-
lation. We observed a strong interaction between a gain in individuals’ gut microbiota richness and both body
weight and visceral fat mass loss, independently of protein supplementation. Protein supplementation induced
significant functional changes on bacterial amino acid metabolism with increases in both amino acid synthesis
and degradation, whereas it had a limited impact on the alpha or beta diversity. Since the gut microbiota analyses
Scientific Reports | (2021) 11:15620 | https://doi.org/10.1038/s41598-021-94916-9 9
Vol.:(0123456789)www.nature.com/scientificreports/
concerned only half of the population of the study, we cannot conclude whether these microbiota changes under-
lined the effects of the IP observed on visceral fat mass at the scale of the full cohort.
The importance of the macronutrient composition for effici cy of such moderate weight loss diets is still
subject to debate32. Herein we show that alongside a mild calorie restriction, a high protein supplementation
limits lean mass loss in line with previous r eports8,33–36. In the per protocol population, we also observed that IP
supplementation promoted visceral fat mass loss similarly to previous f i dings9,10. Interestingly here, this was
associated with a decrease in low grade inflammation markers.
Recent studies underline the connection between visceral fat mass and the gut m icrobiota6,7. We show here
for the first time the link between gut microbiota changes and visceral fat mass.
Gut dysbiosis, defi ed by a low metagenomic diversity and altered composition, has been associated with
moderate to severe obesity and its metabolic complications19,37,38. We fi st confi m here in a distinct human popu-
lation that a dietary intervention combining energy restriction and protein enrichment improves metagenomic
diversity in individuals with a baseline low gene count, in agreement with results from our previous s tudy19. We
also show that while the individual microbiota response to a dietary intervention is highly heterogeneous, it
is nonetheless intricately linked with body composition improvement. Subjects who improved their microbial
diversity (net gain of species), lost signifi antly more weight and visceral fat mass compared to those who expe-
rienced a net loss of metagenomic species. Consistent with previous findings, we noted few enterotype changes
during this dietary intervention13. Interestingly, the Bacteroides enterotype, shown to be associated with animal
protein consumption, was the most resilient to this high protein dietary intervention. More specifi ally, the
Bacteroides 2 enterotype, known to be associated with a more severe metabolic p henotype39 was not reversed
with this moderate weight loss intervention.
The unique design of this study with an iso-caloric, iso-fibre control diet, and the use of both 16S and
metagenome sequencing analyses, allowed us to examine the specific effects of high protein intake on the gut
microbiome composition and function. The 16S data analysis revealed modest modulations of interesting genera
such as Akkermansia spp. that tended to increase in both groups due to diet restriction consistently with recent
fi dings23 and Christensenella spp. that showed a trend for increase in the IP group and which as been previously
correlated with an increase in amino acid-derived metabolites in response to high protein i ntake40. Nevertheless,
none of these changes were significant. The metagenomic analysis revealed a few changes at the species levels,
some of which have already been described in previous studies. Bilophila wadsworthia, has been associated with
protein intake20 and is one of the metagenomic species with the biggest increase in the high protein IP group in
our study. Importantly, this species has been recently linked with glucose d ysmetabolism41. Among the other
metagenomic species increased in the IP group, two of them, Bacteroides coprocola and Bacteroides plebeius,
belong to the Bacteroides genus, which has previously been associated with a high protein d iet20. However, over-
all, protein supplementation was found to induce only minor modulations in bacterial composition. Although
this can be somewhat surprising, it is in line with previous results40,42. However, taxonomic changes do not
accurately reflect potential functional c hanges43 and the protein sources tested here had a different impact at this
level. IP supplementation was associated with a functional switch towards increased amino acid metabolism by
bacteria. Glutamine degradation was among the main IP-induced functional changes. Interestingly, glutamine
degradation was a key over-represented function in the microbiota of a population with a protein-rich diet or
carnivorous mammalians43,44. Beside glutamine degradation, most specific changes induced by the IP compared
to the CP involved amino acid synthesis functional modules and this was confi med in complementary analysis
focusing on functional groups of MGS. However, we highlighted a potential lack of genomic coverage for enzy-
matic activities involved in amino acid degradation in metagenomic gene catalogues. This is illustrated by the
branched-chain dehydrogenase enzyme c omplex45, whose coverage is very sparse across MGS of the IGC gene
catalogue. Indeed, none of the MGS harbour all specific subunits of the enzyme complex or additional steps of
the degradation pathway but only the first step46 as illustrated in (Figure S9). This lack of coverage for critical
enzymes of amino acid catabolism together with incompleteness of MGS assemblies and the potential overlap
of some amino acid metabolism function (Figure S6) can influence the quantification of degradation modules
in quantitative metagenomic studies. Despite these methodological issues, the increase in amino acid synthesis
in IP versus CP group suggests a higher bacterial protein anabolism stimulated by milk-derived proteins, that
may result from increased availability of nitrogen in the gut, which may prompt de novo synthesis of amino
acids. Another hypothesis is the increased urea and ammonia excretion into the gut that has formerly been
associated with a high protein d iet47. Th s excess nitrogen in the gut can be utilized by bacteria and may explain
the observed enhanced amino-acid metabolism in our study. Supporting this hypothesis, changes in microbiota
amino acid metabolism specifi to the IP were less pronounced in the in vitro batch fermentation study where
these functional changes were also found in the CP group, although to a lower extent. Th s could be explained by
the likely absence of increased urea and ammonia excretion in the in vitro experiment. Also, in the fermentation
experiment design, proteins were delivered directly to the faecal samples without prior absorption of amino acids
that normally occurs in the small gut in vivo. Th s suggests a different fate for proteins depending on their quality
(directly impacted by the protein source) and digestibility, in agreement with previous r eports40,48.
It is worth noting that limitations frequently affecting other human dietary interventions are also present
in our study. The IP group had somewhat lower carbohydrate intake and could explain some of the observed
microbiome changes. Nevertheless, protein intake was the main difference between IP and CP groups and, unlike
some previous studies, no differences in fibre intake was observed. It is important to note that although it was
not significant, there was a trend for increased fiber intake in CP versus IP. Although overall protein intake was
more than 50% higher in the IP group, both interventions were characterised by a rather high proportion of
proteins in total energy intake (21% in CP vs. 34% in IP group). Regarding the in vitro fermentation study, the
conditions were optimized to reproduce the standard digestion process of proteins in the upper gastrointestinal
tract before reaching the colonic microbiota. The 48 h batch fermentation therefore mimics the adaptation of the
Scientific Reports | (2021) 11:15620 | https://doi.org/10.1038/s41598-021-94916-9 10
Vol:.(1234567890)www.nature.com/scientificreports/
gut microbiota to a sudden exposure to high proteins rather than a chronic exposure to a high protein diet over
the 12 weeks of the intervention study. Finally, we do not have access to the profile of fecal amino acids, which
would be interesting to measure in further intervention studies to confi m the observed functional switches.
In conclusion, in this dietary intervention study, we show that moderate caloric restriction coupled with a
high protein supplement decreased visceral fat mass while maintaining lean mass. We confirmed that a gain in
metagenomic diversity is a strong marker of a positive reponse to a dietary intervention in terms of body com-
position changes and observed for the first time a link between microbiota diversity improvement and visceral
fat mass loss. Diet enrichment in proteins had only small effects on bacterial community composition but led
to signifi ant functional changes in the gut microbiota with an activation of amino acid metabolism. Deeper
studies of the impact of different diets on the gut microbiota composition and function could be key to better
understand the heterogeneous responses commonly observed after dietary interventions.
Data availability
Data described in the manuscript, code book, and analytic code will be made available upon request pending.
Sequencing data have been deposited in the European Bioinformatics Institute (EBI) European Nucleotide
Archive (ENA) under accession number PRJEB35524.
Received: 2 March 2021; Accepted: 12 July 2021
References
1. De Lorenzo, A. et al. Adiposity rather than BMI determines metabolic risk. Int. J. Cardiol. 166, 111–117 (2013).
2. Calder, P. C. et al. Dietary factors and low-grade inflammation in relation to overweight and obesity. Br. J. Nutr. 106(Suppl 3),
S5-78 (2011).
3. Mottillo, S. et al. The metabolic syndrome and cardiovascular risk: A systematic review and meta-analysis. J. Am. Coll. Cardiol.
56, 1113–1132 (2010).
4. Lorenzo, C., Okoloise, M., Williams, K., Stern, M. P. & Haffner, S. M. The metabolic syndrome as predictor of type 2 diabetes: The
San Antonio Heart Study. Diabetes Care 26, 3153–3159 (2003).
5. Merlotti, C., Ceriani, V., Morabito, A. & Pontiroli, A. E. Subcutaneous fat loss is greater than visceral fat loss with diet and exercise,
weight-loss promoting drugs and bariatric surgery: A critical review and meta-analysis. Int. J. Obes. 2005(41), 672–682 (2017).
6. Le Roy, C. I. et al. Dissecting the role of the gut microbiota and diet on visceral fat mass accumulation. Sci. Rep. 9, 9758 (2019).
7. Nie, X. et al. A metagenome-wide association study of gut microbiome and visceral fat accumulation. Comput. Struct. Biotechnol.
J. 18, 2596–2609 (2020).
8. Campbell, W. W., Kim, J. E., Amankwaah, A. F., Gordon, S. L. & Weinheimer-Haus, E. M. Higher total protein intake and change
in total protein intake affect body composition but not metabolic syndrome indexes in middle-aged overweight and obese adults
who perform resistance and aerobic exercise for 36 weeks. J. Nutr. 145, 2076–2083 (2015).
9. Huang, G. et al. Effect of protein intake on visceral abdominal fat and metabolic biomarkers in older men with functional limita-
tions: Results from a randomized clinical trial. J. Gerontol. A. Biol. Sci. Med. Sci. https://doi.org/10.1093/gerona/glab007 (2021).
10. Takahira, M. et al. Randomized, double-blind, controlled, comparative trial of formula food containing soy protein vs. milk protein
in visceral fat obesity. FLAVO study. Circ. J. Off. J. Jpn. Circ. Soc. 75, 2235–2243 (2011).
11. Blachier, F. et al. High-protein diets for weight management: Interactions with the intestinal microbiota and consequences for gut
health. A position paper by the my new gut study group. Clin. Nutr. https://doi.org/10.1016/j.clnu.2018.09.016 (2018).
12. Sonnenburg, J. L. & Bäckhed, F. Diet-microbiota interactions as moderators of human metabolism. Nature 535, 56–64 (2016).
13. Wu, G. D. et al. Linking long-term dietary patterns with gut microbial enterotypes. Science 334, 105–108 (2011).
14. Zhernakova, A. et al. Population-based metagenomics analysis reveals markers for gut microbiome composition and diversity.
Science 352, 565–569 (2016).
15. Liu, R. et al. Gut microbiome and serum metabolome alterations in obesity and after weight-loss intervention. Nat. Med. 23,
859–868 (2017).
16. Koh, A. et al. Microbially produced imidazole propionate impairs insulin signaling through mTORC1. Cell 175, 947-961.e17
(2018).
17. Karlsson, F. H. et al. Gut metagenome in European women with normal, impaired and diabetic glucose control. Nature 498, 99–103
(2013).
18. Aron-Wisnewsky, J. & Clément, K. The gut microbiome, diet and links to cardiometabolic and chronic disorders. Nat. Rev. Nephrol.
12, 169–181 (2016).
19. Cotillard, A. et al. Dietary intervention impact on gut microbial gene richness. Nature 500, 585–588 (2013).
20. David, L. A. et al. Diet rapidly and reproducibly alters the human gut microbiome. Nature 505, 559–563 (2014).
21. Walker, A. W. et al. Dominant and diet-responsive groups of bacteria within the human colonic microbiota. ISME J. 5, 220–230
(2011).
22. Salonen, A. et al. Impact of diet and individual variation on intestinal microbiota composition and fermentation products in obese
men. ISME J. 8, 2218–2230 (2014).
23. Dong, T. S. et al. A high protein calorie restriction diet alters the gut microbiome in obesity. Nutrients 12, 3221 (2020).
24. Alberti, K. G. M., Zimmet, P. & Shaw, J. The metabolic syndrome—A new worldwide defi ition. Lancet 366, 1059–1062 (2005).
25. Labonté, M. -È., Cyr, A., Baril-Gravel, L., Royer, M.-M. & Lamarche, B. Validity and reproducibility of a web-based, self-admin-
istered food frequency questionnaire. Eur. J. Clin. Nutr. 66, 166–173 (2012).
26. Nielsen, H. B. et al. Identifi ation and assembly of genomes and genetic elements in complex metagenomic samples without using
reference genomes. Nat. Biotechnol. 32, 822–828 (2014).
27. Holmes, I., Harris, K. & Quince, C. Dirichlet multinomial mixtures: Generative models for microbial metagenomics. PLoS ONE
7, e30126 (2012).
28. Abubucker, S. et al. Metabolic reconstruction for metagenomic data and its application to the human microbiome. PLoS Comput.
Biol. 8, e1002358 (2012).
29. Vieira-Silva, S. et al. Species–function relationships shape ecological properties of the human gut microbiome. Nat. Microbiol. 1,
16088 (2016).
30. Darzi, Y., Falony, G., Vieira-Silva, S. & Raes, J. Towards biome-specific analysis of meta-omics data. ISME J. 10, 1025–1028 (2016).
31. Oksanen, J. et al. vegan: Community Ecology Package (2020).
32. Ajala, O., English, P. & Pinkney, J. Systematic review and meta-analysis of different dietary approaches to the management of type
2 diabetes. Am. J. Clin. Nutr. 97, 505–516 (2013).
Scientific Reports | (2021) 11:15620 | https://doi.org/10.1038/s41598-021-94916-9 11
Vol.:(0123456789)www.nature.com/scientificreports/
33. Leidy, H. J., Carnell, N. S., Mattes, R. D. & Campbell, W. W. Higher Protein Intake Preserves Lean Mass and Satiety with Weight
Loss in Pre-obese and Obese Women. Obesity 15, 421–429 (2007).
34. Piatti, P. M. et al. Hypocaloric high-protein diet improves glucose oxidation and spares lean body mass: Comparison to hypocaloric
high-carbohydrate diet. Metabolism 43, 1481–1487 (1994).
35. Noakes, M., Keogh, J. B., Foster, P. R. & Clifton, P. M. Effect of an energy-restricted, high-protein, low-fat diet relative to a conven-
tional high-carbohydrate, low-fat diet on weight loss, body composition, nutritional status, and markers of cardiovascular health
in obese women. Am. J. Clin. Nutr. 81, 1298–1306 (2005).
36. Farnsworth, E. et al. Effect of a high-protein, energy-restricted diet on body composition, glycemic control, and lipid concentra-
tions in overweight and obese hyperinsulinemic men and women. Am. J. Clin. Nutr. 78, 31–39 (2003).
37. Le Chatelier, E. et al. Richness of human gut microbiome correlates with metabolic markers. Nature 500, 541–546 (2013).
38. Aron-Wisnewsky, J. et al. Major microbiota dysbiosis in severe obesity: Fate after bariatric surgery. Gut https://doi.org/10.1136/
gutjnl-2018-316103 (2018).
39. Vandeputte, D. et al. Quantitative microbiome profiling links gut community variation to microbial load. Nature 551, 507–511
(2017).
40. Beaumont, M. et al. Quantity and source of dietary protein influence metabolite production by gut microbiota and rectal mucosa
gene expression: A randomized, parallel, double-blind trial in overweight humans. Am. J. Clin. Nutr. 106, 1005–1019 (2017).
41. Natividad, J. M. et al. Bilophila wadsworthia aggravates high fat diet induced metabolic dysfunctions in mice. Nat. Commun. 9,
2802 (2018).
42. Windey, K. et al. Modulation of protein fermentation does not affect fecal water toxicity: A randomized cross-over study in healthy
subjects. PLoS ONE 7, e52387 (2012).
43. Muegge, B. D. et al. diet drives convergence in gut microbiome functions across mammalian phylogeny and within humans. Science
332, 970–974 (2011).
44. Yatsunenko, T. et al. Human gut microbiome viewed across age and geography. Nature 486, 222 (2012).
45. Massey, L. K., Sokatch, J. R. & Conrad, R. S. Branched-chain amino acid catabolism in bacteria. Bacteriol. Rev. 40, 42–54 (1976).
46. Rudman, D. & Meister, A. Transamination in Escherichia coli. J. Biol. Chem. 200, 591–604 (1953).
47. Fouillet, H. et al. Urea-nitrogen production and salvage are modulated by protein intake in fed humans: Results of an oral stable-
isotope-tracer protocol and compartmental modeling. Am. J. Clin. Nutr. 87, 1702–1714 (2008).
48. Beaumont, M. et al. Structure of protein emulsion in food impacts intestinal microbiota, caecal luminal content composition and
distal intestine characteristics in rats. Mol. Nutr. Food Res. 61, 1700078 (2017).
Acknowledgements
The clinical investigations were performed at the Human Nutrition Research Center (CRNH Ile de France),
Institute of Cardiometabolic and Nutrition, Pitié-Salpêtrière Hospital and at the Clinical Investigation Unit of
the Institute on Nutrition and Functional Foods, Universté Laval. We thank the medical and paramedical staff
of both clinical investigation platforms for their contributions to patients phenotyping data collection, as well as
the nurses and technicians, and of course, the patients themselves for their invaluable contribution. We thank Dr
Amine Ayed for visceral fat measurements on CT scans. We thank Mrs Pascale Thevenot (YSOPIA Bioscience)
who was instrumental for clinical study coordination.
Author contributions
K.C., P.B.L., B.L. and S.P.C. conceived the research question. K.C., P.B.L. and S.P.C. interpreted data and wrote the
manuscript. E.B. and E.P. implemented the metagenomics pipeline and E.B., E.P., P.B.L. and M.C.D. performed
bioinformatics and metagenomic analysis. W.C. performed statistical analysis of the clinical study. B.L. and K.C.
respectively coordinated the clinical study in Canada and France. S.P.K. implemented shotgun metagenomic
sequencing. L.R., and X.W. designed, executed and interpreted results from the in vitro batch fermentation study.
All authors reviewed and approved the manuscript.
Funding
Th s study was supported by several sources: YSOPIA Bioscience sponsored the clinical investigation study.
Funding for the detailed microbiota study (sequencing and analysis) were obtained from the French National
Agency of Research ANR (“Investissement d’Avenir” FORCE, the Metagenopolis Grant ANR-11-DPBS-0001
and ICAN, reference ANR-10-IAHU-05) as well as European Union, FP7-sponsored program METACARDIS
(HEALTH-F4-2012-30531). Grants were also obtained by JPI (A healthy diet for a healthy life; 2017-01996_3)
and the Leducq Foundation (Transatlantic Networks of Excellence Award 17CVD01).
Competing interests
SPC works as Chief Scientifi Officer at YSOPIA Bioscience (Bordeaux, France). LR works as project manager at
YSOPIA Bioscience (Bordeaux, France). KC is currently a member of the Scientific Advisory board of YSOPIA
Bioscience but this activity is not related to the topic of this publication. All the other authors declare no confli t
of interest.
Additional information
Supplementary Information The online version contains supplementary material available at https://doi.org/
10.1038/s41598-021-94916-9.
Correspondence and requests for materials should be addressed to S.P.C. or K.C.
Reprints and permissions information is available at www.nature.com/reprints.
Publisher’s note Springer Nature remains neutral with regard to jurisdictional claims in published maps and
institutional affiliations.
Scientific Reports | (2021) 11:15620 | https://doi.org/10.1038/s41598-021-94916-9 12
Vol:.(1234567890)www.nature.com/scientificreports/
Open Access Th s article is licensed under a Creative Commons Attribution 4.0 International
License, which permits use, sharing, adaptation, distribution and reproduction in any medium or
format, as long as you give appropriate credit to the original author(s) and the source, provide a link to the
Creative Commons licence, and indicate if changes were made. The images or other third party material in this
article are included in the article’s Creative Commons licence, unless indicated otherwise in a credit line to the
material. If material is not included in the article’s Creative Commons licence and your intended use is not
permitted by statutory regulation or exceeds the permitted use, you will need to obtain permission directly from
the copyright holder. To view a copy of this licence, visit http://creativecommons.org/licenses/by/4.0/.
© The Author(s) 2021
Scientific Reports | (2021) 11:15620 | https://doi.org/10.1038/s41598-021-94916-9 13
Vol.:(0123456789)You can also read