Providing Positively for Pedestrians Enabling better practice - Tim Hughes
←
→
Page content transcription
If your browser does not render page correctly, please read the page content below
Providing Positively
   for Pedestrians

Enabling better practice

                 Tim Hughes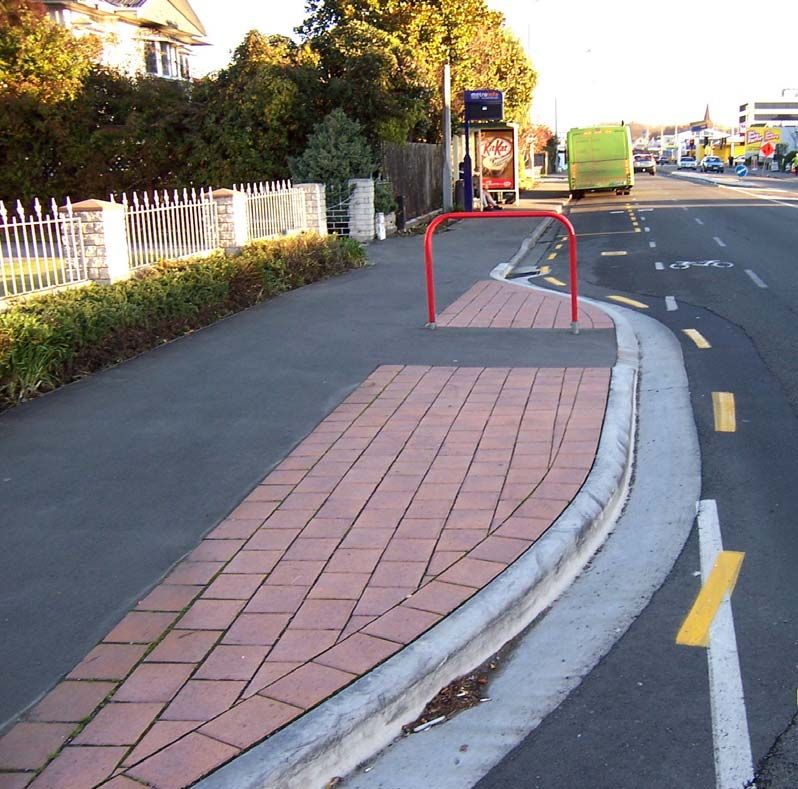
NZ policy context

Promoting walking and cycling is government policy
New Zealand Transport Strategy
Getting there on foot by cycle
Road safety to 2010 strategy, - 2020 strategy being prepared
Walking and Cycling Strategic Plans
Funding from Land Transport Fund
Part of every project
International Pedestrian Charter
uNZTS target: almost double active modes by 2040 (17% - 30%).
Getting There - Goals

Community environments and transport
systems that support walking and cycling.

More people choosing to walk and cycle,
more often.

Improved safety for pedestrians and cyclists.
Local policy context

Pedestrian strategy
Cycling strategy
Road safety strategy
Parking strategy
Living streets charter
Metropolitan transport strategy
Long term council community plan
Part of every project
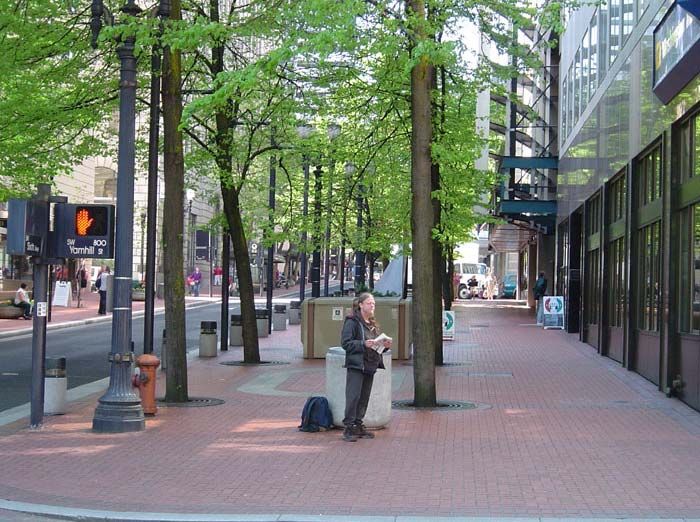
Walk 21 Conference Conclusions

Health
H1. People who live in walkable neighbourhoods walk one hour per week
more than those who live in less walkable neighbourhoods. By doing so
they meet forty per cent of their physical activity target and halve their risk
of being overweight. Developing neighbourhoods where people can walk
must be a key component of public policy.

H2. Inactivity is the biggest killer in western societies. Everyone who
promotes walking is thus a health professional with a vital message.
Safe increase in use?

Strategies aims to both:
    increase walking
    reduce the road toll
Is this possible?
   Safety in numbers effect?
   Taming traffic
   Better walking facilities
   Perceptions that walking is safe - key to more walking

                               YES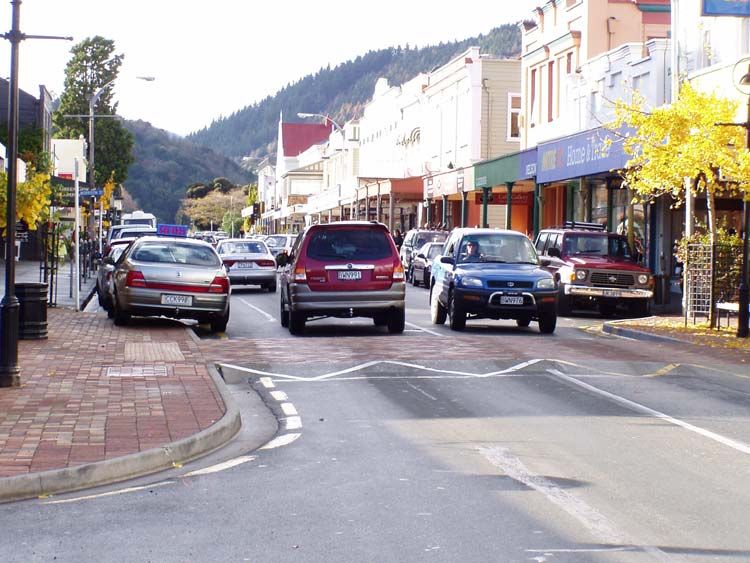
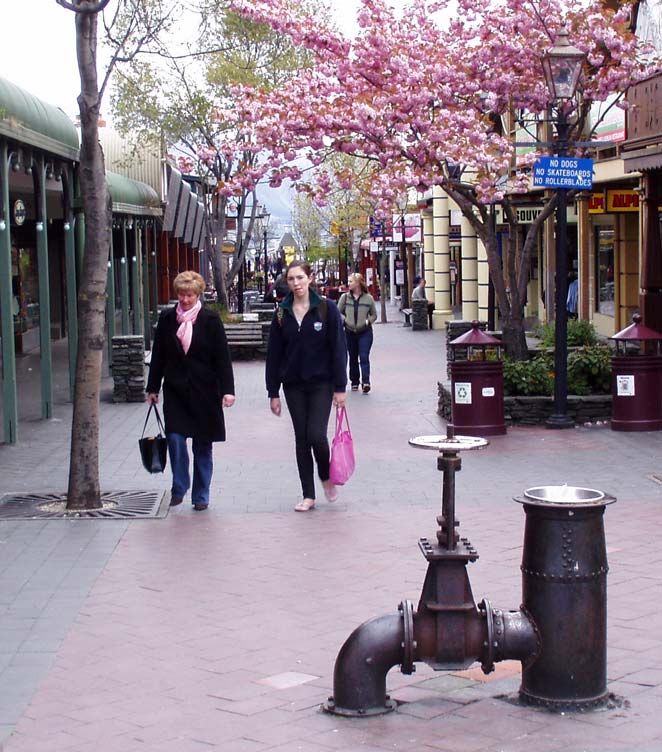
Safety in Numbers

The more pedestrians present,
      the lower the risk for each pedestrian
Reasons? Behavioural adjustments by road users
    power relationship: 100% increase in walking/cycling,
                         32% increase in casualties (Jacobsen)
    NZ data (Turner) suggests the effect may be even more
    powerful at low pedestrian numbers (up to one per minute)
    The effect is observed on individual roads and intersections,
    between different towns in New Zealand and between countries
Example of Effect – Turner (2005)

                                    Midblock pedestrian crashes & risk
                                        (vehicle flow 12,000 per day)

                    0.10                                                       0.0003
                    0.09
                                                                               0.0003
                    0.08
Pedestrian crashes per

                    0.07

                                                                                        Risk per crossing
                                                                               0.0002

                                                                                           pedestrian
                    0.06
          year

                    0.05                                                       0.0002
                    0.04
                                                                               0.0001
                    0.03
                    0.02
                                                                               0.0001
                    0.01
                    0.00                                                       0.0000
                              500      1000        1500     2000     2500   3000
                                      Pedestrians crossing per day

                                              No. Crashes   Risk
Guidance

Austroads Guide part 13: Pedestrians
TRAFINZ Guide to pedestrian crossing facilities

RTS 14 providing for vision impaired pedestrians
Pedestrian planning and design guide
Crossing choice calculation spreadsheet
Non-motorised user audit & review
Community street review
Pedestrian planning and design guide

                Purpose:
                •To improve New Zealand’s
                walking environment
                •A process for deciding on the
                types of provision that should
                be made for walking.
                •Design advice and standards
Pedestrian planning and design guide
An encyclopaedia of existing good practice,
pointing out the best from other guides.
Adding to it based on recent research findings
Planning and policy context
Principles of pedestrian planning
Pedestrian planning process
Design of walking infrastructure
Monitoring and promotion
ReferencesWalkable communities Connected Legible Comfortable Convenient Pleasant Safe Secure Universal Accessible
The design pedestrian?

   Capable adults
   Children
   Elderly
   On small recreational wheels
   Mobility impaired;
         sticks, wheelchairs, frames, scooters
   Vision and hearing impaired

All of the above
Road User Hierarchy
Ranks the importance of road users:
People with mobility impairments
Pedestrians
Cyclists
Public transport users
Increasing Importance
Powered two-wheelers
Commercial/business
Car-borne shoppers
Car-borne visitors
Car-borne commutersFootpath standards
Continuous accessible path
Width: - 1.8 m preferred,
1.5 m minimum
Crossfall: - 1% preferred,
2% maximumChristchurch Hospital Admissions
Source: Tony FrancisHospital
admisisons
00
-0
4
0
20
40
60
80
100
120
140
160
180
05 ye
-0 ars
9
10 ye
-1 ars
4
15 ye
-1 ars
9
20 ye
-2 ars
4
25 ye
-2 ar
9 s
30 ye
-3 ars
4
35 ye
-3 ars
9
40 ye
-4 ars
4
45 ye
-4 ar
9 s
2001 - 2003
50 ye
-5 ars
4
55 ye
Age group
-5 ars
9
60 ye
-6 ars
4
65 ye
-6 ars
9
70 ye
-7 ar
Fall on same level from slipping, tripping and stumbling
4 s
75 ye
-7 ars
9
80 ye
-8 ars
4
y
85 e a
+ rs
ye
ar
s
NZ Hospital admissions from falls in road environment, by ageFootpath safety standards
Reduce fall hazards:
Slips: - friction specs
e.g. cof = 0.4 + (0.125 * %slope)
Trips: - sudden lip,Footpath standards
Driveways – cross footpaths
not vice versaFootpath standards
Kerb crossings – oriented to pedestrian route
- top and bottom landings,
- gentle slopes 8 % normal maxPedestrian risk of injury crossing road by age
Pedestrians injured/ million road crossings
1.6
1.4 Males
Females
1.2
1.0
0.8
0.6
0.4
0.2
0.0
80+
0-4
5-9
10-14
15-19
20-24
25-29
30-34
35-39
40-44
45-49
50-54
55-59
60-64
65-69
70-74
75-79
Age group
Source: NZ Household Travel SurveyWhat traffic speed?
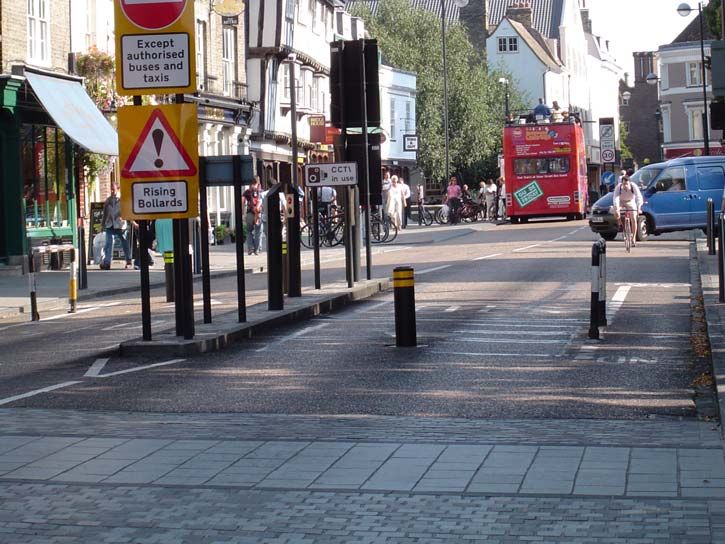
Current 50km/h LimitProviding for pedestrians crossing roads Hierarchy of Pedestrian Solutions Consider in this order: • Reduce traffic volume • Reduce traffic speed • Reallocate space (road diet?) • At-grade crossing facilities • Grade separation
Old NZ Warrants approach for
priority pedestrian facilities
Pedestrian Operated Signals:
Pedestrians x vehicles > 200,000 (1 hr)
Vehicle flow > 500 (1 hr)
Pedestrian flow should be > 200 (1 hr)
Zebra Pedestrian Crossings:
Pedestrians x vehicles > 45,000 (1 hr)
Vehicle flow > 300 (1 hr)
Pedestrian flow should be > 100 (1 hr)
School Patrol Zebra Crossing Points:
Pedestrians x vehicles > 5,000 (1/2 hr)
Vehicle flow > 100 (1/2 hr)
Pedestrian flow should be > 50 (1/2 hr)
School Patrol (Kea) Crossing Points:
Pedestrians x vehicles > 3,000 (1/2 hr)
Vehicle flow should be > 100 (1/2 hr)
Pedestrian flow should be > 50 (1/2 hr)
A Christchurch study concluded that pedestrian delay is a factor that should also be taken into account when
assessing the need for priority pedestrian facilities. At uncontrolled crossing point facilities, adult pedestrians were
prepared to accept average delays of 15 second on local and collector roads and 30 seconds on arterial routes.
If delays are greater than this, pedestrians take risks crossing the roadway.Providing pedestrian crossing facilities Then consider in this order: o Road environment and land use context o Physical aids to crossing o Appropriate control o Design Detail
Road environment and land use context
o Traffic volume and composition
• Gaps in traffic, space needed
o Speed of traffic
• Speed management / traffic calming needed?
• Platform appropriate?
o How many traffic lanes in each direction?
• Are zebras possible?
o Road surrounds: CBD, commercial, residential
• What will users expect here?
o Where do they cross and to where?
• One place? Spread out? In a hurry?
o Who wants to cross, how many?
• Age, walking purpose, school, impaired, suppressed?
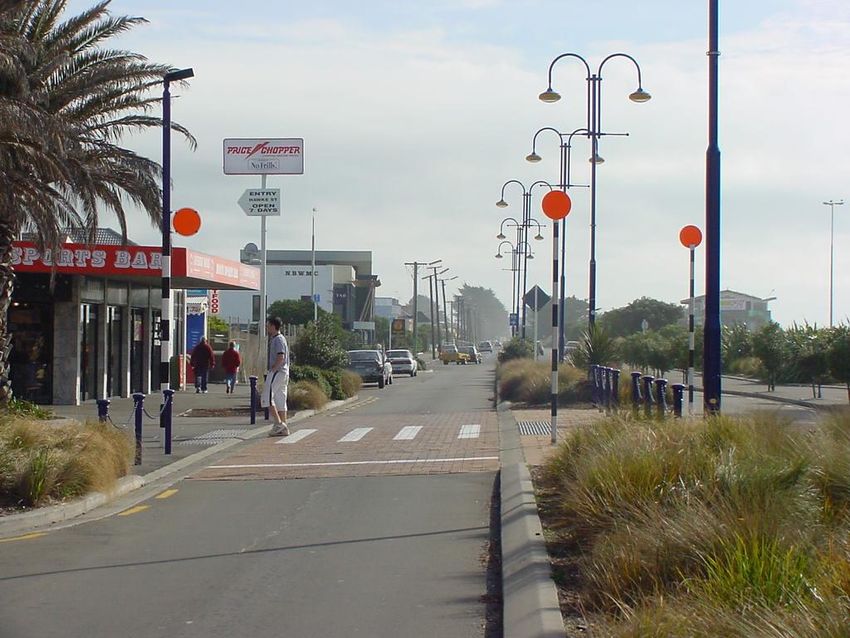
What type of facilities are appropriate here?Physical crossing aids
Narrow roadway by kerb
protrusions
• Safety benefit 36% crash
reduction
• Pedestrian delay
below 15 seconds up to
600 vehicles per hour (2 way)Physical crossing aids
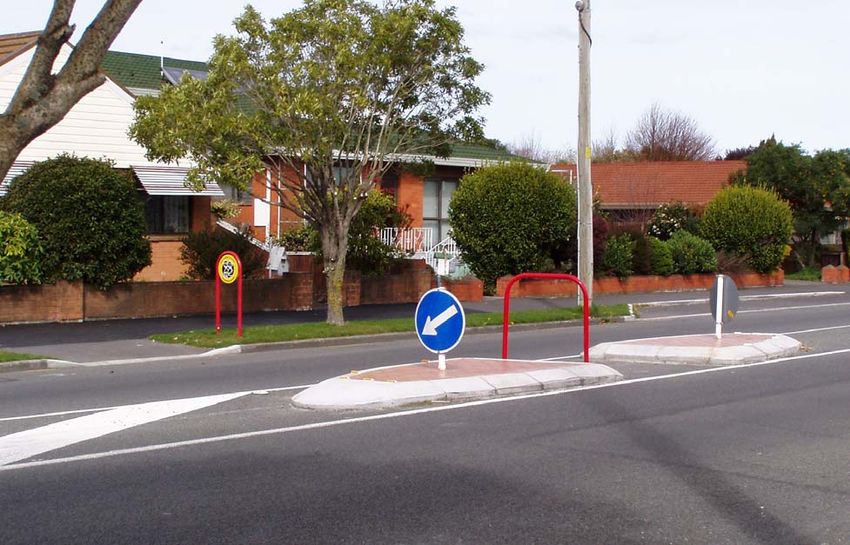
Divide crossing into two parts: Central raised islands
• Crash reduction 18%
• Average pedestrian delay below 15 seconds up to 1800 vehicles per hour (two
way)
• Delay reduction - awesome !!!Physical crossing aids
– uninterrupted flow
Without Physical Aid
Mean Queuing Delay to Pedestrians
Kerb Extensions
Note: Chart varies according to inputs entered for flow type,
Median Refuge
number of lanes, lane widths, pedestrian profile and walk
speeds. Kerb Extensions & Median Refuge
50.0
Unsatisfactory
45.0
(LOS F)
40.0
Mean Delay (secs)
Inappropriate for
35.0 All Situations
30.0
Major Concern
25.0
(LOS E)
20.0
Some Concern (LOS D) Appropriate for
15.0 Minor Arterial Roads
Satisfactory (LOS C) Major Arterial Roads
10.0
Very Good (LOS B) Appropriate for
5.0 Local Streets
Excellent (LOS A) Collector Roads
0.0
0 500 1000 1500 2000
Traffic Volume, Average Peak Hourly (veh/hr)Calculation tool For all at grade options except signals: o Excludes dumb options o Calculates delays to motorists and pedestrians o Estimates typical crash rates and reductions o Summary sheet compares options o Supports decision on best option
Zebra Crossings
Zebra Crossings

o   Never use across two lanes of traffic
    in the same direction.

o   Consider delay to all users.

o   There are no safety benefits from
    zebra installation, often the converse.

o   So, consider where lots of pedestrians
    are delayed unacceptably,
    physical aids are not sufficient,
    and consider balance of vehicle and
    pedestrian delay in road user
    hierarchy.
Typical safety benefits
Measure reduction
pedestrians overall
Kerb extensions 36 %
Raised Median Island 18 %
Kerb ext + Island 32 %
Kerb ext at existing zebra 44 %
Zebra plus Platform 88 %
Midblock traffic signals 64 % 35 %
Zebra only - 28 % - 26 %
School patrols 35 %Typical safety benefits
Measure crash reduction
pedestrians overall
Intersection signals - parallel phase -8 % -
Intersection signals – exclusive phase 29 % 22 %
Cycle lanes 30 % 30 %
Roundabouts 48 % 35 %
Flush medians 30 % 19 %Implications Better planning concepts and processes for walking infrastructure More comprehensive and context sensitive guidance - choose best option don’t just rely on warrants Put the right facility in the right place Design it better – revise standard drawings “Every project is a walking project”
Next steps

   For Land Transport NZ
   –   Training workshops
   –   Benchmarking performance for walking
   –   Research on walkability assessment
   –   Research to measure accessibility
   Suggestions for councils?
   –   Adopt or update pedestrian strategies
   –   Adopt national guidance tools
   –   Neighbourhood accessibility plans
   –   Community street reviews

You are the people that make it happen
The Pedestrian Planning and Design Guide and related tools are
on the NZ Transport Agency web site.

Hard copies available for $30 each.

Order on website.

Same samples on NZTA stand

                                  www.nzta.govt.nz
The Pedestrian Planning and Design Guide and related tools are
on the NZ Transport Agency web site.
Hard copies available for $30 each.
Order on website.
www.nzta.govt.nzNew Zealand Transport Agency Integration: More joined up planning of land use and transport. Development that minimise future transport demands e.g. by providing a variety of facilities within short distances. Providing for a wider choice of transport modes – more use of active modes. Safer travel for all
New Zealand Transport Agency

Funding:
  Making the process easier and more predictable.
  More strategic analysis to get the optimum mix of
  projects identified early.
  Streamlined funding of integrated packages of projects
  that work together. e.g a strategic walking and cycling
  plan.
  Developing different approaches to achieve more value
  for money.
  Working with partners for better transport solutions.
You can also read