Qatar - USER EXPERIENCE ON MOBILE NETWORKS
←
→
Page content transcription
If your browser does not render page correctly, please read the page content below
USER EXPERIENCE ON MOBILE NETWORKS

            Qatar
           May 2021
ABOUT THE DATA
   Total number of samples:              97,866

   Total number of unique devices:       55,625

   Data collection period:               17 May - 31 May 2021

                    ABOUT THE REPORT
SpeedChecker aims to benchmark operators on the user experience and,
therefore, the metrics in this report are designed with this in mind. Users
accessing the services on the Internet are affected not only by the quality of
the radio access network but also by other factors such as the mobile
device performance, network backhaul capacity and interconnections to
other networks.

Our methodology is designed to take into account all of those factors. Our
metrics do not show the highest possible speeds or the lowest latencies
that a particular operator can provide locally. The majority of the content
accessed on the Internet is on CDNs and that is why SpeedChecker uses
CDNs to perform the tests. Operators who have great radio access network
as well as great connections to CDNs offer superior user experience and
score better in our reports.
MNO SPEED BENCHMARK
The following table shows average download and upload speeds per MNO.

The measurements were made across the whole country and across the whole
spectrum of available Radio Access Technologies (3G, 4G, 5G if available).

                                                                        95% Confidence interval
                                                               (±X %) change from Nov 2020

Ooredoo                                                                         23,581 samples

Download speed (Mb/s)                                42.37                         +/- 0.85 (+24%)

Upload speed (Mb/s)             15.09             +/- 0.32                                     (-1%)

Vodafone                                                                        23,796 samples

Download speed (Mb/s)                   25.41                +/- 0.53                         (+19%)

Upload speed (Mb/s)          8.64      +/- 0.24                                               (-24%)

            MNO LATENCY BENCHMARK
As described in our data collection methodology, latency is measured to the CDN
endpoints. Operators who interconnect with CDNs well tend to offer better user
experience in latency-sensitive applications as well as score well in our latency
comparison.

                                                                        95% Confidence interval
                                                               (±X %) change from Nov 2020

Ooredoo                                                                         22,469 samples

Latency (ms)                   42.68         +/- 0.44                                         (-96%)

Vodafone                                                                        21,584 samples

Latency (ms)                                        143.46                         +/- 0.47   (-34%)
5G SPEEDS DON’T TELL THE WHOLE STORY
5G headline speeds may look impressive but how often a consumer with a 5G
phone can enjoy them? SpeedChecker reports average speeds on 5G handsets as
a primary metric for evaluating 5G experience. Operators who consistently deliver
good speeds in many areas will do better than operators providing gigabit 5G
with limited coverage.
                                                             95% Confidence interval

Ooredoo                                                                 7,301 samples

Avg. 5G phone speed (Mb/s)                           78.43                        +/- 2.98

Vodafone                                                                3,508 samples

Avg. 5G phone speed (Mb/s)                          75.69                        +/- 3.54

       MNO 5G PHONE UPGRADE INDEX
5G phone upgrade index shows typical increase in speeds when customers
upgrades from LTE-only phone to 5G capable phone and stays on the same
network.

Ooredoo
           1.9x increase

Vodafone
                       3x increase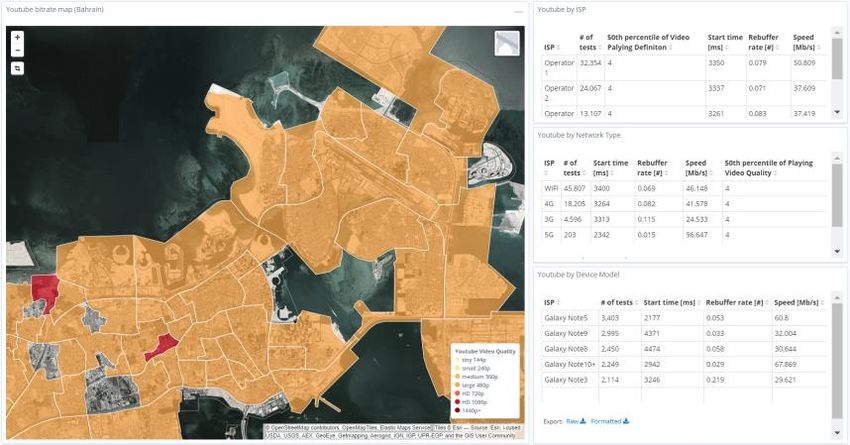
REGIONAL COMPARISON OF MNO
     DOWNLOAD SPEED PERFORMANCE
Average download speed performance across all technologies in different
regions.

   Ooredoo                                           Vodafone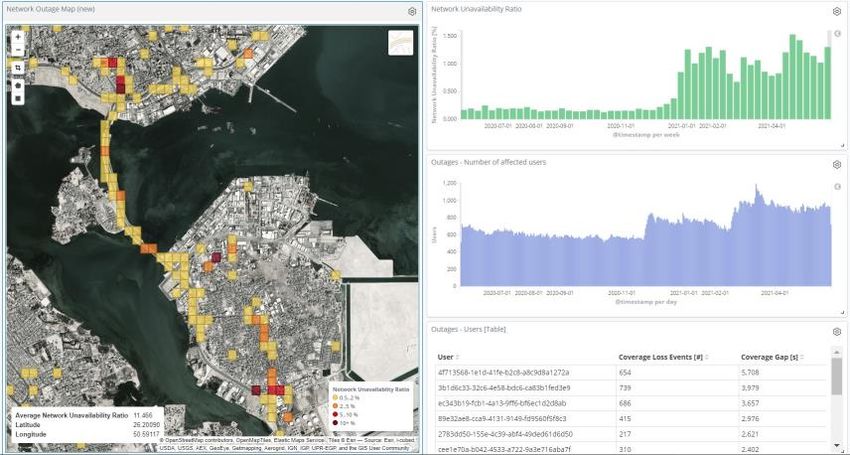
REGIONAL 5G PHONE EXPERIENCE
Who offers the best 5G in each region? The following map shows all
measurements from 5G phones. If 5G phone connects to 4G (e.g. due to
lack of coverage) we still include those measurements in the calculation of
5G phone experience.

  Ooredoo                    1st in 6 regions

  Vodafone                   1st in 2 regions
AVERAGE DOWNLOAD SPEEDS
         IN DIFFERENT REGIONS OF QATAR
The following table shows the average download speeds in different regions of
Qatar. The 2nd column is an average of all MNOs in a particular region.
The fastest regions are at the top of the table measured in Mb/s.

 REGION                                 ALL OPERATORS         OOREDOO   VODAFONE TEST COUNT #

 Doha                                        48.30              57.79    36.77      12,454
 Umm Salal                                   34.54              40.97    28.56       4,820
 Al Khawr                                    33.16              38.78    25.06       2,557
 Ash Shamal                                  31.23              39.86    19.46        397
 Al Ghuwariyah                               28.45              46.64    11.34        133
 Ar Rayyan                                   28.12              36.26    21.57      18,532
 Al Wakrah                                   27.82              35.90    19.89       5,320
 Al Jamiliyah                                21.13              26.62    11.87        784
 Jariyan Al Batnah                           20.59              25.15    15.70       2,000
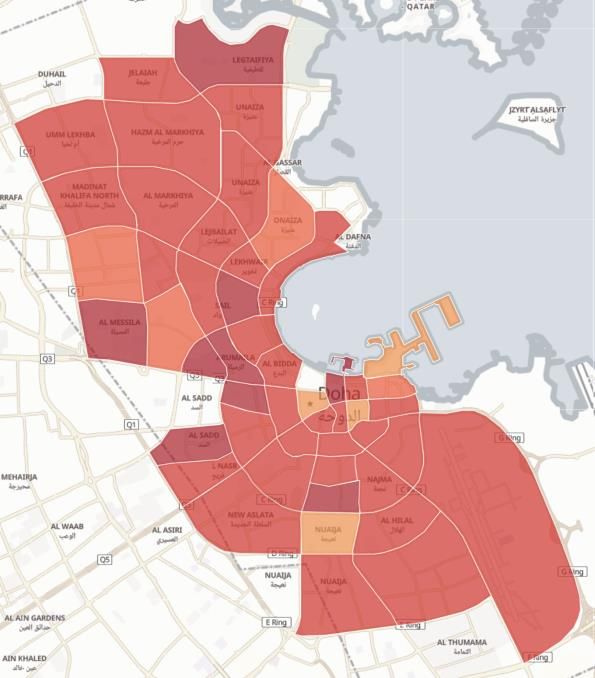
MNO DOWNLOAD SPEED
      PERFORMANCE IN DOHA

Ooredoo

Vodafone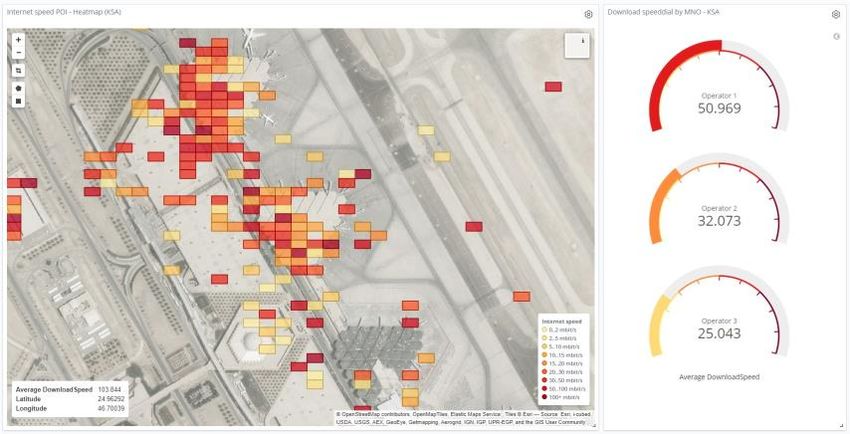
ARE YOU LOOKING FOR MORE DETAILED
  CROWDSOURCED DATA IN QATAR?
What you see in this free report is a high-level snapshot of the
crowdsourced data we offer to our clients.
Our crowdsourcing system contains billions of data points collected from
mobile devices worldwide.
Unlike our competitors, we can sell access to the data with different
granularity: Our clients can pick data they need with significant cost savings
associated with a reduced scope.

    CONTACT US FOR MORE INFORMATION
FLEXIBILITY IS IN OUR DNA
Our customers value our flexible and modular approach in delivering our
solutions. There is no one size fits all in providing crowdsourcing projects.
Customers increasingly require tailored solutions which will satisfy
all technical, operational and legal requirements.

         With reduced scope comes reduced price. Our Basic KPI set is a
         more cost effective way to get speed test data. Our Advanced KPI
         set is more comprehensive with 100+ active and passive KPIs.

         Crowdsourcing is about trade-offs. Do you want more tests or do
         you want tests to run longer ? Do you want to collect data
         passively without impacting the network and user bandwidth or
         run active tests which will stress and assess the capacity better?

         Do you want us to host the solution for fast & easy deployment or
         do you require data to be within your data center for compliance
         purposes?

         You not only want the data but you also want your own app or
         web-based tester? We can do it all. Our team can produce iOS,
         Android, HTML, Windows and MAC clients tailored to your specific
         needs.

                   CONTACT US FOR MORE INFORMATION
BASIC CROWDSOURCING SYSTEM
Our Basic Crowdsourcing System offers full analytical options like our
Advanced system but with the limitation of a smaller Basic KPI set.
Internet Speeds See Full Screen image
Basic KPIs include speed test data along with device and network information but do not
contain Streaming Video, detailed Radio KPI’s nor passive measurements.
ADVANCED CROWDSOURCING SYSTEM
Step up from our Basic system to our Advanced Crowdsourcing system with
more than 100+ KPIs to analyse
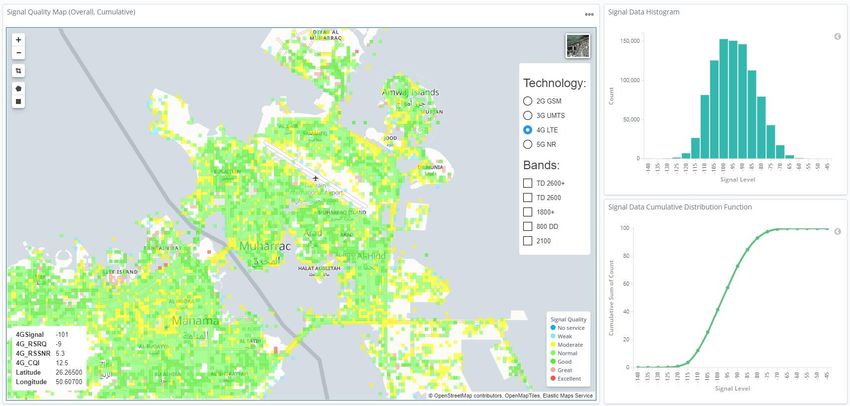
Coverage Analysis See Full Screen image
• Statistical research on the basis of millions of crowdsourced samples
• Multiple signal metrics RSRP, RSRQ, SNR, RSSI, CQI
• Split by MNO, Radio Access Type, Band (down to individual ARFCN)
• Possibility to filter by: Speed (e.g. High Speed Scenario) and IndoorADVANCED CROWDSOURCING SYSTEM
YouTube Quality
YouTube quality dashboard
provides information about
YouTube regional
performance. It features
metrics such as YouTube
playing definition, buffering
time, start delay.
See Full Screen image
Social Media
Experience
Social media experience
dashboard shows regional
performance of major social
media platforms such as
Facebook, Google and
Twitter.
See Full Screen image
Point of Interest
Performance
Reveals Internet
performance in specific
important locations such
as Airports, Malls,
Stadiums and other places
located outside of drive
test routes.
See Full Screen imageADVANCED CROWDSOURCING SYSTEM
Outages
Network Availability is the
number one metric for any
network. While OSS data
provides overall information,
crowdsourcing is able to
spot exact locations where
subscribers are not able to
attach to the network.
See Full Screen image
Voice Quality
The Voice Quality
dashboard shows the user
issues visualized on a map
to spot any areas where
users are making calls and
their quality is not
satisfactory or where calls
are being dropped.
See Full Screen image
Spectrum Usage
Spectrum utilization
dashboard allows the
monitoring of how the
available spectrum is used
in various locations. It may
reveal the load balancing
situation or the fact that
individual band are
overloaded or unloaded.
See Full Screen imageDATA COLLECTION METHODOLOGY
Our data is collected from end user devices running Android and iOS systems. All
measurements are executed towards a CDN that has a large geographical footprint
and hosts a significant part of the content that is being accessed by the users. This
ensures our results are a good approximation of the user’s actual quality of
experience.
All measurements must contain accurate location information using GPS or wi-fi
geolocation methods. Measurements are considered only from the apps that have
been approved by SpeedChecker. Submitted measurements are checked to see if
they are within expected ranges and additional security precautions are
implemented to ensure measurement data is not being manipulated.
The data collection process aims to deliver a single measurement sample from
every device in our crowdsourcing system device pool and we strive to remove all
duplicates. Due to privacy settings on some users phones we cannot reliably detect
unique devices therefore some devices have contributed to more than 1
measurement into this dataset.
MEASUREMENT METHODOLOGY
The methodology is based on the concept of the ITU-T Q.3960 (2016) "Framework
of Internet related performance measurements" and “Supplement 71 to ITU-T Q-
series Recommendations”.
This test methodology aims at delivering an accurate measurement of the
maximum bandwidth available over a given internet connection. This is achieved
by transferring multiple parallel data streams over separate TCP connections
within a predefined amount of time. The transferred data consists of randomly
generated data with high entropy.
# Parameter Unit ITU Range Current Setting
1 Number of parallel threads # 1 ≤ n ≤ 10 Dynamic addition
from 1 to 10
2 Duration of pre-test s 0 ≤ Tp ≤ 5 1s
3 Duration of the downlink s 5 ≤ Td ≤ 15 5s
test
4 Duration of the uplink s 5 ≤ Tu ≤ 15 5s
subtest
5 Number of 'pings' during # 5 ≤ p ≤ 20 p = 10
delay subtest
CONTACT US FOR MORE INFORMATIONYou can also read