Reconstructing Hydrothermal Fluid Pathways and Storage at the Solfatara Crater (Campi Flegrei, Italy) Using Seismic Scattering and Absorption - IRIS
←
→
Page content transcription
If your browser does not render page correctly, please read the page content below
ORIGINAL RESEARCH
                                                                                                                                                published: 31 March 2022
                                                                                                                                          doi: 10.3389/feart.2022.852510

                                            Reconstructing Hydrothermal Fluid
                                            Pathways and Storage at the Solfatara
                                            Crater (Campi Flegrei, Italy) Using
                                            Seismic Scattering and Absorption
                                            Maria Del Pilar Di Martino 1,2, Luca De Siena 3*, Vincenzo Serlenga 4 and Grazia De Landro 5
                                            1
                                              School of Geosciences, University of Aberdeen, Aberdeen, United Kingdom, 2WASM: Mineral, Energy and Chemical
                                            Engineering, Curtin University, Perth, WA, Australia, 3Institute of Geosciences, Johannes Gutenberg University, Mainz, Germany,
                                            4
                                              National Research Council of Italy—Institute of Methodologies for Environmental Analysis (CNR—IMAA), Tito Scalo, Italy,
                                            5
                                              Department of Physics “Ettore Pancini”, University of Naples “Federico II”, Napoli, Italy

                                            Imaging of fluid pathways is crucial to characterize processes taking place in hydrothermal
                           Edited by:       systems, a primary cause of volcanic unrest and associated hazards. The joint imaging of
                     Roberto Sulpizio,
                                            seismic absorption and scattering is an efficient instrument to map fluid flow at crustal
    University of Bari Aldo Moro, Italy
                                            scale, and specifically in volcanoes; however, this technique has so far been applied to
                        Reviewed by:
                 Giovanni Macedonio,        image volcanoes and hydrothermal systems at the kilometre scale. Here, we use data from
     Istituto Nazionale di Geofisica e       a meter-scale, active seismic survey inside the shallow structure of the Solfatara crater to
             Vulcanologia (INGV), Italy
                       Silvia Massaro,
                                            obtain the first frequency-dependent near-surface scattering and absorption model of a
Università degli Studi Aldo Moro, Italy     hydrothermal system. The Solfatara crater is the place used to monitor historic unrest at
                  *Correspondence:          Campi Flegrei caldera (Italy), a high-risk volcano under continuous surveillance due to its
                       Luca De Siena
                                            closeness to a densely populated area. Improving the imaging of the shallow part of this
               ldesiena@uni-mainz.de
                                            system is crucial to broaden the understanding of unrest processes that are progressively
                    Specialty section:      characterizing other portions of the eastern caldera. The scattering contrasts highlight the
         This article was submitted to      primary structural feature, a fault separating the hydrothermal plume from zones of CO2
                          Volcanology,
               a section of the journal     saturation nearing fumaroles. While high-absorption anomalies mark zones of high soil
            Frontiers in Earth Science      temperatures and CO2 fluxes, low-absorption anomalies indicate zones of very shallow
         Received: 11 January 2022          upflow and are caused by contrasts between liquid-rich and vapour-rich fluids coming
        Accepted: 28 February 2022
                                            from mud pools and fumaroles, respectively. All maps show a SW-NE trend in anomalies
         Published: 31 March 2022
                                            consistent with fluid-migration pathways towards the eastern fumaroles. The results
                             Citation:
        Di Martino MDP, De Siena L,         provide structural constraints that clarify mechanisms of fluid migration inside the
 Serlenga V and De Landro G (2022)          crater. The techniques offer complementary geophysical images to the interpretation of
   Reconstructing Hydrothermal Fluid
Pathways and Storage at the Solfatara       hydrothermal processes and prove that seismic attenuation measurements are suitable to
    Crater (Campi Flegrei, Italy) Using     map fluid pathways in heterogeneous media at a detailed scale.
  Seismic Scattering and Absorption.
         Front. Earth Sci. 10:852510.       Keywords: scattering, absorption, hydrothermal system mapping, fluid migration pathways, seismic tomographic
     doi: 10.3389/feart.2022.852510         imaging

Frontiers in Earth Science | www.frontiersin.org                                    1                                           March 2022 | Volume 10 | Article 852510
Di Martino et al.                                                                                                         Hydrothermal Fluids Scattering Absorption Imaging

INTRODUCTION                                                                              dependent parameters like peak-delay time and the
                                                                                          attenuation of coda waves are proven proxies of scattering
Imaging hydrothermal systems in volcanic areas is crucial to                              attenuation and absorption (e.g., at Mount St Helens
forecasting phreatic eruptions (Mayer et al., 2016), assessing risks                      volcano—De Siena et al., 2016). These parameters have shown
of edifice collapse (Rosas-Carbajal et al., 2016) and monitoring                           notable sensitivity to fluid-filled pathways and reservoirs,
the possible evolution toward an unrest stage (Amoroso et al.,                            especially when using active-survey data (Prudencio et al.,
2018). Seismic attenuation measurements, like scattering and                              2013; Ibáñez et al., 2020).
absorption that are suitable to map structures and feeding                                   Peak-delay time (Pd) is a measurement of the strength of
systems in volcanic settings (e.g., De Siena et al., 2016), could                         scattering (Takahashi et al., 2007) that has been recognised as a
be applied to image hydrothermal systems. Scattering and                                  marker of scattering losses (Saito et al., 2002; Calvet and
absorption are the manifestations of the anelastic attenuation                            Margerin, 2013) and is sensitive to structural and geological
of coherent waves, i.e., the energy lost by seismic waves while                           features (e.g., Napolitano et al., 2020). Seismic wave
propagating through a heterogeneous medium. The presence of                               propagation in volcanic areas is primarily affected by
fluids mainly controls absorption, triggered by fluid/squirt flow,                           scattering that dissipates the energy of the coherent waves into
internal friction, viscosity, and thermal relaxation mechanisms                           coda waves (Sato et al., 2012). The attenuation of coda waves
(Barton, 2006), while scattering is caused by the presence of                             (Qc−1) measured from the decay of seismic envelope energy with
heterogeneities and generally highlights tectonic interactions (De                        time (Aki and Chouet, 1975) is a combination of intrinsic
Siena et al., 2016) and lithological contrasts (Napolitano et al.,                        absorption and scattering losses. When coda waves enter the
2020). At the sample scale, ultrasonic attenuation measurements                           diffusive regime, coda attenuation directly measures absorption
are related to the physical rock properties (Vanorio et al., 2002; Di                     (Shapiro, 2000). The multiple scattering/diffusion approximation
Martino et al., 2021). At crustal scale, seismic attenuation is a                         best describes seismograms in volcanic media, primarily if active
pivotal instrument to identify and track the location of fluid and                         sources produce the scattering in the media (Wegler, 2003;
melt reservoirs and, thus, to understand magmatic and                                     Prudencio et al., 2013).
hydrothermal processes in volcanic environments (e.g., De                                    The hydrothermal system of Campi Flegrei caldera
Siena et al., 2017a; De Landro et al., 2019). Frequency-                                  (Southern Italy, Figure 1) is one of the best-studied and

  FIGURE 1 | Solfatara Crater. The topography of Campi Flegrei is shown in the upper right corner, with the survey location in yellow and the Pisciarelli fumarole
  indicated by the green cross. The survey area of the active RICEN experiment is in the yellow box, with station locations in magenta. Main Hydrothermal features: Fangaia
  (mud pool, blue contour) and fumaroles (LS: Le Stufe, BN: Bocca Nuova, and BG: Bocca Grande; in red contours). The stars indicate other fumaroles closest to the
  survey area (after Serra et al., 2016). The inversion grid (black axes) extends between 0 and 160 m in the SN and WE directions. See figure SM-1 for a close-up on
  the location of stations and seismic shots.

Frontiers in Earth Science | www.frontiersin.org                                      2                                            March 2022 | Volume 10 | Article 852510
Di Martino et al. Hydrothermal Fluids Scattering Absorption Imaging
most hazardous in the world. Hydrothermal vents have
progressively opened in the eastern caldera (Giudicepietro
et al., 2021), entering the metropolitan city of Naples (~1
million inhabitants). Hydrothermal activity is one of the
causes of ground deformation and seismicity at the caldera
(Vanorio et al., 2005; Troise et al., 2006; Cusano et al., 2008;
Petrillo et al., 2019; Ricco et al., 2019) and the primary reason
for the onset of recent earthquake swarms across the eastern
caldera (Petrosino et al., 2018; Tamburello et al., 2019;
Akande et al., 2021). There is debate around the source of
fluids likely producing the recent unrest, whose inputs may be
caused by either a deep contribution from a shallow magma
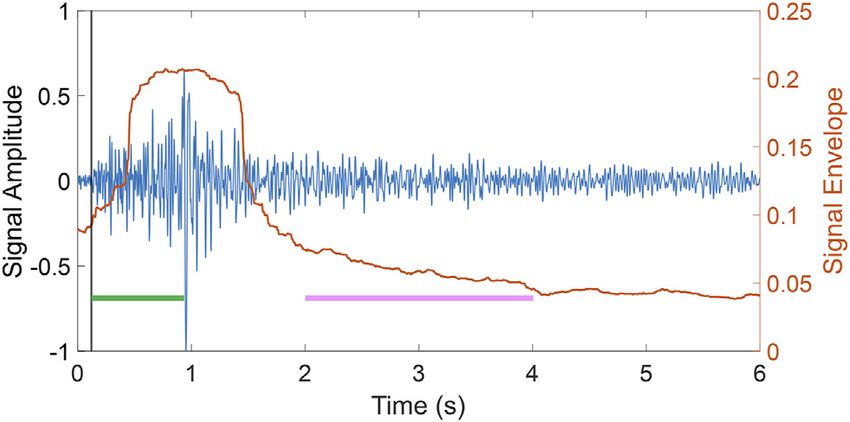
sill (D’Auria et al., 2015; Chiodini et al., 2017), drying of the FIGURE 2 | Signal example. Seismogram (blue) and its envelope
(orange). The vertical black thin line marks the P-wave arrival. The coda
deep hydrothermal system (Moretti et al., 2018; Troise et al.,
window section is represented by the pink line, while the green line shows the
2019) or decarbonisation reaction from the caldera basement peak delay measured on this seismogram.
(Vanorio and Kanitpanyacharoen, 2015). However, there is a
general agreement that in the upper 3 km hydrothermal
processes are more likely taking place than magmatic ones, worldwide. Researchers have analysed the hydrothermal
with the changes of permeability due to rainfalls receiving system at Solfatara by applying ambient noise tomography
attention as a short-term trigger for seismicity and (e.g., Petrosino et al., 2012; Petrosino and De Siena, 2021),
deformation (Akande et al., 2021; Petrosino and De Siena, electrical resistivity tomography and self-potential (e.g.,
2021). Presently, degassing and seismicity are increasing due Byrdina et al., 2014; Gresse et al., 2017; Troiano et al.,
to the pressurisation and heating of the hydrothermal system, 2019), joint geochemical and thermal measurements (e.g.,
which triggers energy transfer from the fluids to the host rocks Tamburello et al., 2019; Chiodini et al., 2021); geodetic
(Chiodini et al., 2021). (e.g., D’Auria et al., 2015), gravity (Young et al., 2020),
Campi Flegrei goes through repeated unrest episodes hydrogeological (e.g., Bruno et al., 2007) magnetotellurics
(Kilburn et al., 2017), releasing carbon dioxide gases and (e.g., Troiano et al., 2014; Siniscalchi et al., 2019); volcano-
high heat flow from the hydrothermal-magmatic system tectonic (Isaia et al., 2015), seismic and tremor surveys
(Chiodini et al., 2007). The caprock has controlled fluid (Saccorotti et al., 2007; Letort et al., 2012; Serra et al.,
migrations since the 1980s (Vanorio and 2016; Bruno et al., 2017; De Landro et al., 2017; Amoroso
Kanitpanyacharoen, 2015; De Siena et al., 2017b; Calò and et al., 2018; Gammaldi et al., 2018; Giudicepietro et al., 2021),
Tramelli, 2018). These fluid migrations to the surface towards and seismic attenuation (De Landro et al., 2019). The first
the east caldera, produce seismic and geochemical responses, kilometre under Solfatara is imaged at very high resolution;
especially at the Solfatara crater (Di Luccio et al., 2015; De however, there is still uncertainty about the structures that
Siena et al., 2017b; Petrosino and De Siena, 2021). This crater guide fluids from the deforming centre of the Solfatara caldera
formed about 4,000 years ago and, historically, is the first to its eastern side, specifically to the degassing Pisciarelli field
place where the volcano shows signs of unrest (Kilburn and (Young et al., 2020). At Solfatara, the absorption of seismic
McGuire, 2001). The Solfatara crater (Figure 1) is a tuff cone energy could be attributed mainly to wave-induced fluid flow,
(graben-like structure) with 600 m in diameter, 100 m above a mechanism known for producing significant attenuation in
sea level. Described as a maar-diatreme structure (Isaia et al., saturated porous rocks (Pride et al., 2004; Tisato and Quintal,
2015), it was created by the interaction of supercritical fluids 2013). Therefore, the spatial variation of scattering and
rising from depth and groundwater, leading to eruptions and absorption can be a marker of both structure and
tephra expulsion. High-angle normal faults and fractured composition of the volcanic medium.
rocks surround the Solfatara crater (Figure 1), guiding Most field imaging with absorption and scattering is in 2D,
fluids from depth to fumaroles and mud pools (Bianco with no available results at the meter scale. This study offers
et al., 2004). The most active fumaroles across the caldera the first example of 3D separation of seismic scattering from
are located at Solfatara and across the Pisciarelli field, 400 m seismic absorption performed using the open-access code
to the northeast. The two fields are likely connected, as Multi-Resolution Attenuation Tomography (MuRAT3D).
inferred by field data, electromagnetic surveys, and gravity The active data from the Repeat Induced Earthquake and
gradiometry (Troiano et al., 2014; Young et al., 2020). The Noise (RICEN, Serra et al., 2016) experiment, performed
increasing geochemical release and seismic activity between inside the Solfatara crater in September 2013, offer the
the Solfatara and Pisciarelli hydrothermal areas raise concerns ideal dataset to image the shallowest hydrothermal system
over phreatic and hydrothermal eruptions (Chiodini et al., at Solfatara at the meter-scale. The results provide novel
2021; Giudicepietro et al., 2021). images that complement the available information,
Solfatara is a key region where the repeated unrest of the improving our insight into the shallow hydrothermal
last 50 years has been monitored, becoming one of the best- structures and revealing fluid pathway geometries around
known, best-monitored, and best-surveyed volcanic craters the main fumaroles.
Frontiers in Earth Science | www.frontiersin.org 3 March 2022 | Volume 10 | Article 852510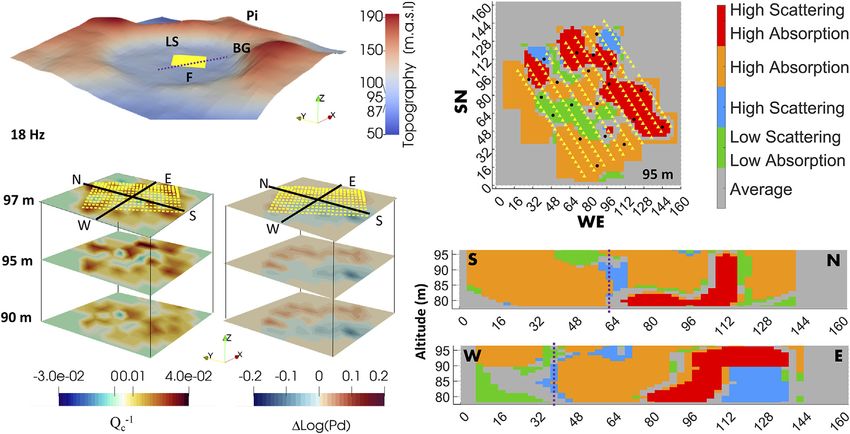
Di Martino et al.                                                                                                  Hydrothermal Fluids Scattering Absorption Imaging

  FIGURE 3 | Peak-delay dependence on travel time at 18 Hz. Coefficients A and B define the linear fitting of the data with 95% confidence (A = 0.7668 ± 0.8338, B =
  0.7941 ± 0.8684). Minimum and Maximum peak delay (0.3 and 5 s respectively) were set to avoid biases on the picking. Given this threshold, the data used for the
  analysis was reduced to 2081 seismograms at 18 Hz (Supplementary Table S2).

DATASET                                                                               centred at 12, 18, 24, and 27 Hz. The coda waves contain
                                                                                      stochastic information at this range of frequencies and are
In this study, we used as input seismograms collected during the                      dominated by highly-scattered surface waves. The envelopes
RICEN experiment (Serra et al., 2016). The network covers 90 ×                        were computed through a smoothed Hilbert transform of the
115 m2 and comprises 240 sensors distributed over 10 lines                            signal using a sliding window of the size of the sampling
(Yellow box in Figure 1). The distance between sensors is                             frequency (Figure 2).
5 m, with lines of 24 sensors distanced 10 m apart. The
experiment was performed using a vibroseis seismic source
from the 100 shot-points triggered; here, we used 20 shots                            METHODS
evenly distributed, the best compromise between adequate
coverage and avoiding redundancy (Supplementary Figure S1                             Peak-Delay Measurements
in Supplemental Material).                                                            We measured peak delay (Pd) as the time lag from the onset of
    The input velocity model is the one obtained by De Landro                         the P-wave arrival to the maximum amplitude of the envelope
et al. (2017) using the full dataset of the RICEN array acquisition                   (green line in Figure 2). In heterogeneous media, the peak
in a 160 × 160 × 30 m3 volume. The signals are sampled at a                           delay should increase linearly with the travel time (Saito et al.,
1,000 Hz frequency rate. The seismograms were already pre-                            2002) and be related to the P-wave travel time (tt) in each
processed (cross-correlation with the vibroseis sweep to obtain                       frequency band f by:
a source-corrected signal and minimum phase filter to preserve
causality; see Serra et al., 2016; De Landro et al., 2017 for details).                                      Pdf  Af + Bfptt                                  (1)
The P-wave arrival times of each seismogram are the ones
estimated by De Landro et al. (2017) and included in the                              where A(f) and B(f) are the coefficients of the linear fit (Pd_L)
header of the waveform files in SAC format. We selected 2,144                          (Figure 3). Peak delay is mapped by measuring the variations of
waveforms with source-station distances longer than 50 m. The                         the logarithm of the Pd measures Log(Pd) relative to a linear
analysis was carried out on the waveforms that complied with a                        trend:
coda to noise ratio higher than 3 (Supplementary Table S2). The                                ΔLogPdf  LogPdf − LogPd Lf                               (2)
P-wave energy is contained in the first 0.126 s from the P-wave
picking and has frequencies above 45 Hz (De Landro et al., 2019).                        The data values above and below the linear trend represent
The start of the coda window was selected at 2 s from the origin                      the variations of the peak delay time, interpreted as high and
time, with a length of 2 s (Figure 2).                                                low scattering (Takahashi et al., 2007). Areas with positive
    We performed a preliminary study of the seismic signal                            variations indicate that the ray path crosses strong
and its spectrum over different windows to choose the                                 heterogeneous zones (i.e., high scattering attenuation),
suitable coda window (Supplementary Figures S2A,B).                                   while negative variations indicate either low scattering or
The choice of the coda windows complies with the                                      strong absorption (Calvet et al., 2013). Peak delays are then
assumption of stochastic waves contained in the coda                                  mapped into space assuming sensitivity to the seismic ray,
section. We bandpass-filtered the seismograms by applying                              computed in the available velocity model (De Landro et al.,
a Butterworth filter of order four in four frequency bands                             2017).

Frontiers in Earth Science | www.frontiersin.org                                  4                                         March 2022 | Volume 10 | Article 852510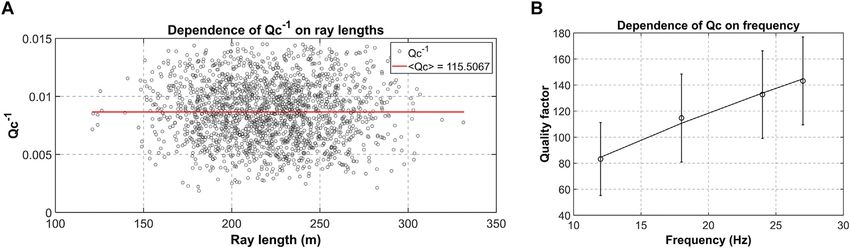
Di Martino et al.                                                                                                  Hydrothermal Fluids Scattering Absorption Imaging

  FIGURE 4 | (A) Coda Attenuation Qc−1 dependency on ray length at 18 Hz (B) Qc values estimated at different frequencies.

Coda Attenuation
The energy decay of the coda as a function of frequency and time
(Aki and Chuoet, 1975) is given by:
                                                   −2πft
                        Ef, t  Sft− ∝ exp      Qc                    (3)

where t is the lapse-time, S(f) is the frequency-dependent source
factor, ∝ is a constant factor related to the geometrical spreading
and Qc is the coda quality factor (inverse of coda attenuation).
The coda decay method estimates Qc−1 values by linearizing this
equation and obtaining a least-square fitting of the logarithm of
the envelope energy at a given frequency versus lapse time (see
Sketsiou et al., 2020 for the uncertainties associated with this
linearization). A minimum correlation coefficient threshold of 0.8
was imposed for this fitting to select high-quality data. This
threshold led to a further reduction of the data used for the
analysis (1895 seismograms at 18 Hz); the cut was higher at lower
frequencies (Supplementary Table S2).
    The analysis is performed using the inversion approach
described by De Siena et al. (2017a). However, this work uses
2D space-weighting functions (Prudencio et al., 2013; Del Pezzo
et al., 2016) with the hypothesis that the entire energy of the coda
window is contained (thus lost) inside the defined grid.
MuRAT3D implements 3D multiple-scattering sensitivity
kernels (Del Pezzo et al., 2018) based on Paasschen’s
equations (Paasschens, 1997) (Supplementary Figure S3). To
determine the input albedo and extinction length parameters, we
followed the approach of Wegler (2003), assuming that the
medium is fully diffusive (Scala et al., 2019). An iterative
inversion (Gazzola et al., 2019) is used to obtain the Qc−1
values at each node. We tested the stability and resolution of
the inversion at different grid node spacing through iterative
regularizations and checkerboard tests (Supplementary Figures                        FIGURE 5 | Workflow of the attenuation tomography methods applied to
S3A–C). The best parametrization model corresponds to 11 ×                           map peak delay (left side) and coda attenuation (right side) for imaging seismic
11 × 7 nodes (grid spacing 16m × 16m × 5m). The anomalies are                        scattering and absorption, respectively.

well reconstructed laterally; however, at depth, it is only possible
to resolve a shallow section (upper ~10m) for the coda.
    Here, we interpret Qc−1 as a marker of seismic absorption,                      Prudencio et al., 2013; Sketsiou et al., 2020). Nonetheless, also
which is a common approach at a regional scale when a diffusive                     at our very local scale, we checked that Qc−1 1) does not vary
regime describes scattering (Calvet and Margerin, 2013;                             consistently with ray length (Calvet and Margerin, 2013) and 2)

Frontiers in Earth Science | www.frontiersin.org                                5                                            March 2022 | Volume 10 | Article 852510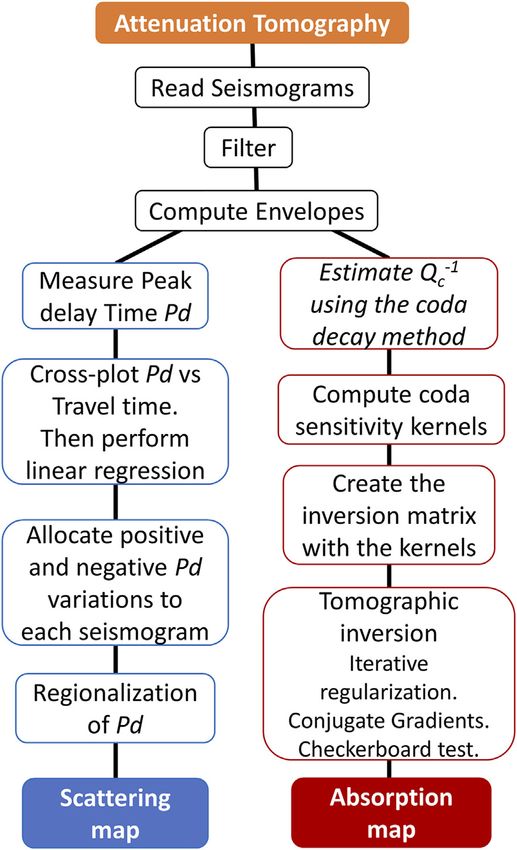
Di Martino et al.                                                                                   Hydrothermal Fluids Scattering Absorption Imaging

that Qc−1 has a linear correlation with frequency (Sketsiou et al.,        each block of the volume. The modelled Qc−1 are adjusted
2020) to validate this condition (Figure 4). The characteristic            to satisfy the observed data by using an iterative regularization
length after which the multiple scattering regime occurs is the            that leads to choosing adequate damping parameters using
scattering mean free path (Scala et al., 2019). The scattering mean        conjugate gradients (Aster et al., 2019; Gazzola et al., 2019).
free path must be larger than the wavelengths, and the source-             The final choice is performed by minimizing a cost function
receiver distance larger than the transport mean free path                 that includes data residuals and L2-norm misfit
(Wegler, 2003). We measured an average scatter mean free                   (Supplementary Figure S3B). 6) We produce a checkboard
path of ~7.5 m in the area in a wide frequency range                       test to assess the accuracy of the inversion (Supplementary
(10–40 Hz), which complies with these assumptions (see                     Figure S3A). These tests consist of alternating patterns of
Supplementary Material S3). Scala et al. (2019) obtained a                 positive and negative anomalies that must be reconstructed,
similar result, estimating a scattering mean free path of ~10 m            so that the areas with good recovery are assumed to be well
at 25 Hz in the Solfatara crater using surface waves. Their                constrained. 7) Finally, we plot the coda attenuation
estimation of attenuation values using mean free path values               variations over the study volume (Figure 7).
assumes a homogeneous development of the coda in which the
averaged elastic properties are independent of the location of
source and receivers. In this study, we included sensitivity kernels       RESULTS
in the inversion of coda attenuation values, which shows that only
the first 10 m are resolved because of the close location of the            Figures 6, 7 show the peak-delay and coda-attenuation variation
events and stations at the surface (Del Pezzo et al., 2018).               maps. The maps occupy the extension of the input velocity model
                                                                           (Figure 1); however, for the peak delay maps, we only interpret
Tomographic Procedures                                                     the patterns in the area covered by the ray crossing, while for the
Scattering attenuation is mapped by the regionalization of the             coda attenuation maps the model resolution is delineated by the
peak delay measurements (see the workflow in Figure 5). The                 results of the checkerboard test. We present the results obtained
underlying principle is that the envelope of direct wave packets           in different frequency bands, as the size of the heterogeneities
broadens due to multiple forward scattering by inhomogeneities             could change based on the wavelengths. For the peak-delay maps,
(Markov approximation, Saito et al., 2002). We adopted the                 we present depth slices every 5 m covering the entire study
tomographic method developed by Takahashi et al. (2007) for                volume, while for the coda attenuation, we show only the first
mapping scattering as follows: 1) measure Pd for all the                   10 m. Below this depth, the resolution of the results was
waveforms filtered at the study frequency bands; 2) cross-plot              inadequate (Supplementary Figure S3A) because:
the Pd values against travel time (Figure 3); 3) perform a linear
regression of the dependence of peak delay increasing with travel          1) The sources are located at the same elevation level of the
time; 4) allocate positive and negative variations of Pd with                 stations (96–98 m), and coda waves mainly reverberate near
respect to the linear trend to identify strong and weak                       source and receiver;
scattering, respectively; 5) map Pd in space using                         2) The first abrupt change in the velocity model, to which coda
regionalization. The regionalization consisted of dividing the                wave attenuation is extremely sensitive (Gabrielli et al., 2020),
mapped volume into blocks, where each block is crossed by                     is around 85 m a.s.l. (De Landro et al., 2017);
several rays, each ray has an allocated Pd value measured from its         3) Having a regular grid spacing smaller than 10 m on the
seismogram, and the average Pd of all these rays is given to the              vertical direction, coda waves do not propagate much at
block. Then the variations between blocks are smoothed by taking              depth, as the wavelengths used are 4–8 times larger than
the average of the mean Pd values between neighbour blocks. 6)                the grid cell.
Finally, we plot in 3D the spatial variations of peak delay
(Figure 6).                                                                   In the coda attenuation maps (Figure 7), the Qc−1 scale
   Absorption is mapped by an inversion procedure of the coda              represents relative changes of coda attenuation resolved in the
attenuation measurements (see the workflow in Figure 5).                    area, not an exact quantification of coda attenuation (for an
The method is as follows: 1) compute the seismic envelopes at              average Qc value in the crater, see Figure 4B). In the inversion, we
each study frequency; 2) compute Qc−1 from the least square                do not impose the condition of positive Qc−1 values, so we also
fitting of the logarithm of the envelope versus time; 3)                    obtain negative values. A description of the physics creating
compute the sensitivity kernels for the event-station                      anomalous negative attenuation in volcanoes at Campi Flegrei
couples (Supplementary Figure S3); 4) create the inversion                 caldera is given by De Siena et al. (2013). These negative
matrix G using the computed kernels; 5) perform the                        anomalies are proven markers of deformation at regional and
tomographic inversion. The linear inversion problem solves                 volcanic scales, marking interfaces inside the Tyrrhenian Sea (e.g.,
the general expression d = G(m); where the data vector d                   Nardoni et al., 2021) and Pollino fault network (Napolitano et al.,
contains the Qc values measured for each seismogram, while                 2020) and dike intrusions/fluid injections at Campi Flegrei (De
the operator matrix G, which represents the mathematical                   Siena et al., 2017a). Such interfaces produce reverberations that
relation between the observed and the modelled Qc−1,                       contrast the diffusion approximation at specific frequencies, thus
corresponds to the normalized sensitivity kernels. The                     lowering coda attenuation. These reverberations can be related to
model vector m contains the attenuation values Qc−1 for                    the relative positions of source and interfaces. This has been

Frontiers in Earth Science | www.frontiersin.org                       6                                     March 2022 | Volume 10 | Article 852510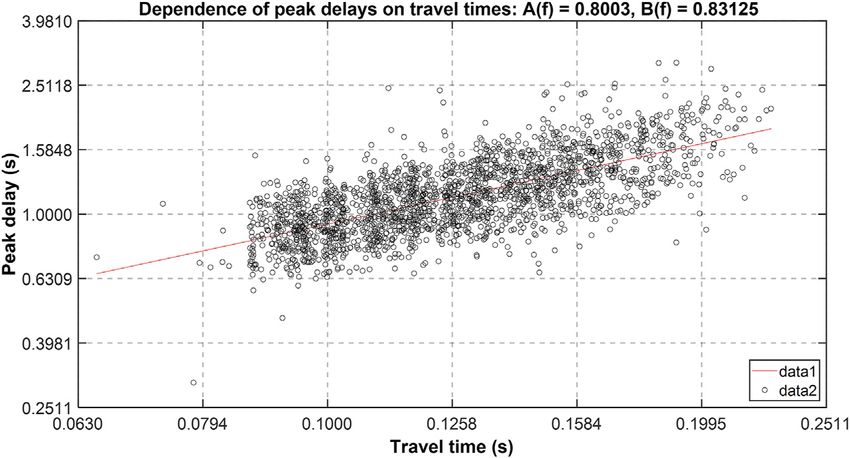
Di Martino et al.                                                                                                    Hydrothermal Fluids Scattering Absorption Imaging

  FIGURE 6 | Peak delay variations at different frequencies. The white dashed polygon represents the resolution limits of the retrieved models based on the ray
  crossing.

proven via joint radiative transfer and eikonal equation modelling                     that lower the inverted Qc−1 depending on the source location. At
by Nardoni et al. (2021), who demonstrated that the presence of                        our scale, these could indicate lateral structural variations that
interfaces, like the Moho, in the medium creates reverberations                        could coincide with fluid-migration pathways.

Frontiers in Earth Science | www.frontiersin.org                                   7                                          March 2022 | Volume 10 | Article 852510
Di Martino et al.                                                                                                 Hydrothermal Fluids Scattering Absorption Imaging

  FIGURE 7 | Coda attenuation variations at different frequencies. The white and black dashed polygon represents the resolved and survey area (Figure 1),
  respectively. We scaled the colour legend to the maximum and minimum for each frequency. The labels are described in the main text.

   The absorption models reveal geometries different from those                          The peak-delay maps (Figure 6) indicate the primary
observed in the peak delay map, an indication that coda                              structural change in the zone. The change marks sharply the
attenuation and peak delay define different attenuation                               NW-SE-striking fault proposed by Bruno et al. (2007) in the
mechanisms and have different sensitivities. We merged and                           middle of the crater, which appears as a resistive body in both
classified the absorption information from Qc−1 and the                               electrical and magnetotelluric profiles. This buried fault (Isaia
scattering information from peak delay in a parameter                                et al., 2015) is sealed by a mineralized clay-rich caprock with gaps
separation map (Figure 8) to discriminate fluid paths from                            at the surface due to the presence of the fault/fracture systems
fracture networks (De Siena et al., 2016; Napolitano et al.,                         (Siniscalchi et al., 2019). Gammaldi et al. (2018) interpreted a
2020). This map is divided into four quadrants: 1) Low                               fault of similar direction using 2D P-wave velocity images
Scattering/Low Absorption LS/LA, 2) High Scattering HS, 3)                           crossing the middle of the crater. They considered it the
High Absorption HA, 4) High Scattering/High Absorption                               preferential gas migration path between the deeper
HS/HA, equivalent to the possible solutions of the                                   hydrothermal source and the main fumaroles. The rocks are
attenuation model.                                                                   highly fractured in the eastern portion of the map (Isaia et al.,
                                                                                     2015); here, the high scattering anomaly coincides with the area of
                                                                                     most intense geothermal activity at Solfatara, that is also the one
DISCUSSION                                                                           with the highest fumarole concentration. Young et al. (2020)
                                                                                     delineated a low-gravity anomaly to the East of the crater (caused
Layers of tuff deposits with similar rock properties but different                   by the accumulation of two-phase fluid within highly-fractured
fluid contents characterize the shallow Solfatara crater (table 1 in                  and porous host rocks), and a moderate low gravity anomaly to
Petrosino et al., 2012). Thus, we assume that the changes observed                   the West that delimitates the Fangaia and is characterized by high
in the absorption and scattering maps (Figures 6–8) are not                          CO2 fluxes. The survey area in this study is located between these
affected by the lithology but are due to the fluid composition,                       two gravity anomalies. A preferential, active path for fluids is
temperature, and the alteration of the host rock caused by                           located along the SE and NE of the crater structure (described by
hydrothermal fluid and meteoric water infiltration. This rock                          Bruno et al., 2007 after Del Castillo et al., 1968). Apart from the
alteration causes the lack of vegetation in the centre of the crater,                prevalent NW-SE fault, the features in the maps follow a cross-
where the survey took place (Figure 1). To the West of our study                     cutting SW-NE trend, as inferred also by the very similar VP
volume, there is the Fangaia mud pool. At depth, this zone is                        anomalies distribution retrieved in the depth range 15–27 m by
characterized by a conductive hydrothermal plume with meteoric                       De Landro et al. (2017). These anomalies are thus directed toward
water upwelling to the surface (Bruno et al., 2007), while towards                   the Pisciarelli field (Isaia et al., 2015) in a way that is consistent
the East there is a higher-resistivity zone attributed to the high                   with the existence of a migration pathway connecting the two
CO2 saturation close to the fumaroles (
Di Martino et al. Hydrothermal Fluids Scattering Absorption Imaging
FIGURE 8 | Left: The topography image indicates the location of the survey area (yellow rectangle), the main fumaroles, and the interpreted NW-SE fault from our
results (dashed purple line). Absorption and scattering sections across the first 10 m are stacked below the topography, showing the trace of two vertical sections (SN
and WE). Right: Parameter maps obtained at 18 Hz by separating the mapped values in their parameter space (the location of the stations and sources is indicated by the
yellow triangles and the black circles, respectively).
Our Qc−1 model is satisfactorily resolved up to ~87 m a.s.l. this is NE, pointing to the LS fumarole (Figure 1): this anomaly
around ~10 m below the surface (Figure 7). Laterally, the structure could indicate a connection between the mud pool and the
looks heterogenous, a product of the intense fluid saturation of the fumaroles. These mud pools, found at both F and LS
pore space in the area, especially at low frequencies (12 Hz). Letort (Figure 8) are a combination of CO2 and steam bubbling
et al. (2012) suggested that seismic noise sources at Solfatara are through hot water (Gresse et al., 2017). We interpret the low
related to the presence of CO2 (and steam) bubbles and the Qc−1 anomaly “d” that appears at 24 and 27 Hz frequencies as the
propagation of these bubbles into the liquid layer. Saturated rocks subsurface transition between the hot water/liquid-rich fluid
strongly attenuate seismic energy when gas bubbles occupy part of coming from the Fangaia pool and the CO2/vapour-rich fluid
the pore space (Tisato et al., 2015). In the highly-fractured and from the plume below BG/BN fumaroles. This encounter point
highly-porous rocks (up to 60%—Mayer et al., 2016) in Solfatara, the intensifies at depth, and it is most evident 90 m. a.s.l. It appears to
measured seismic absorption is likely related to these steam-to-liquid be the SW portion of the area where hydrothermal circulation
phase changes, taking place close to the surface (Chiodini, 2005). At takes place (Bruno et al., 2007).
95 m, the coda attenuation maps show random features (Figure 7), The area of the survey is characterized by 1) a high-absorption
likely due to the coexistence of downward flow of liquid water and area and 2) a well-localized high-scattering and high-absorption
upward flow of gas near the surface (Siniscalchi et al., 2019). area, while 3) there is no clear high-scattering zone, primarily a
In Figure 7, the primary high Qc−1 anomalies (labelled “a”) marker of sealing formations, like clays (Napolitano et al., 2020). The
correlate with the high soil temperature and high CO2 flux in the clay cap expected in this zone (Siniscalchi et al., 2019) is likely below
diffuse degassing area, as identified in the central part of the crater our depth of penetration, as the fault/fracture system breaks it near
by Gresse et al. (2017). Interpretation of the low Qc−1 anomalies is the surface. These results suggest that the principal attenuation
more intriguing. They appear in the NW (“b”) and coincide with mechanism across the shallow hydrothermal is the fluid flow
the low-frequency high-velocity body that Serra et al. (2016) interaction on the highly porous and fractured rocks. In
derived from phase-velocity maps. Similar anomalies appear in Figure 8, high absorption (in orange) increases towards the mud
correlation with the location of dike intrusions/fluid injections in pools area, where the degassing is less intense. Here (i.e., the southern
the centre of the caldera, using data recorded during its major region of this model), we imaged strong variations of ΔLog(Pd) and
unrest (1983–1984—De Siena et al., 2017b). At 18 Hz, the narrow Qc−1, especially at high frequencies. This observation is fully
low Qc−1 anomaly (“c”) is thus inferred as the most likely location consistent with attenuation images by De Landro et al. (2019):
where the fluid flow from the NW-SE fault/fracture system, they retrieved the lowest QP values in the investigated volume
observed in the peak delay map, reaches the near-surface. (i.e., the strongest attenuation) in this area, adjacent to the
Increasing frequencies and at the shallowest depth (95 m. eastern part of the Fangaia mud-pool, where mineralized liquids
a.s.l), the low-Qc−1 anomalies (“arrows”) go from S towards saturate the shallow subsoil. The high-scattering/high-absorption
Frontiers in Earth Science | www.frontiersin.org 9 March 2022 | Volume 10 | Article 852510Di Martino et al. Hydrothermal Fluids Scattering Absorption Imaging
zone (in red) appears below the main vents, where the degassing attenuation mechanisms (i.e., scattering from absorption)
occurs. demonstrated the high potential to detect fluid upflow and
In dry volcanic samples, the level of heterogeneity observed in identify different fluid compositions. Our results offer a highly-
coda waves produced by changes in pore space topology is already resolved picture of the pathways taken by hazardous fluids to rise to
quite complex (Di Martino et al., 2021). At Solfatara, the host rocks surface and migrate east, from Solfatara towards the metropolitan
are highly altered by intense hydrothermal alteration that increases city of Naples. This approach can improve modelling of very-shallow
porosity and permeability and reduces elastic wave velocity (Mayer hydrothermal systems, especially if combined with different
et al., 2016), intensifying the attenuation responses. Once combined geophysical responses and interpreted using rock-physics
with evidence from rock physics, our maps could offer observations.
complementary information to retrieve fluid composition and
saturation levels (e.g., Amoroso et al., 2017) at scales that bridge
field seismology and rock observations. DATA AVAILABILITY STATEMENT
The Solfatara crater has a unique significance, as it is where unrest
episodes at Campi Flegrei have historically been monitored (Kilburn The version of the program MuRAT used to compute the analysis
and McGuire, 2001). While vents continuously degas at its centre, and the results presented here are available for download at https://
the Pisciarelli fumarolic-hydrothermal area increased in 2009 on the github.com/PilarDiMartino/MuRAT_Solfatara (https://doi.org/10.
outer eastern flank of the crater (Figure 1). Today, this is the most 5281/zenodo.5831367). The Solfatara catalogue is available on
hazardous sector of the caldera, characterized by an active request.
hydrothermal system often producing phreatic and small
hydrothermal explosions (Isaia et al., 2021), and where fluids are
progressively migrating east producing earthquakes (Petrosino and AUTHOR CONTRIBUTIONS
De Siena, 2021).
While the severity of a larger eruption is usually linked to a GD and VS performed preliminary analyses on the dataset,
magmatic ejection, in this paper the mapped features are only correcting for source functions, analysing data in frequency,
produced by fluid flow interactions. From our study, it is and providing the seismic rays in the velocity model. MDM
impossible to determine if they are related to a magmatic selected and analysed waveform data for the analysis, applied the
source degassing at depth. Regardless, the scattering mapping MuRAT code, created all images and wrote the first draft of the
of the hydrothermal system shows how a highly dipping fault is paper. LDS enabled a fast implementation of the MuRAT code on
the primary contributor to fluid migration from depth (Figure 6). the dataset, tested and commented results, and extended the first
As previously highlighted by gravity gradiometry (Young et al., draft, including a more comprehensive volcanological discussion.
2020), the fluid migrations feeding Pisciarelly are shallow The manuscript went through two successive reviews from all
(Figure 8) and start from the primary Solfatara feeder authors, which commented on methods and interpretation.
(Siniscalchi et al., 2019). Absorption marks the shallow
pathways followed by these fluids, which migrate east towards
Pisciarelli within the first few meters of the volcano (Figure 7). FUNDING
These traces likely extend further east, representing the most
impending hazard for people leaving near the Solfatara crater. JGU provided funding for open-access publication fees, following
the agreement with the Frontiers journal. MDM acknowledges the
support of the Mainz Institute of Multiscale Modeling, which funded
CONCLUSION her research visit and training at the Johannes Gutenberg University
of Mainz. The contribution of GD and VS was supported by the
We present scattering and absorption 3D models and an interpreted PRIN-FLUIDS project: “Detection and tracking of crustal fluid by
separation map of these attenuation parameters for the shallow multi-parametric methodologies and technologies” of the Italian
hydrothermal system at Solfatara crater, inside Campi Flegrei PRIN-MIUR programme (grant no. 20174X3P29).
caldera. The model delineates the NW-SE fault that separates
fluids flowing through the mud pool (W) and vapor-filled
structures near fumaroles (NE and SW). The lateral variations of ACKNOWLEDGMENTS
absorption and scattering provide the first seismic evidence of fluid-
migration pathways, previously inferred by field and gravity surveys. The analysis was performed using the MuRAT code available at
These fluids are generated under Fangaia and eventually reach the https://github.com/LucaDeSiena/MuRAT.git.
Pisciarelli fumaroles, outside the crater.
This work is the first application of 3D scattering and absorption
imaging to a shallow hydrothermal system, providing models at SUPPLEMENTARY MATERIAL
meter-scale resolutions. The results depend on the complexity of the
crater structure and support previous inferences about how these The Supplementary Material for this article can be found online at:
features constrain fluid migrations. On the other hand, within a https://www.frontiersin.org/articles/10.3389/feart.2022.852510/
relatively-homogeneous geological matrix, separating the full#supplementary-material
Frontiers in Earth Science | www.frontiersin.org 10 March 2022 | Volume 10 | Article 852510Di Martino et al. Hydrothermal Fluids Scattering Absorption Imaging
REFERENCES De Landro, G., Serlenga, V., Russo, G., Amoroso, O., Festa, G., Bruno, P. P., et al.
(2017). 3D Ultra-high Resolution Seismic Imaging of Shallow Solfatara Crater
in Campi Flegrei (Italy): New Insights on Deep Hydrothermal Fluid Circulation
Akande, W. G., Gan, Q., Cornwell, D. G., and De Siena, L. (2021). Thermo-Hydro- Processes. Sci. Rep. 7 (1), 3412. doi:10.1038/s41598-017-03604-0
Mechanical Model and Caprock Deformation Explain the Onset of an Ongoing De Siena, L., Amoruso, A., Pezzo, E. D., Wakeford, Z., Castellano, M., and
Seismo-Volcanic Unrest. J. Geophys. Res. Solid Earth 126 (3). doi:10.1029/ Crescentini, L. (2017a). Space-weighted Seismic Attenuation Mapping of the
2020jb020449 Aseismic Source of Campi Flegrei 1983–1984 Unrest. Geoph. Res. Lett. 44, 1740–1748.
Aki, K., and Chouet, B. (1975). Origin of Coda Waves: Source, Attenuation, and De Siena, L., Calvet, M., Watson, K. J., Jonkers, A. R. T., and Thomas, C. (2016).
Scattering Effects. J. Geophys. Res. 80 (23), 3322–3342. doi:10.1029/jb080i023p03322 Seismic Scattering and Absorption Mapping of Debris Flows, Feeding Paths,
Amoroso, O., Festa, G., Bruno, P. P., D’Auria, L., De Landro, G., Di Fiore, V., et al. and Tectonic Units at Mount St. Helens Volcano. Earth Planet. Sci. Lett. 442,
(2018). Integrated Tomographic Methods for Seismic Imaging and Monitoring 21–31. doi:10.1016/j.epsl.2016.02.026
of Volcanic Caldera Structures and Geothermal Areas. J. Appl. Geophys. 156, De Siena, L., Chiodini, G., Vilardo, G., Del Pezzo, E., Castellano, M., Colombelli, S.,
16–30. doi:10.1016/j.jappgeo.2017.11.012 et al. (2017b). Source and Dynamics of a Volcanic Caldera Unrest: Campi
Amoroso, O., Russo, G., De Landro, G., Zollo, A., Garambois, S., Mazzoli, S., et al. Flegrei, 1983-84. Sci. Rep. 7 (1), 8099. doi:10.1038/s41598-017-08192-7
(2017). From Velocity and Attenuation Tomography to Rock Physical Modeling: De Siena, L., Del Pezzo, E., Thomas, C., Curtis, A., and Margerin, L. (2013). Seismic
Inferences on Fluid-Driven Earthquake Processes at the Irpinia Fault System in Energy Envelopes in Volcanic media: In Need of Boundary Conditions.
Southern Italy. Geophys. Res. Lett. 44 (13), 6752–6760. doi:10.1002/2016gl072346 Geophys. J. Int. 195 (2), 1102–1119. doi:10.1093/gji/ggt273
Aster, R. C., Borchers, B., and Thurber, C. H. (2019). “Iterative Methods,” in Del Pezzo, E., De La Torre, A., Bianco, F., Ibanez, J., Gabrielli, S., and De Siena, L.
Parameter Estimation and Inverse Problems. 1st ed (N: ElsevierCRC Press), (2018). Numerically Calculated 3D Space-Weighting Functions to Image
151–179. doi:10.1016/B978-0-12-804651-7.00011-0 Crustal Volcanic Structures Using Diffuse Coda Waves. Geosciences 8 (5),
Barton, N (2006). Rock Quality, Seismic Velocity, Attenuation and Anisotropy. 175. doi:10.3390/geosciences8050175
Availbleat: https://doi-org.dbgw.lis.curtin.edu.au/10.1201/9780203964453. Del Pezzo, E., Ibañez, J., Prudencio, J., Bianco, F., and De Siena, L. (2016).
Bianco, F., Del Pezzo, E., Saccorotti, G., and Ventura, G. (2004). The Role of Absorption and Scattering 2-D Volcano Images from Numerically Calculated
Hydrothermal Fluids in Triggering the July–August 2000 Seismic Swarm at Campi Space-Weighting Functions. Geophys. J. Int. 206 (2), 742–756. doi:10.1093/gji/ggw171
Flegrei, Italy: Evidence from Seismological and Mesostructural Data. J. Volcano. Di Luccio, F., Pino, N. A., Piscini, A., and Ventura, G. (2015). Significance of the
Geotherm. Res. 133 (1–4), 229–246. doi:10.1016/s0377-0273(03)00400-1 1982-2014 Campi Flegrei Seismicity: Preexisting Structures, Hydrothermal
Bruno, P. P. G., Maraio, S., and Festa, G. (2017). The Shallow Structure of Solfatara Processes, and hazard Assessment. Geophys. Res. Lett. 42 (18), 7498–7506.
Volcano, Italy, Revealed by Dense, Wide-Aperture Seismic Profiling. Sci. Rep. 7 doi:10.1002/2015gl064962
(1), 17386. doi:10.1038/s41598-017-17589-3 Di Martino, M. D. P., De Siena, L., Healy, D., and Vialle, S. (2021). Petro-
Bruno, P. P. G., Ricciardi, G. P., Petrillo, Z., Di Fiore, V., Troiano, A., and Chiodini, mineralogical Controls on Coda Attenuation in Volcanic Rock Samples.
G. (2007). Geophysical and Hydrogeological Experiments from a Shallow Geophys. J. Int. 226 (3), 1858–1872. doi:10.1093/gji/ggab198
Hydrothermal System at Solfatara Volcano, Campi Flegrei, Italy: Response Gabrielli, S., De Siena, L., Napolitano, F., and Del Pezzo, E. (2020). Understanding
to Caldera Unrest. J. Geophys. Res. 112 (B6), B06201. doi:10.1029/2006jb004383 Seismic Path Biases and Magmatic Activity at Mount St Helens Volcano before
Byrdina, S., Vandemeulebrouck, J., Cardellini, C., Legaz, A., Camerlynck, C., its 2004 Eruption. Geophys. J. Int. 222 (1), 169–188. doi:10.1093/gji/ggaa154
Chiodini, G., et al. (2014). Relations between Electrical Resistivity, Carbon Gammaldi, S., Amoroso, O., D’Auria, L., and Zollo, A. (2018). High Resolution,
Dioxide Flux, and Self-Potential in the Shallow Hydrothermal System of multi-2D Seismic Imaging of Solfatara Crater (Campi Flegrei Caldera, Southern
Solfatara (Phlegrean Fields, Italy). J. Volcanology Geothermal Res. 283, Italy) from Active Seismic Data. J. Volcanology Geothermal Res. 357, 177–185.
172–182. doi:10.1016/j.jvolgeores.2014.07.010 doi:10.1016/j.jvolgeores.2018.03.025
Calò, M., and Tramelli, A. (2018). Anatomy of the Campi Flegrei Caldera Using Gazzola, S., Hansen, P. C., and Nagy, J. G. (2019). IR Tools: a MATLAB Package of
Enhanced Seismic Tomography Models. Sci. Rep. 8 (1), 16254–16312. doi:10. Iterative Regularization Methods and Large-Scale Test Problems. Numer. Algor
1038/s41598-018-34456-x 81, 773–811. doi:10.1007/s11075-018-0570-7
Calvet, M., and Margerin, L. (2013). Lapse-Time Dependence of Coda Q: Giudicepietro, F., Chiodini, G., Avino, R., Brandi, G., Caliro, S., De Cesare, W., et al.
Anisotropic Multiple-Scattering Models and Application to the Pyrenees. (2021). Tracking Episodes of Seismicity and Gas Transport in Campi Flegrei
Bull. Seismological Soc. America 103 (3), 1993–2010. doi:10.1785/0120120239 Caldera through Seismic, Geophysical, and Geochemical Measurements.
Calvet, M., Sylvander, M., Margerin, L., and Villaseñor, A. (2013). Spatial Seismol. Res. Lett. 92 (2A), 965–975. doi:10.1785/0220200223
Variations of Seismic Attenuation and Heterogeneity in the Pyrenees: Coda Q and Gresse, M., Vandemeulebrouck, J., Byrdina, S., Chiodini, G., Revil, A., Johnson, T.
Peak Delay Time Analysis. Tectonophysics 608, 428–439. doi:10.1016/j.tecto.2013. C., et al. (2017). Three-Dimensional Electrical Resistivity Tomography of the
08.045 Solfatara Crater (Italy): Implication for the Multiphase Flow Structure of the
Chiodini, G., Caliro, S., Avino, R., Bini, G., Giudicepietro, F., De Cesare, W., et al. Shallow Hydrothermal System. J. Geophys. Res. Solid Earth 122 (11),
(2021). Hydrothermal Pressure-Temperature Control on CO2 Emissions and 8749–8768. doi:10.1002/2017jb014389
Seismicity at Campi Flegrei (Italy). J. Volcanology Geothermal Res. 414, 107245. Ibáñez, J. M., Castro-Melgar, I., Cocina, O., Zuccarello, L., Branca, S., Del Pezzo, E.,
doi:10.1016/j.jvolgeores.2021.107245 et al. (2020). First 2-D Intrinsic and Scattering Attenuation Images of Mt Etna
Chiodini, G. (2005). Carbon Dioxide Diffuse Degassing and Estimation of Heat Volcano and Surrounding Region from Active Seismic Data. Geophys. J. Int. 220
Release from Volcanic and Hydrothermal Systems. J. Geophys. Res. 110 (B8), (1), 267–277. doi:10.1093/gji/ggz450
B08204. doi:10.1029/2004jb003542 Isaia, R., Di Giuseppe, M. G., Natale, J., Tramparulo, F. D. A., Troiano, A., and
Chiodini, G., Selva, J., Del Pezzo, E., Marsan, D., De Siena, L., D’Auria, L., et al. Vitale, S. (2021). Volcano-tectonic Setting of the Pisciarelli Fumarole Field,
(2017). Clues on the Origin of post-2000 Earthquakes at Campi Flegrei Caldera Campi Flegrei Caldera, Southern Italy: Insights into Fluid Circulation Patterns
(Italy). Sci. Rep. 7 (1), 4472. doi:10.1038/s41598-017-04845-9 and hazard Scenarios. Tectonics 40, e2020TC006227. doi:10.1029/2020tc006227
Cusano, P., Petrosino, S., and Saccorotti, G. (2008). Hydrothermal Origin for Isaia, R., Vitale, S., Di Giuseppe, M. G., Iannuzzi, E., D’Assisi Tramparulo, F., and
Sustained Long-Period (LP) Activity at Campi Flegrei Volcanic Complex, Italy. Troiano, A. (2015). Stratigraphy, Structure, and Volcano-Tectonic Evolution of
J. Volcanology Geothermal Res. 177 (4), 1035–1044. doi:10.1016/j.jvolgeores.2008.07.019 Solfatara Maar-Diatreme (Campi Flegrei, Italy). Geol. Soc. America Bull. 127
D’Auria, L., Massa, B., Cristiano, E., Del Gaudio, C., Giudicepietro, F., Ricciardi, G., (9–10), 1485–1504. doi:10.1130/b31183.1
et al. (2015). Retrieving the Stress Field within the Campi Flegrei Caldera Kilburn, C. R., and McGuire, B. (2001). Italian Volcanoes (No. 1). Harpenden,
(Southern Italy) through an Integrated Geodetical and Seismological Approach. England: Terra Publishing.
Pure Appl. Geophys. 172 (11), 3247–3263. doi:10.1007/s00024-014-1004-7 Letort, J., Roux, P., Vandemeulebrouck, J., Coutant, O., Cros, E., Wathelet, M., et al.
De Landro, G., Serlenga, V., Amoroso, O., Russo, G., Festa, G., and Zollo, A. (2019). (2012). High-resolution Shallow Seismic Tomography of a Hydrothermal Area:
High Resolution Attenuation Images from Active Seismic Data: The Case Study of Application to the Solfatara, Pozzuoli. Geophys. J. Int. 189 (3), 1725–1733.
Solfatara Volcano (Southern Italy). Front. Earth Sci. 7, 295. doi:10.3389/feart.2019.00295 doi:10.1111/j.1365-246x.2012.05451.x
Frontiers in Earth Science | www.frontiersin.org 11 March 2022 | Volume 10 | Article 852510Di Martino et al. Hydrothermal Fluids Scattering Absorption Imaging
Mayer, K., Scheu, B., Montanaro, C., Yilmaz, T. I., Isaia, R., Aßbichler, D., et al. Siniscalchi, A., Tripaldi, S., Romano, G., Chiodini, G., Improta, L., Petrillo, Z., et al.
(2016). Hydrothermal Alteration of Surficial Rocks at Solfatara (Campi Flegrei): (2019). Reservoir Structure and Hydraulic Properties of the Campi Flegrei Geothermal
Petrophysical Properties and Implications for Phreatic Eruption Processes. System Inferred by Audiomagnetotelluric, Geochemical, and Seismicity Study.
J. Volcanology Geothermal Res. 320, 128–143. doi:10.1016/j.jvolgeores.2016. J. Geophys. Res. Solid Earth 124 (6), 5336–5356. doi:10.1029/2018jb016514
04.020 Sketsiou, P., Napolitano, F., Zenonos, A., and De Siena, L. (2020). New Insights into
Moretti, R., Troise, C., Sarno, F., and De Natale, G. (2018). Caldera Unrest Driven Seismic Absorption Imaging. Phys. Earth Planet. Interiors 298, 106337. doi:10.
by CO2-induced Drying of the Deep Hydrothermal System. Sci. Rep. 8 (1), 1016/j.pepi.2019.106337
8309. doi:10.1038/s41598-018-26610-2 Takahashi, T., Sato, H., Nishimura, T., and Obara, K. (2007). Strong
Napolitano, F., De Siena, L., Gervasi, A., Guerra, I., Scarpa, R., and La Rocca, M. Inhomogeneity beneath Quaternary Volcanoes Revealed from the Peak
(2020). Scattering and Absorption Imaging of a Highly Fractured Fluid-Filled Delay Analysis ofS-Wave Seismograms of Microearthquakes in Northeastern
Seismogenetic Volume in a Region of Slow Deformation. Geosci. Front. 11 (3), Japan. Geophys. J. Int. 168 (1), 90–99. doi:10.1111/j.1365-246x.2006.03197.x
989–998. doi:10.1016/j.gsf.2019.09.014 Tamburello, G., Caliro, S., Chiodini, G., De Martino, P., Avino, R., Minopoli, C.,
Nardoni, C., De Siena, L., Cammarano, F., Magrini, F., and Mattei, E. (2021). et al. (2019). Escalating CO2 Degassing at the Pisciarelli Fumarolic System, and
Modelling Regional-Scale Attenuation across Italy and the Tyrrhenian Sea. Implications for the Ongoing Campi Flegrei Unrest. J. Volcanology Geothermal
Phys. Earth Planet. Interiors 318, 106764. doi:10.1016/j.pepi.2021.106764 Res. 384, 151–157. doi:10.1016/j.jvolgeores.2019.07.005
Paasschens, J. C. J. (1997). Solution of the Time-dependent Boltzmann Equation. Tisato, N., Quintal, B., Chapman, S., Podladchikov, Y., and Burg, J. P. (2015).
Phys. Rev. E 56, 1135–1141. doi:10.1103/physreve.56.1135 Bubbles Attenuate Elastic Waves at Seismic Frequencies: First Experimental
Petrillo, Z., D’Auria, L., Mangiacapra, A., Chiodini, G., Caliro, S., and Evidence. Geophys. Res. Lett. 42 (10), 3880–3887. doi:10.1002/2015gl063538
Scippacercola, S. (2019). A Perturbative Approach for Modeling Short-Term Tisato, N., and Quintal, B. (2013). Measurements of Seismic Attenuation and Transient
Fluid-Driven Ground Deformation Episodes on Volcanoes: A Case Study in the Fluid Pressure in Partially Saturated Berea sandstone: Evidence of Fluid Flow on the
Campi Flegrei Caldera (Italy). J. Geophys. Res. Solid Earth 124, 1036–1056. Mesoscopic Scale. Geophys. J. Int. 195 (1), 342–351. doi:10.1093/gji/ggt259
doi:10.1029/2018jb015844 Troiano, A., Di Giuseppe, M. G., Patella, D., Troise, C., and De Natale, G. (2014).
Petrosino, S., Cusano, P., and Madonia, P. (2018). Tidal and Hydrological Electromagnetic Outline of the Solfatara-Pisciarelli Hydrothermal System,
Periodicities of Seismicity Reveal New Risk Scenarios at Campi Flegrei Campi Flegrei (Southern Italy). J. Volcanology Geothermal Res. 277, 9–21.
Caldera. Sci. Rep. 8 (1), 13808–13812. doi:10.1038/s41598-018-31760-4 doi:10.1016/j.jvolgeores.2014.03.005
Petrosino, S., Damiano, N., Cusano, P., Di Vito, M. A., de Vita, S., and Del Pezzo, E. Troiano, A., Isaia, R., Di Giuseppe, M. G., Tramparulo, F. D. A., and Vitale, S.
(2012). Subsurface Structure of the Solfatara Volcano (Campi Flegrei Caldera, (2019). Deep Electrical Resistivity Tomography for a 3D Picture of the Most Active
Italy) as Deduced from Joint Seismic-Noise Array, Volcanological and Sector of Campi Flegrei Caldera. Sci. Rep. 9, 15124. doi:10.1038/s41598-019-51568-0
Morphostructural Analysis: Subsurface Structure of Solfatara. Geochem. Troise, C., De Natale, G., and Kilburn, C. R. J. (2006). Mechanisms of Activity and
Geophys. Geosyst. 13 (7). doi:10.1029/2011gc004030 Unrest at Large Calderas. London: Geological Society.
Petrosino, S., and De Siena, L. (2021). Fluid Migrations and Volcanic Earthquakes Troise, C., De Natale, G., Schiavone, R., Somma, R., and Moretti, R. (2019). The
from Depolarized Ambient Noise. Nat. Commun. 12 (1), 6656. doi:10.1038/ Campi Flegrei Caldera Unrest: Discriminating Magma Intrusions from
s41467-021-26954-w Hydrothermal Effects and Implications for Possible Evolution. Earth-Science
Pride, S. R., Berryman, J. G., and Harris, J. M. (2004). Seismic Attenuation Due to Rev. 188, 108–122. doi:10.1016/j.earscirev.2018.11.007
Wave-Induced Flow. J. Geophys. Res. 109, B01201. doi:10.1029/2003JB002639 Vanorio, T., and Kanitpanyacharoen, W. (2015). Rock Physics of Fibrous Rocks
Prudencio, J., Del Pezzo, E., Garcia-Yeguas, A., and Ibanez, J. M. (2013). Spatial Akin to Roman concrete Explains Uplifts at Campi Flegrei Caldera. Science 349
Distribution of Intrinsic and Scattering Seismic Attenuation in Active Volcanic (6248), 617–621. doi:10.1126/science.aab1292
Islands - I: Model and the Case of Tenerife Island. Geophys. J. Int. 195 (3), Vanorio, T., Prasad, M., Patella, D., and Nur, A. (2002). Ultrasonic Velocity
1942–1956. doi:10.1093/gji/ggt361 Measurements in Volcanic Rocks: Correlation with Microtexture. Geophys.
Ricco, C., Petrosino, S., Aquino, I., Del Gaudio, C., and Falanga, M. (2019). Some J. Int. 149 (1), 22–36. doi:10.1046/j.0956-540x.2001.01580.x
Investigations on a Possible Relationship between Ground Deformation and Vanorio, T., Virieux, J., Capuano, P., and Russo, G. (2005). Three-dimensional
Seismic Activity at Campi Flegrei and Ischia Volcanic Areas (Southern Italy). Seismic Tomography fromPwave andSwave Microearthquake Travel Times
Geosciences 9 (5), 222. doi:10.3390/geosciences9050222 and Rock Physics Characterization of the Campi Flegrei Caldera. J. Geophys.
Rosas-Carbajal, M., Komorowski, J.-C., Nicollin, F., and Gibert, D. (2016). Volcano Res. 110 (B3), B03201. doi:10.1029/2004jb003102
Electrical Tomography Unveils Edifice Collapse hazard Linked to Wegler, U. (2003). Analysis of Multiple Scattering at Vesuvius Volcano, Italy,
Hydrothermal System Structure and Dynamics. Sci. Rep. 6 (1), 29899. Using Data of the TomoVes Active Seismic experiment. J. Volcano. Geotherm.
doi:10.1038/srep29899 Res. 128 (1–3), 45–63. doi:10.1016/s0377-0273(03)00246-4
Saccorotti, G., Petrosino, S., Bianco, F., Castellano, M., Galluzzo, D., La Rocca, M., Young, N., Isaia, R., and Gottsmann, J. (2020). Gravimetric Constraints on the
et al. (2007). Seismicity Associated with the 2004–2006 Renewed Ground Uplift Hydrothermal System of the Campi Flegrei Caldera. J. Geophys. Res. Solid Earth
at Campi Flegrei Caldera, Italy. Phys. Earth Planet. Interiors 165 (1–2), 14–24. 125 (7). doi:10.1029/2019jb019231
doi:10.1016/j.pepi.2007.07.006
Saito, T., Sato, H., and Ohtake, M. (2002). Envelope Broadening of Spherically Conflict of Interest: The authors declare that the research was conducted in the
Outgoing Waves in Three Dimensional Random media Having Power Law absence of any commercial or financial relationships that could be construed as a
Spectra. J. Geophys. Res. 107. doi:10.1029/2001jb000264 potential conflict of interest.
Sato, H., Fehler, M. C., and Maeda, T. (2012). Seismic Wave Propagation and
Scattering in the Heterogeneous Earth. Second Edition. Springer Berlin Publisher’s Note: All claims expressed in this article are solely those of the authors
Heidelberg. doi:10.1007/978-3-642-23029-5Seismic Wave Propagation and and do not necessarily represent those of their affiliated organizations, or those of
Scattering in the Heterogeneous Earth : Second Edition the publisher, the editors and the reviewers. Any product that may be evaluated in
Scala, A., Serra, M., Festa, G., and Roux, P. (2019). Insight into the Wave Scattering this article, or claim that may be made by its manufacturer, is not guaranteed or
Properties of the Solfatara Volcano, Campi Flegrei, Italy. Front. Earth Sci. 7, endorsed by the publisher.
307. doi:10.3389/feart.2019.00307
Serra, M., Festa, G., Roux, P., Gresse, M., Vandemeulebrouck, J., and Zollo, A. Copyright © 2022 Di Martino, De Siena, Serlenga and De Landro. This is an open-
(2016). A Strongly Heterogeneous Hydrothermal Area Imaged by Surface access article distributed under the terms of the Creative Commons Attribution
Waves: The Case of Solfatara, Campi Flegrei, Italy. Geophys. J. Int. 205 (3), License (CC BY). The use, distribution or reproduction in other forums is permitted,
1813–1822. doi:10.1093/gji/ggw119 provided the original author(s) and the copyright owner(s) are credited and that the
Shapiro, N. M. (2000). The Energy Partitioning and the Diffusive Character of the original publication in this journal is cited, in accordance with accepted academic
Seismic Coda. Bull. Seismological Soc. America 90 (3), 655–665. doi:10.1785/ practice. No use, distribution or reproduction is permitted which does not comply
0119990021 with these terms.
Frontiers in Earth Science | www.frontiersin.org 12 March 2022 | Volume 10 | Article 852510You can also read