Experimental assessment of a micro-pulse lidar system in comparison with reference lidar measurements for aerosol optical properties retrieval
←
→
Page content transcription
If your browser does not render page correctly, please read the page content below
Atmos. Meas. Tech., 14, 5225–5239, 2021
https://doi.org/10.5194/amt-14-5225-2021
© Author(s) 2021. This work is distributed under
the Creative Commons Attribution 4.0 License.

Experimental assessment of a micro-pulse lidar system in
comparison with reference lidar measurements for
aerosol optical properties retrieval
Carmen Córdoba-Jabonero1 , Albert Ansmann2 , Cristofer Jiménez2 , Holger Baars2 , María-Ángeles López-Cayuela1 ,
and Ronny Engelmann2
1 InstitutoNacional de Técnica Aeroespacial (INTA), Atmospheric Research and Instrumentation Branch,
Torrejón de Ardoz, 28850 Madrid, Spain
2 Leibniz Institute for Tropospheric Research (TROPOS), Leipzig, Germany

Correspondence: Carmen Córdoba-Jabonero (cordobajc@inta.es)

Received: 23 October 2020 – Discussion started: 31 October 2020
Revised: 2 June 2021 – Accepted: 18 June 2021 – Published: 30 July 2021

Abstract. Simultaneous observations of a polarized micro-          mination and VLDR testing analysis needs to be performed
pulse lidar (P-MPL) system and two reference European              on a regular basis to correct the P-MPL measurements in or-
Aerosol Research Lidar Network lidars running at the               der to derive suitable aerosol products. A dust event observed
Leipzig site Germany, 51.4◦ N, 12.4◦ E; 125 m a.s.l.) were         in Leipzig in June 2019 is used for illustration.
performed during a comprehensive 2-month field intercom-
parison campaign in summer 2019. An experimental assess-
ment regarding both the overlap (OVP) correction of the P-
MPL signal profiles and the volume linear depolarization ra-       1   Introduction
tio (VLDR) analysis, together with its impact on the retrieval
of the aerosol optical properties, is achieved; the experi-        Active remote sensing is an excellent tool for vertical moni-
mental procedure used is also described. The optimal lidar-        toring of the atmosphere. In particular, aerosol lidar systems
specific OVP function is experimentally determined, high-          have demonstrated to be suitable instrumentation for aerosol
lighting that the one delivered by the P-MPL manufacturer          and cloud profiling in both the troposphere and stratosphere
cannot be used long. Among the OVP functions examined,             (e.g. Amiridis et al., 2015; Baars et al., 2019). Tropospheric
the averaged function between those obtained from the com-         aerosols are usually confined up to 7–8 km height under
parison of the P-MPL observations with those of the other          aerosol intrusion conditions (e.g. Mattis et al., 2008; Pap-
two reference lidars seems to be the best proxy at both near-      palardo et al., 2013); otherwise, they are mostly concentrated
and far-field ranges. In addition, the impact of the OVP func-     in the ABL (around less than 1.5 km height). Indeed, lidar
tion on the accuracy of the retrieved profiles of the total par-   systems are widely used due to their high vertical spatial and
ticle backscatter coefficient (PBC) and the particle linear de-    temporal resolution.
polarization ratio (PLDR) is examined. The VLDR profile is            Ground-based lidar networks are widely operative within
obtained and compared with that derived from the reference         the GAW (Global Atmospheric Watch) Aerosol LIdar Ob-
lidar, showing that it needs to be corrected by a small offset     servations Network (GALION); among them, there are those
value with good accuracy. Once P-MPL measurements are              extended at continental scales, such as EARLINET (Euro-
optimally (OVP, VLDR) corrected, both the PBC and PLDR             pean AeRosol LIdar NETwork; Pappalardo et al., 2014),
profiles can be accurately derived and are in good agreement       which also belongs to the Aerosol Cloud and Trace Gases
with reference aerosol retrievals. Overall, as a systematic re-    Research Infrastructure (ACTRIS), AD-NET (Asian Dust
quirement for lidar systems, an adequate OVP function deter-       and aerosol lidar observation network; Sugimoto et al.,
                                                                   2008), and LALINET (aka ALINE, Latin American Li-

Published by Copernicus Publications on behalf of the European Geosciences Union.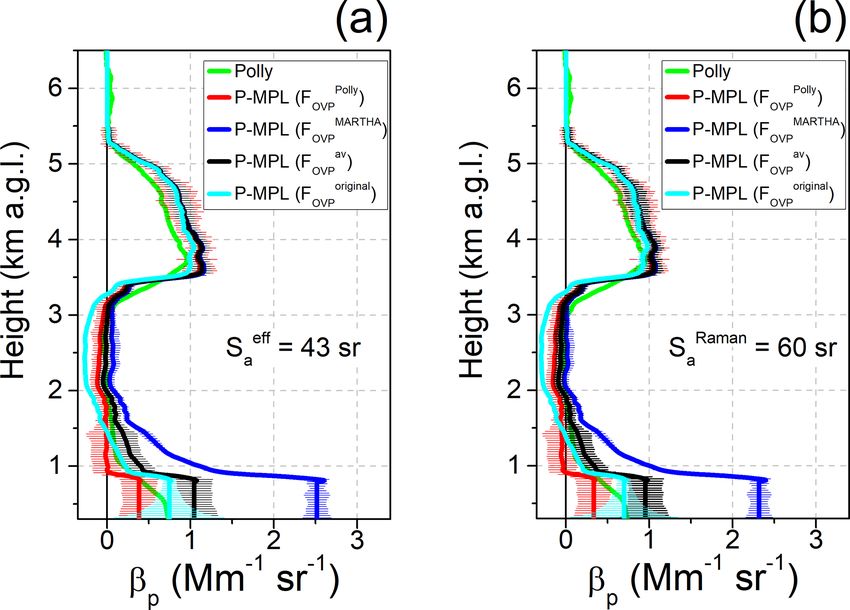
5226                                            C. Córdoba-Jabonero et al.: Experimental assessment of a micro-pulse lidar

dar NETwork; Barbosa et al., 2014). In addition, there              2020) and cloud thermodynamic phase (Lewis et al., 2020),
are other aerosol networks like MPLNET (Micro-Pulse Li-             and assessment of the radiative effect of aerosols and cirrus
dar NETwork; Welton et al., 2001) within GAW/GALION                 clouds (Campbell et al., 2016; Lolli et al., 2017; Córdoba-
and PollyNET (POrtabLe Lidar sYstem NETwork; Baars et               Jabonero et al., 2020, 2021; Campbell et al., 2021; Sicard et
al., 2016), operated as a part of EARLINET, whose sites are         al., 2021), among other things. These studies demonstrated
distributed around the world.                                       good MPL performance in aerosol and cloud research. The
   The use of the lidar observations with polarization capabil-     P-MPL is an elastic coaxial single-wavelength (532 nm) sys-
ities is increasing as the lidar depolarization measurements        tem and, different from older MPL versions (Campbell et
allow a better aerosol speciation (dust, marine aerosol, an-        al., 2002; Welton and Campbell, 2002), incorporates depolar-
thropogenic pollution, volcanic ash, biomass burning, pollen,       ization capabilities (Flynn et al., 2007). As a value-added im-
etc.) as well as the separation of the optical properties           provement, it can operate in routine continuous (24/7) mode.
(backscatter, extinction) of particle components within com-        However, the P-MPL system needs to be well characterized
plex aerosol mixtures with vertical resolution (e.g. Tesche         in terms of the backscattered lidar signal detected by both
et al., 2009; Ansmann et al., 2011; Burton et al., 2014; Yu         depolarization channels of the instrument (Flynn et al., 2007;
et al., 2015; Córdoba-Jabonero et al., 2018; Bohlmann et            Welton et al., 2018) in order to retrieve plausible aerosol opti-
al., 2019). Therefore, new and promising methods based on           cal properties. In particular, due to the very narrow telescope
the particle depolarization ratio were developed and used to        field of view, the lidar system reaches the full OVP height at
derive aerosol profiles in terms of particle mass concentration     relatively high altitudes (typically at 4–6 km height; Camp-
separately for the coarse and fine modes (e.g. Mamouri and          bell et al., 2002), which is particularly relevant for tropo-
Ansmann, 2017) and to estimate both the cloud-condensation          spheric aerosol research. For this reason, an accurate overlap
nuclei (CCN) and ice-nucleating particle (INP) concentra-           correction, among other features, is needed for MPL systems.
tions (e.g. Mamouri and Ansmann, 2016).                                MPLNET have established methods for overlap calibra-
   The atmospheric lidar scanning provides an accurate char-        tion, as those described in Berkoff et al. (2003). They are
acterization at all ranges; however, lidar systems present an       based on either performing measurements under atmospheric
incomplete response in the near-range observational field due       stable and homogeneous conditions with the MPL pointing
to the partial intersection of the field of view between the        in the horizontal direction or making use of a secondary wide
transmitter and the receiver for both the biaxial and coaxial       field-of-view receiver (WFR) telescope. However, both of
lidar configurations. Therefore, lidar signal profiles must be      them could not yet be applied on the site of the MPL sys-
corrected by this near-field loss of signal, that is, the overlap   tem examined in this study. Hence, an alternative experimen-
(OVP) correction (Wandinger and Ansmann, 2002). The full            tal procedure for the OVP function determination is intro-
OVP height depends on the lidar system (e.g. Wandinger et           duced in this work, which is based on the cross-comparison
al., 2016).                                                         of the backscattered signal recorded by the uncorrected li-
   During the last two decades, micro-pulse lidar (MPL) sys-        dar system (our MPL) with respect to that collected by a
tems (Campbell et al., 2002; Welton and Campbell, 2002;             reference (overlap-corrected) lidar. A similar methodology
manufacturer: Sigma Space Corp., currently Droplet Mea-             has been also used for the overlap correction of other li-
surement Technologies) were deployed at different latitudes         dars and ceilometers (e.g. Guerrero-Rascado et al., 2010;
and many of them in the frame of MPLNET; in the last                Sicard et al., 2020; and references therein). In this frame-
few years, a polarized MPL version (P-MPL) is the stan-             work, an experimental campaign was planned at the EAR-
dard lidar system in this network. Both MPL and P-MPL               LINET Leipzig, site (Germany) and, in particular, devoted
observations have been widely performed for continuous              to simultaneously comparing the observations of a P-MPL
monitoring of aerosols and clouds. In particular, MPL/P-            system with reference well-calibrated lidar measurements in
MPL measurements were used for atmospheric boundary                 order to determine the required P-MPL performance.
layer (ABL) height retrievals (Lewis et al., 2013; Toledo              The aim of this work is threefold: (1) to achieve an OVP
et al., 2014, 2017), detection and characterization of both         correction of a P-MPL system, i.e. to estimate the exper-
cirrus clouds (Campbell et al., 2016; Lewis et al., 2016;           imental OVP function for correcting the P-MPL measure-
Córdoba-Jabonero et al., 2017; Lolli et al., 2017; Camp-            ments; (2) to evaluate the volume linear depolarization ra-
bell et al., 2021) and polar stratospheric clouds (PSCs)            tio (VLDR), which is a lidar-derived parameter indepen-
(Campbell and Sassen, 2008; Córdoba-Jabonero et al., 2013),         dent of OVP correction; and (3) to determine the P-MPL
depolarization-based characterization of the optical prop-          correction-induced effects on the retrieval of optical prop-
erties of different aerosol mixtures (Sicard et al., 2016;          erties, including both the height-resolved particle backscat-
Córdoba-Jabonero et al., 2016, 2018), aerosol mass concen-          ter coefficient (PBC) and particle linear depolarization ratio
tration estimation either in synergy with airborne measure-         (PLDR). Section 2 introduces the methodology for that pur-
ments (Córdoba-Jabonero et al., 2016) or in comparison with         pose: an overview of the field intercomparison campaign per-
forecast model simulations (Córdoba-Jabonero et al., 2019),         formed, a brief description of both the P-MPL and reference
determination of the precipitation intensity (Lolli et al., 2018,   lidar systems used, and the experimental approaches applied

Atmos. Meas. Tech., 14, 5225–5239, 2021                                              https://doi.org/10.5194/amt-14-5225-2021
C. Córdoba-Jabonero et al.: Experimental assessment of a micro-pulse lidar                                                     5227

for the data analysis regarding the experimental estimation         Space Corp.: MPL system information handbook, 2018). P-
of the OVP function of the P-MPL system (error processing           MPL vertical profiles are routinely acquired with 1 min in-
is described in Appendix A), the evaluation of the VLDR,            tegrating time and 15 m vertical resolution (in particular, for
and the retrieval of the particle optical properties. Results are   the ARN/Huelva P-MPL system) up to 30 km height. The
presented in Sect. 3. A dust case observed during the field         main instrumental features of the P-MPL system are shown
campaign is used for that purpose. The main conclusions are         in Table 1.
presented in Sect. 4.                                                  The optical layout of the MPL-4B version is schematically
                                                                    shown in Fig. 1 of Flynn et al. (2007). The laser light is alter-
                                                                    natively transmitted linearly and circularly polarized to the
2     Methodology                                                   atmosphere by switching between two retardation modes of
                                                                    a ferroelectric liquid crystal (FLC) rotator. The correspond-
2.1     Field campaign overview                                     ing backscattered light to the two polarized states by passing
                                                                    through a beam splitter to the single APD is recorded de-
During a field campaign carried out at the EARLINET sta-
                                                                    pending on the polarizing or depolarizing atmospheric par-
tion at Leipzig, Germany (51.35◦ N, 12.43◦ E; 125 m a.s.l.),
                                                                    ticles leading to the suppression or not, respectively, of the
managed by the Leibniz Institute for Tropospheric Research
                                                                    orthogonally detected signal with respect to the transmitted
(TROPOS) for 6 weeks in June–July 2019, the perfor-
                                                                    one into the single APD. The two polarized signals are semi-
mance of a P-MPL system was experimentally examined
                                                                    simultaneously detected by alternatively switching on the ba-
with a special emphasis on the OVP correction and VLDR
                                                                    sis of 50%/50% of the FLC polarization mode within ev-
evaluation. The lidar system used was the MPL44245 unit
                                                                    ery integrating minute. Note that the P-MPL pulse frequency
(formerly Sigma Space Corp., currently Droplet Measure-
                                                                    is 2500 Hz and the polarization state is switched every 250
ment Technologies) routinely operating at the MPLNET/El
                                                                    pulses but just 249 pulses are collected since one of the pulses
Arenosillo station sited at Huelva, Spain (ARN/Huelva,
                                                                    is discarded during the FLC switching time (∼ 100 µs). That
37.1◦ N, 6.7◦ W; 40 m a.s.l.), which is managed by the Span-
                                                                    is, the two signals are alternatively detected by the same APD
ish Institute for Aerospace Technology (INTA). Both sta-
                                                                    and are recorded in two polarized channels, i.e. the 532 nm
tions are also AERONET (AErosol RObotic NETwork) sites,
                                                                    cross-signal (Pcross ) and the 532 nm co-signal (Pco ) (for a
accomplishing the requisite for co-location of both net-
                                                                    more detailed description see Flynn et al., 2007). Therefore,
works for the elastic retrieval of the aerosol optical prop-
                                                                    since there are no potentially existing efficiency or alignment
erties. For the campaign, this P-MPL was temporarily de-
                                                                    differences between the two signal-channels (as used a single
ployed outside MPLNET at Leipzig to be compared against
                                                                    APD), no corrections for these effects are required, as is typ-
two EARLINET lidars routinely operative in this station
                                                                    ically needed for ordinary two-channel polarization lidars.
as Polly (POrtabLe Lidar sYstem; Althausen et al., 2009;
                                                                    Particular regular calibrations and signal processing were ap-
Engelmann et al., 2016) and MARTHA (Multiwavelength
                                                                    plied, which are the same as those described by Campbell
Tropospheric Raman lidar for Temperature, Humidity, and
                                                                    et al. (2002) and Welton and Campbell (2002) and also by
Aerosol profiling; Jimenez et al., 2018) systems. They were
                                                                    Flynn et al. (2007), whose data processing techniques also
used as reference because these lidars are well characterized
                                                                    remain applicable for P-MPL systems, as indicated by Wel-
with respect to EARLINET quality assurance standards (e.g.
                                                                    ton et al. (2018). Therefore, the measured lidar signal in the
Böckmann et al., 2004; Pappalardo et al., 2004; Freuden-
                                                                    two polarized channels is used to derive both the P-MPL total
thaler et al., 2008; Pappalardo et al., 2014; Wandinger
                                                                    range-corrected signal (RCS), P MPL , and the volume linear
et al., 2016; Belegante et al., 2018; Granados-Muñoz et
                                                                    depolarization ratio (VLDR), δ V , by adapting the methodol-
al., 2016; Freudenthaler et al., 2016).
                                                                    ogy as described in Flynn et al. (2007), that is
2.2     Lidar systems
                                                                    P MPL = Pco + 2Pcross , and                                  (1)
2.2.1    Polarized micro-pulse lidar (P-MPL)                                Pcross
                                                                    δV =              .                                          (2)
                                                                         Pco + Pcross
The P-MPL system (Sigma Space Corp./Droplet Measure-
ment Technologies, version MPL-4B) is the standard lidar            This data processing has been successfully applicable in pre-
currently operating within MPLNET. It is an elastic lidar in        vious studies (e.g. Sicard et al., 2016; Córdoba-Jabonero et
coaxial configuration with depolarization capabilities oper-        al., 2018; Lewis et al., 2020), independently of those estab-
ating in full-time (24/7) mode. Among the principal opti-           lished in MPLNET. Among the required routine instrumen-
cal features, the Nd-YVO4 laser emission at 532 nm with a           tal P-MPL corrections (Campbell et al., 2002; Welton and
pulse energy of 6–8 µJ and a repetition rate of 2500 Hz is          Campbell, 2002), the OVP is a concerning issue since the
recorded by a unique avalanche photodiode detector (APD),           typical full OVP height is reached at rather high altitudes
the receiver system presents a field of view (FOV) of 80 µrad       (usually at 4–5 km height), thus affecting the aerosol pro-
full angle, and the telescope diameter is 18 cm wide (Sigma         files at ranges in the overall boundary layer and part of the

https://doi.org/10.5194/amt-14-5225-2021                                              Atmos. Meas. Tech., 14, 5225–5239, 2021
5228                                               C. Córdoba-Jabonero et al.: Experimental assessment of a micro-pulse lidar

Table 1. Main instrumental features of the lidar systems.

                             Lidar system                   P-MPL                  Polly        MARTHA
                             Routine operation              24/7                   24/7         Supervised
                             Lidar networks                 MPLNET                 EARLINET     EARLINET
                             Transmitter properties
                             Wavelength (nm)                532                    532∗         532∗
                             Energy/pulse (mJ)              0.006-0.008            400          1000
                             Pulse frequency (Hz)           2500                   20           30
                             Eye safety                     Yes (ANSI Class II)    No           No
                             Receiver properties
                             Telescope diameter (cm)        18                     30           80
                             Telescope focal length (m)     2.23                   0.89         9
                             FOV (µrad full angle)          80.4                   1000         500
                             Depolarization                 Yes                    Yes          Yes
                             Raman detection                No                     Yes          Yes
                           ∗ Used in this study.

troposphere. Hence, an important issue to be achieved is the            full OVP is reached at around 300–500 m height and thus
particular overlap correction function for this particular P-           preferred for the P-MPL OVP correction purpose. Profiles of
MPL system. After purchase, the P-MPL system is deliv-                  the Polly range-corrected signal, P Polly , are routinely derived
ered with an original OVP function as provided by the man-              using sample settings with 7.5 m vertical resolution and 30 s
ufacturer company (formerly Sigma Space Corp., currently                temporal integration. The main instrumental features of the
Droplet Measurement Technologies), which, however, must                 Polly system are shown in Table 1.
be re-evaluated with time. Indeed, one of the goals of this
work is to show the experimental procedure, similarly to oth-           2.2.3     Multiwavelength Atmospheric Raman lidar for
ers (e.g. Guerrero-Rascado et al., 2010; Sicard et al., 2020),                    Temperature, Humidity, and Aerosol profiling
to obtain a new OVP function for the P-MPL lidar as com-                          (MARTHA)
pared to the original function (see Sect. 2.3.1), together with
examining its effects on the retrieval of the optical properties.
                                                                        The second EARLINET lidar, which is used as a refer-
2.2.2   POrtabLe Lidar sYstem (Polly)                                   ence in this work, is the dual receiver field of view (RFOV)
                                                                        Multiwavelength Atmospheric Raman lidar for Tempera-
The EARLINET Polly (POrtabLe Lidar sYstem) lidars are                   ture, Humidity, and Aerosol profiling (MARTHA) (Mattis
sophisticated, automated Raman-polarization lidar systems               et al., 2008; Schmidt et al., 2013; Jimenez et al., 2019).
for scientific purposes but with the advantage of being an              MARTHA has a powerful laser, transmitting in total 1 J
easy-to-use and well-characterized instrument with the same             per pulse at a repetition rate of 30 Hz with an 80 cm tele-
design, automated operation, and centralized data process-              scope diameter and is thus well designed for tropospheric
ing delivering near-real-time data products. Polly systems              and stratospheric aerosol observations. This lidar system
have been developed and constructed at TROPOS with in-                  measures Raman signals at 532 nm (P MARTHA , which is
ternational partners since 2002 (Engelmann et al., 2016).               used in this work) and 607 nm as well as the polarization-
All Polly lidar systems are designed for automatic and unat-            sensitive 532 nm backscatter signals at two RFOVs so that,
tended operation in 24/7 mode. Twelve Polly lidar systems               besides aerosol profiles, cloud microphysical properties can
are distributed around the globe (Baars et al., 2016). The              be retrieved from measured cloud multiple scattering effects.
Polly lidar system used as a reference in this comparison               MARTHA can provide the 532 nm particle depolarization ra-
analysis is the first one of the Polly family (Engelmann et             tio as measured with the smaller RFOV and also the 355,
al., 2016), which was substantially upgraded in 2016 (ver-              532, and 1064 nm particle backscatter coefficients and the
sion Polly_1v2). It emits linearly polarized light at 532 nm            355 and 532 nm extinction coefficient profiles with their cor-
with five receiver channels: elastically backscattered light at         responding lidar ratio profiles. For this large telescope (and
532 nm, cross-polarized light at 532 nm, co-polarized light at          a selected receiver FOV of 0.5 mrad), the overlap between
532 nm, rotational Raman scattered light near 532 nm, and               the laser beam and receiver FOV is complete around 2000 m
vibrational–rotational Raman scattered light at 607 nm. Its             height. The overlap profile of this laboratory lidar is very sta-

Atmos. Meas. Tech., 14, 5225–5239, 2021                                                    https://doi.org/10.5194/amt-14-5225-2021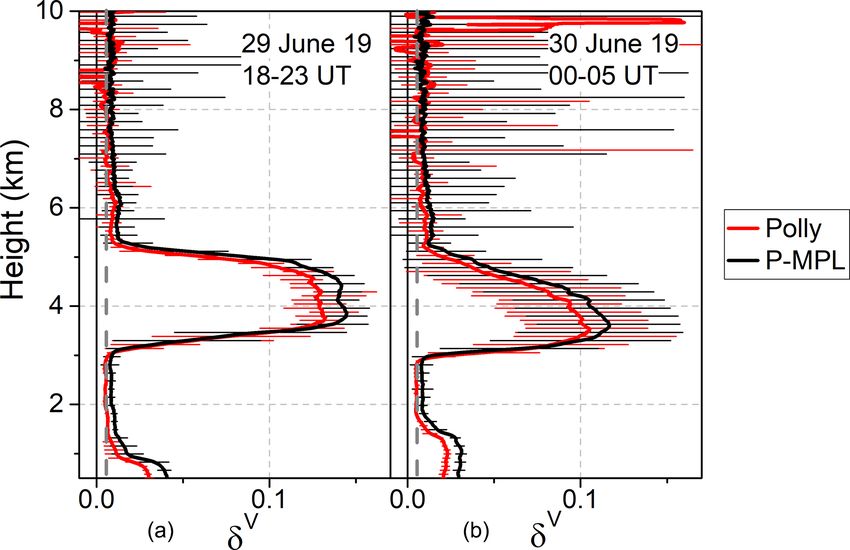
C. Córdoba-Jabonero et al.: Experimental assessment of a micro-pulse lidar                                                    5229

ble. The main instrumental features of the MARTHA system           et al., 1997); hence, an effective LR, Saeff , is also obtained
are shown in Table 1.                                              after convergence.
                                                                      The particle linear depolarization ratio (PLDR), δp , can be
2.3   Experimental estimation of the overlap (OVP)                 determined as follows:
      function
                                                                        Rδ V (1 + δmol ) − δmol 1 + δ V

The overlap (OVP) function, FOVP , is used to correct the P-       δp =                                  ,                     (5)
MPL (no OVP-corrected) RCS profiles, P MPL (z), obtained                   R (1 + δmol ) − 1 + δ V
from Eq. (1), at near-field altitudes, that is
                                                                   where R is the backscattering ratio (R = ( mβm p ) , with βm
                                                                                                                 β +β
  MPL
      (z) = P MPL (z) FOVP (z) ,

POVP                                                     (3)
                                                                   being the molecular backscattering coefficient), δ V is the
where POVP MPL (z) represents the overlap-corrected P-MPL
                                                                   volume linear depolarization ratio (VLDR), and δmol is the
RCS profiles.                                                      molecular depolarization ratio. For P-MPL systems, δmol =
   In this work, the experimental procedure to obtain FOVP         0.0037, which is almost independent of atmospheric temper-
is based on the comparison of the P MPL (z) to either the          ature (relative uncertainty < 0.1 %), as their FWHM is less
Polly RCS profiles, P Polly (z), or the MARTHA profiles,           than 0.2 nm (Behrendt and Nakamura, 2002). The PLDR is
P MARTHA (z), which are both used as reference under rel-          a lidar parameter widely used for defining the aerosol type
atively clean and mostly clear conditions. The Polly and           (Burton et al., 2012; Groß et al., 2013) and for discriminating
MARTHA lidars present the advantage in contrast to P-              the particle size mode in some aerosol mixtures (Mamouri
MPL system that the OVP function can be experimen-                 and Ansmann, 2017; Córdoba-Jabonero et al., 2018), among
tally determined using their Raman channels (Wandinger             others. The determination of PBC mainly depends on the
and Ansmann, 2002). The P-MPL overlap function is thus             OVP correction, as will be discussed in Sect. 3.3; hence, the
calculated in terms of the ratio between the P-MPL and             PLDR is also affected by OVP. Therefore, a good knowledge
Polly/MARTHA RCS profiles, i.e.                                    of the OVP function for the specific P-MPL system is also
                      .                                            needed to obtain high-quality PBC and PLDR profiles.
FOVP (z) = P MPL (z) P ref (z) ,                        (4)           The volume linear depolarization ratio (VLDR), δ V , can
                                                                   be determined in relation with the P-MPL depolarization
where P ref (z) denotes the reference RCS profiles as obtained     ratio, δ MPL (Mishchenko and Hovenier, 1995; Gimmestad,
from either Polly, P Polly (z), or MARTHA, P MARTHA (z),           2008). Looking at the formulae shown in Eq. 1.8 in Flynn et
measurements. Both sets of RCS profiles are normalized             al. (2007), δ V can be easily expressed as
at a given height (higher than the OVP altitude range un-
der aerosol-free conditions), znorm , and then FOVP (z) can                 δ MPL      Pcross
be derived using Eq. (3). In particular, the full OVP is           δV =     MPL
                                                                                   =             ,                              (6)
                                                                          δ     + 1 Pco + Pcross
conservatively obtained at the normalization height znorm =
9.5 km a.g.l., which is FOVP (z) = 1 at z ≥ znorm . Errors asso-
ciated with the estimation of FOVP (z) using this experimental     i.e. Eq. (2) is obtained, where δ MPL is defined as the ratio be-
approach are described in Appendix A. Night-time lidar ob-         tween Pcross and Pco (the two polarized RCSs, as described
servations performed under relatively clean conditions at the      in Sect. 2.2.1). Since the OVP function is equally applied
Leipzig station (AERONET AOD < 0.1 and AE > 1.2) were              to both signals, the VLDR is unaffected by the OVP correc-
used for the P-MPL OVP determination. In particular, two           tion; however, it actually affects, together with the PBC, the
time periods were selected in coincidence with either Polly or     PLDR estimation (see Eq. 5). Therefore, the VLDR for the
MARTHA observations in order to provide an extended com-           P-MPL system was also experimentally evaluated in com-
parison analysis using diverse reference lidar systems under       parison with that derived from Polly lidar measurements,
different lidar operational conditions.                            for instance, similarly to the approach shown by Córdoba-
                                                                   Jabonero et al. (2013). This experimental polarization cor-
2.4   Retrieval of the aerosol optical properties: particle        rection is based on real measurements as an alternative (see
      backscatter coefficient and both volume and                  Sect. 3.2), due to the unavailability of applying the spe-
      particle linear depolarization ratios                        cial and specific methods for polarization calibration within
                                                                   MPLNET, as those described in Welton et al. (2018).
Once the OVP-corrected RCS is obtained from Eq. (3),                  All the variables are height resolved, but the altitude de-
the particle backscatter coefficient (PBC), βp (km−1 sr−1 ),       pendence is omitted for simplicity. A dust case occurring for
can be derived applying the Klett–Fernald (KF) algorithm           the night of 29–30 June 2019 at the Leipzig station is se-
(Fernald, 1984; Klett, 1985) by constraining the lidar ra-         lected for that purpose (in particular, the dust intrusion ob-
tio (LR; extinction-to-backscatter ratio) with the AERONET         served over Leipzig in June 2019 is widely characterized in
aerosol optical depth (AOD) (elastic KF solution) (Marenco         Córdoba-Jabonero et al., 2021).

https://doi.org/10.5194/amt-14-5225-2021                                             Atmos. Meas. Tech., 14, 5225–5239, 2021
5230 C. Córdoba-Jabonero et al.: Experimental assessment of a micro-pulse lidar
Figure 1. Comparison of the normalized reference (a) Polly (red
line; for clarity, the 12 P-MPL and Polly RCS profiles from 28 June
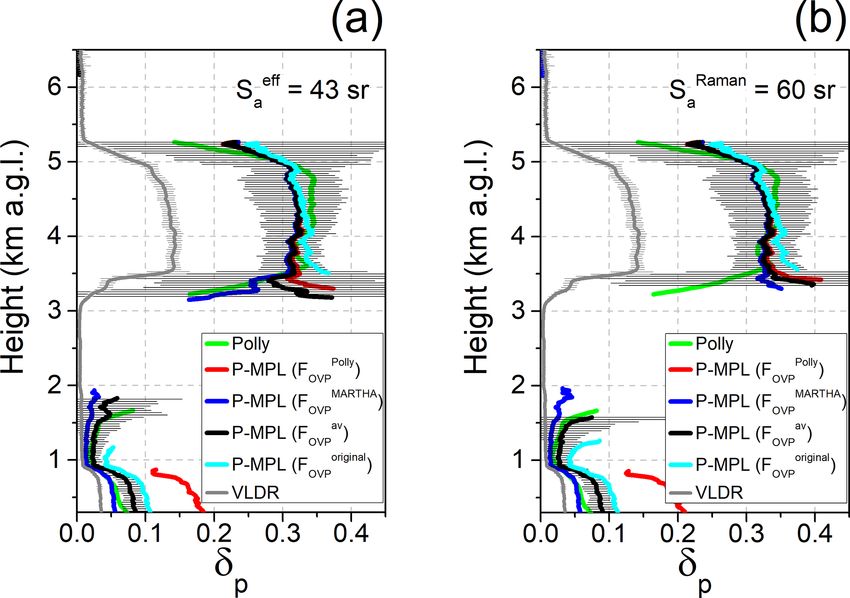
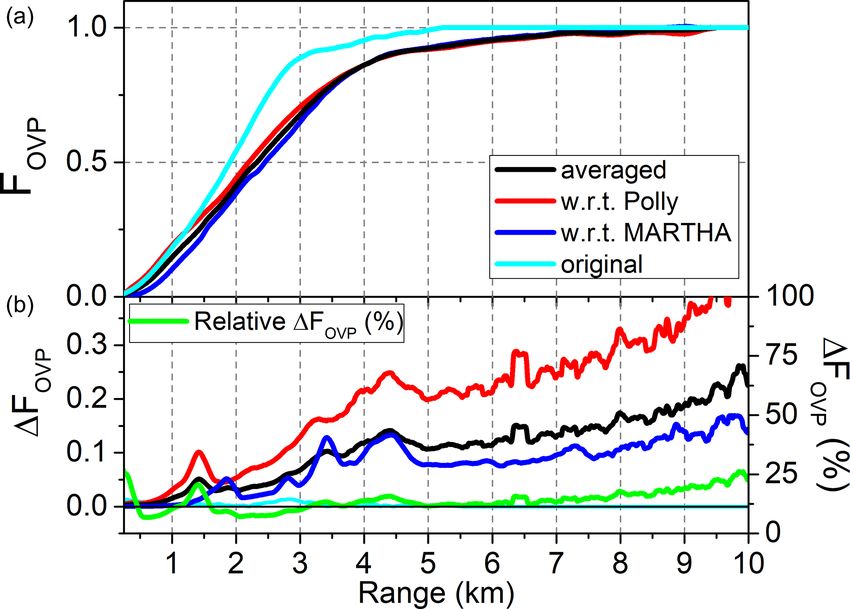
Figure 2. (a) Experimental overlap functions, FOVP , as obtained for
18:00 UT to 29 June 05:00 UT were averaged) and (b) MARTHA
two different days from the ratio between the P-MPL RCS profiles
(blue line; 4 P-MPL and MARTHA RCS profiles from 23 July Polly
with respect to the Polly (FOVP , red) and MARTHA (FOVP MARTHA ,
21:00 UT to 24 July 00:00 UT were averaged) with respect to the
av
blue) profiles, together with the averaged function (FOVP ) of both
uncorrected by overlap P-MPL profiles (black lines). Normalization
height at 9.5 km a.g.l. The aerosol-free background signal is shown of them (black line); the original overlap function as provided by
original
by a grey dashed line. the manufacturer, FOVP , is also included (cyan line). (b) Errors,
1FOVP , associated with the OVP function estimation for each com-
parison case: P-MPL with respect to Polly (red), P-MPL with re-
spect to MARTHA (blue), and the averaged OVP function of both
3 Results original
of them (black); the error for FOVP (cyan) and the relative error
av
for FOVP (green line) are also included.
3.1 Experimental overlap function FOVP
P-MPL observations were carried out from 6 June to 26 July
2019 at the Leipzig station during the field campaign. Si- with respect to Polly and MARTHA lidar measurements (top
Polly MARTHA in blue) (see Eq. 4) to-
multaneous P-MPL and Polly/MARTHA measurements as panel: FOVP in red and FOVP
original
performed under relatively clean conditions were selected gether with FOVP ; the associated errors are also shown in
for estimating the OVP function. The first comparison anal- the bottom panel. In addition, as both of the OVP functions
ysis corresponded to 12-hourly averaged P-MPL and Polly were obtained on two different days, temperature-related
RCS profiles within the night-time period from 28 June 2019 changes could be produced in the OVP estimation. Hence,
at 18:00 UT to 29 June 2019 at 05:00 UT (daytime val- the averaged FOVP av (z) between both OVP functions is also
ues on 28 June at 18:00 UT: AOD = 0.10, Ångstrom expo- calculated and shown together with the absolute and relative
nent AE = 1.59). The second comparison was related to the errors in Fig. 2 (top and bottom panels, respectively). Details
MARTHA night-time RCS measurements as averaged for 4 h on the OVP error processing are described in Appendix A.
from 23 July 2019 at 21:00 UT to 24 July 2019 at 00:00 UT By comparing with the original OVP function, large dis-
(daytime values on 23 July at 18:00 UT: AOD = 0.09, AE = crepancies can be clearly observed, highlighting the change
1.33); P-MPL RCS profiles were also averaged during that of FOVP (z) with time, mostly in the relevant 1–5 km height
same period for comparison. Figure 1 shows the uncorrected Polly Martha , dif-
range. Regarding the OVP functions FOVP and FOVP
by overlap P-MPL RCS profiles in comparison with the ref- ferences are also found, mostly in the near-field range up
erence Polly (left panel) and MARTHA (right panel) profiles to around 3 km height. However, by using FOVP av (z) instead
for both of those particular periods. The part of the P-MPL of one of two others for P-MPL RCS correction, its rela-
RCS profiling to be OVP-corrected is clearly highlighted, tive error is just 14 ± 5 % on average from 0.3 up to 10 km
ranging from the surface up to around 6 km height. Next, height (see Fig. 2, bottom). Taking into account these er-
the experimental estimation of FOVP for the P-MPL system av (z) can be the OVP function used for correcting
rors, FOVP
is analysed in terms of the OVP-corrected RCS as obtained the P-MPL RCS profiles at near-field heights, following the
Polly
by applying each of the experimentally estimated FOVP and expression in Eq. (3), as it seems to be the best proxy for
MARTHA (see Sect. 2.3.1), also including a comparison with
FOVP OVP correction of the P-MPL RCS profiles.
original The previous uncorrected and OVP-corrected P-MPL RCS
the original one, FOVP (as provided by the manufacturer).
Figure 2 shows the experimental OVP functions, FOVP (z), profiles using both FOVP av and F original are shown in Fig. 3.
OVP
as obtained from the comparison of the P-MPL RCS profiles Slight differences are observed for the P-MPL RCS pro-
Atmos. Meas. Tech., 14, 5225–5239, 2021 https://doi.org/10.5194/amt-14-5225-2021C. Córdoba-Jabonero et al.: Experimental assessment of a micro-pulse lidar 5231
Figure 3. OVP-corrected (black thick lines) P-MPL RCS profiles Figure 4. Volume linear depolarization ratio (VLDR), δ V , as ob-
using the FOVPav function and the uncorrected RCS profiles (black tained from both the P-MPL (black line) and Polly (15-p smoothed
thin lines) with respect to (a) Polly (red line) and (b) MARTHA red line) measurements carried out on: (a) 29 June 2019, as aver-
(blue line) RCS profiles, together with the OVP-corrected profiles aged from 18:00 to 23:00 UT and (b) 30 June 2019, as averaged
original from 00:00 to 05:00 UT (error bars are also shown in black and red,
using FOVP (cyan lines).
respectively). The aerosol-free background δ V is marked by a grey
dashed line.
files as compared to the Polly and MARTHA ones using
av , despite it being calculated from averaging F Polly and
FOVP OVP second interval due to the decay of dusty conditions at the
MARTHA , which were obtained from measurements on dif-
FOVP end of that period, as reflected by a larger error uncertainty
ferent days (only about one month between them). Large dif- in time averaging. Overall, despite δMPLV values seeming to
original V
ferences are clearly found when FOVP is applied, mostly be higher than those of δPolly , peaking between 0.11 and 0.14
between 1.5 and 3 km height, showing that the OVP function in the dust layer, they are within the error range. Hence, the
as provided by the manufacturer is not applicable for aerosol VLDR was averaged within several aerosol-free height in-
research after some time, being necessary to regularly de- tervals below and above that defined dust layer to analyse
termine a OVP function, as performed and described in this potential changes and offsets. The mean δ V values (and their
work. Once the P-MPL RCS profiles are OVP-corrected, the standard deviation, SD) are shown in Table 2.
V
Looking at the results, δPolly presents larger errors than
optical properties of the aerosols can be retrieved using in-
version algorithms. OVP-induced effects on the inversion of V
those for δMPL , because it is associated with a lower signal-
the aerosol optical properties are analysed in Sect. 3.3. to-noise ratio as height increases for the Polly measurements
(no smoothing applied). This is reflected by the higher rel-
3.2 Volume linear depolarization ratio (VLDR) ative error (%SD) found for the Polly VLDR (23 %) with
respect to that for the P-MPL (6 %) when all the aerosol-
Before analysing the OVP impact on the retrieval of the free height intervals are considered. Mean δ V values of
aerosol optical properties, the VLDR is also examined. As 0.0089 ± 0.0005 (%SD: 6 %) and 0.0049 ± 0.0011 (%SD:
stated before, despite the VLDR being unaffected by the 23 %), are found, respectively, for the P-MPL and Polly
OVP correction, it actually affects, together with the PBC, VLDR. As a result, a constant offset, 1 (= δPolly V V ),
− δMPL
βp , the PLDR, δp , estimation (see Sect. 2.4). V V , obtaining 1 =
can be assumed between δMPL and δPolly
The P-MPL VLDR is calculated using Eq. (6) and com-
−0.0040 ± 0.0016. This offset can represent a correction to
pared with that derived from Polly measurements as refer-
account for any slight mismatch in the transmitter and detec-
ence, since TROPOS follows all quality assurance efforts re-
tor polarization planes and any impurity of the laser polariza-
garding polarization lidar calibration tests in the Polly sys-
tion state (Sassen, 2005), as also found in Córdoba-Jabonero
tems as recommended by EARLINET (Freundenthaler et
et al. (2013) by characterizing the VLDR of a relatively older
al., 2008, 2016). A dust outbreak case observed at the Leipzig
version (MPL-4) of the polarized MPL systems. Therefore,
site for the night on 29–30 June 2019 is examined for that
the P-MPL VLDR must also be corrected by that offset using
purpose. Figure 4 shows the VLDR as obtained from both the
V V the expression:
δMPL and δPolly profiles as averaged from 18:00 to 23:00 UT
on 29 June and from 00:00 to 05:00 UT on 30 June (for clar- V corr
δMPL V
= δMPL + 1, (7)
ity, only averaged δ V profiles are shown). The dust signature
is clearly marked, showing a dust layer clearly confined be- V corr is the corrected P-MPL VLDR profile and δ V
where δMPL MPL
tween 3 and 6 km height, with a higher variability for the is the VLDR obtained from Eq. (2).
https://doi.org/10.5194/amt-14-5225-2021 Atmos. Meas. Tech., 14, 5225–5239, 20215232 C. Córdoba-Jabonero et al.: Experimental assessment of a micro-pulse lidar
Table 2. Mean VLDR values together their standard deviation (SD) (and their relative SD error, in %) as obtained from the P-MPL and Polly
V
measurements (δMPL V
and δPolly profiles) for aerosol-free height intervals on 29–30 June 2019.
Height intervals (km) δ V , mean ± SD (%SD)
P-MPL Polly
1.5–2.5 0.0096 ± 0.0016 (16.6) 0.0057 ± 0.0002 (3.4)
7.0–8.0 0.0088 ± 0.0010 (10.8) 0.0057 ± 0.0037 (65.9)
8.0–9.0 0.0083 ± 0.0016 (19.7) 0.003 ± 0.016 (> 100)
Height averaged 0.0089 ± 0.0005 (6.0) 0.0049 ± 0.0011 (23.1)
Regarding the dust layer extended between 3.5 and 5.0 km
height, as expected, a similar δ V value to that obtained for the
V
Polly VLDR (δPolly = 0.11 ± 0.02) is estimated for the cor-
rected P-MPL VLDR, i.e. δMPL V corr = 0.12 ± 0.02, as averaged
within that dust layer. The corresponding PLDR to the δ V are
around 0.3 (as shown in Sect. 3.3), which are typical PLDR
values for dust (Burton et al., 2012; Groß et al., 2013).
3.3 Particle backscatter coefficient (PBC) and particle
linear depolarization ratio (PLDR)
The effect of the OVP correction on the P-MPL RCS is also
analysed regarding the retrieval of the KF-derived βp pro-
original av to the
files, as obtained by applying both FOVP and FOVP
RCS. A dust event observed at Leipzig on the night from
29 to 30 June 2019 (the same dust case as in Sect. 3.2) is Figure 5. Dust case observed on 29 June 2019 at 20:00–21:00 UT
selected for that purpose. In addition, both PLDR, δp (see over Leipzig. Vertical particle backscatter coefficient (PBC), βp , as
Eq. 5), and VLDR, δ V (see Eqs. 6 and 7; 1 offset corrected) retrieved by using the particular OVP function applied to the P-MPL
are estimated. The OVP-induced effect is illustrated, in par- RCS: FOVP with respect to Polly (red) and MARTHA (blue) data
av (black) and F original (cyan) using the KF so-
and both the FOVP
ticular, using the vertical hourly averaged profiling observed OVP
on 29 June 2019 at 20:00–21:00 UT, corresponding to a well- lution with (a) the elastic AOD-constrained LR (Saeff = 43 sr), and
separated two-layer dust case (dust optical depth of 0.061). (b) the Raman-retrieved LR (SaRaman = 60 sr) for the dust layer.
Figures 5 and 6 show the vertical profiles of βp and δp (and Corresponding Polly-retrieved βp profiles are also included (green
lines).
δ V ), respectively, depending on the FOVP applied as retrieved
from the P-MPL measurements, together with those derived
from the Polly measurements for the selected case.
Both P-MPL and Polly datasets show a dust layer clearly depending on FOVP for both the KF solutions (using either
confined between around 3.5 and 5.0 km height. For compar- Saeff or SaRaman ) are shown in Table 3. In general, βp and B are
ison, in addition to the AOD-constrained KF solution for the higher for P-MPL with respect to Polly retrievals. Concern-
PBC (reference height at 6.0 km and reference backscatter ing the KF solutions for P-MPL profiles, a better agreement
coefficient of 10−7 Mm−1 sr−1 ) using Saeff = 43 sr (obtained is achieved when the SaRaman of 60 sr is applied (no AOD con-
from Polly elastic measurements) (see Fig. 5a), βp is also straint), i.e. lower differences for βp and B are found with
retrieved using the Raman-derived LR (SaRaman = 60 sr) for respect to Polly-retrieved values.
that dust layer as obtained from the night-time Polly Raman Nevertheless, the KF retrieval is mostly affected at near-
measurements (data not shown) (see Fig. 5b). field ranges (up to 3 km height) (see Fig. 5), as expected,
Regarding the dust layer, relatively small differences are since the OVP correction is rather relevant at those ranges.
found between Polly and P-MPL βp profiles (see Fig. 5), Negative βp values are predominantly found for the scenar-
Polly original
at least within error uncertainties. In order to assess the dif- ios when the RCS is OVP-corrected by FOVP and FOVP ,
ferences between both datasets, the layer-averaged PBC, βp and are more pronounced when the Sa Raman is applied, since
(Mm−1 sr−1 ), and the integrated backscatter, B (sr−1 ), for the LR to be applied in this height interval must be closer to
this 3.5–5.0 km dust layer were calculated to be used as a the elastic Saeff of 43 sr. The best fitting seems to be achieved
proxy of the degree of agreement. Derived βp and B values using FOVPMARTHA and F av . Among those, however, the re-
OVP
Atmos. Meas. Tech., 14, 5225–5239, 2021 https://doi.org/10.5194/amt-14-5225-2021C. Córdoba-Jabonero et al.: Experimental assessment of a micro-pulse lidar 5233
Table 3. Dust layer-averaged PBC, βp (Mm−1 sr−1 ), and PLDR, δp , and the integrated backscatter, B (10−3 sr−1 ), values, as obtained from
P-MPL βp and δp profiles on 29 June 2019 at 20:00–21:00 UT depending on the FOVP applied for both KF solutions (using Saeff and SaRaman ).
Corresponding Polly values are also included.
P-MPL Polly
FOVP Saeff = 43 sr SaRaman = 60 sr Saeff = 43 sr
βp B δp βp B δp βp B δp
av
FOVP 0.93 ± 0.17 1.41 ± 0.16 0.32 ± 0.01 0.89 ± 0.15 1.35 ± 0.16 0.33 ± 0.01
Polly
FOVP 0.92 ± 0.16 1.40 ± 0.27 0.32 ± 0.01 0.88 ± 0.14 1.33 ± 0.27 0.33 ± 0.01
0.72 ± 0.16 1.08 0.33 ± 0.01
MARTHA
FOVP 0.94 ± 0.17 1.43 ± 0.10 0.32 ± 0.01 0.90 ± 0.15 1.36 ± 0.10 0.32 ± 0.01
original
FOVP 0.87 ± 0.14 1.32 ± 0.05 0.33 ± 0.01 0.83 ± 0.12 1.26 ± 0.08 0.34 ± 0.02
4 Conclusions
A comprehensive 2-month field intercomparison campaign
was performed in summer 2019 to characterize the perfor-
mance of a polarized micro-pulse lidar (P-MPL) system and
to check the quality of the retrieved aerosol products. At-
mospheric observations of the P-MPL system have been ex-
amined against those from two reference EARLINET lidars
(Polly and MARTHA), which are operative at the Leipzig
site Germany, 51.4◦ N, 12.4◦ E; 125 m a.s.l.) and managed by
TROPOS. In particular, an experimental assessment in terms
of the overlap (OVP) correction and its impact on the re-
trieval of the aerosol optical properties has been achieved.
Furthermore, the volume linear depolarization ratio (VLDR)
has also been cross-checked and corrections applied, allow-
Figure 6. The same as Fig. 5, but for the vertical particle linear ing an accurate retrieval. The aim of this work was fo-
depolarization ratio (PLDR), δp , as retrieved from each βp [FOVP ] cused on determining the lidar-specific true OVP function
as shown in Fig. 5 and the VLDR, δ V (grey line). The corresponding and on investigating the accuracy of both the retrieved par-
Polly-retrieved δp profile is also included (green line). For clarity, ticle backscatter coefficient (PBC) and particle linear depo-
av ] (black) and δ Polly larization ratio (PLDR) profiles.
error bars are only marked for δp [FOVP p (green).
It has been highlighted that the OVP function as delivered
by the P-MPL manufacturer cannot be used long. The rea-
sults show that βp profiles are in a better agreement using sons are manifold, but a suitable estimation of the OVP func-
av as compared to the Polly-derived β at ranges from
FOVP tion should be recommended for the MPL system. The ex-
p
av ] errors of
around 1 km down (see Fig. 5). Relative βp [FOVP perimental procedure to determine the OVP function for the
10 %–20 % are obtained. P-MPL system has been described on the basis of the com-
By examining the PLDR profiles, the dust signature is also parison to reference lidars. The optimal OVP function for
clearly marked between around 3.5 and 5.0 km height, i.e. correcting the P-MPL measurements has been obtained, to-
typical δp values for dust of around 0.3 are found (see Ta- gether with its uncertainties, under clean observational con-
ble 3), indicating a predominance of coarse particles. No dif- ditions from simultaneous P-MPL and Polly/MARTHA ob-
ferences are found between Polly and P-MPL PLDR pro- servations and compared with the original one as provided by
files for that layer (see Fig. 6), with mean δp values of the manufacturer. In addition, depending on the OVP func-
0.33 ± 0.01 (Polly) and 0.32–0.34 ± 0.02 (P-MPL, depend- tion applied, the OVP correction-induced effects on the re-
ing on the FOVP applied and the LR used) (see Table 3). trieval of both the PBC and PLDR for the P-MPL system
have been analysed for two KF solutions using either the
elastic (AOD-constrained) or the Raman-provided lidar ra-
tios in comparison with the PBC and PLDR retrievals as ob-
tained from simultaneous Polly observations. A dust case ob-
served at Leipzig is analysed for that purpose. Additionally,
https://doi.org/10.5194/amt-14-5225-2021 Atmos. Meas. Tech., 14, 5225–5239, 20215234 C. Córdoba-Jabonero et al.: Experimental assessment of a micro-pulse lidar despite the fact that VLDR is OVP-unaffected, it has also been examined in comparison with the Polly VLDR regard- ing its effect in the PLDR determination. A suitable VLDR profile was obtained and only needed to be corrected by a small offset value, which has also been estimated. Once P- MPL measurements were optimally OVP-corrected and the VLDR adjusted, both the PBC and PLDR profiles were ac- curately derived using the KF solution. Overall, as a systematic requirement for lidar systems, an adequate OVP function determination, and a VLDR testing analysis needs to be performed on a regular basis in order to correct the P-MPL measurements and, hence, to derive suitable aerosol products (backscatter, depolarization, extinc- tion). The procedure described in this study could be use- ful in similar P-MPL systems that cannot regularly apply the established MPLNET calibrations. Moreover, such effort should be addressed with the purpose of combining all ex- isting networks in Europe (EARLINET), Asia (AD-NET), Latin America (LALINET), and also MPLNET within the future vision of GAW (Global Atmospheric Watch) Aerosol LIdar Observations Network (GALION). Atmos. Meas. Tech., 14, 5225–5239, 2021 https://doi.org/10.5194/amt-14-5225-2021
C. Córdoba-Jabonero et al.: Experimental assessment of a micro-pulse lidar                                               5235

                                                                                                                     Polly
Appendix A                                                         In this work, the averaged function between FOVP and
                                                                  MARTHA is also calculated, i.e.
                                                                 FOVP
                                          ref (z), is ob-
The experimental overlap (OVP) function, FOVP
tained from the expression                                                 Polly   MARTHA
                                                                  av      FOVP + FOVP
                                                                 FOVP =                   ,                                  (A4)
  ref
                     .                                                           2
FOVP  (z) = P MPL (z) P ref (z) ,                    (A1)
                                                                                                             av , is estimated
                                                                 where the error related to this function, 1FOVP
where P MPL (z) are the P-MPL RCS profiles, which are com-       as
pared against the reference lidar measurements, P ref (z) (ref             v
                                                                           u 1F Polly 2              MARTHA 2
                                                                           u             !                   !
denotes either Polly or MARTHA), using the experimental             av              OVP           1F OVP
approach described in this work.                                 1FOVP  =  t                 +                 ,          (A5)
                                                                                    2                  2
   The error associated with the determination of the OVP
function, 1FOVP , is obtained from error propagation calcu-      where 1FOVPref (ref denotes either Polly or MARTHA) is the
lations of the Eq. (A1). In this sense, it can be expressed as   error obtained from Eq. (A2).
(z dependence is hereafter omitted for simplicity)

                      1P MPL 1P ref

     ref     ref
1FOVP    = FOVP  ×            +           ,              (A2)
                       P MPL      P ref

where 1P MPL and 1P ref are, respectively, the errors related
to P MPL and P ref .
   1P MPL can be estimated as being composed of two error
contributions: one associated with instrumental corrections
(energy fluctuations, instrumental calibrations, solar back-
ground, etc.), ε MPL , as described in Welton and Campbell
(2002), and another one reflecting the atmospheric variabil-
ity within the time averaging performed by the P MPL pro-
files, which is expressed by the standard deviation, SDMPL ;
hence, it can be obtained from the expression
            q
                     2           2
1P MPL = ε MPL + SDMPL .                                (A3)

Errors associated with the reference lidar measurements,
1P ref (ref is for either Polly or MARTHA), are represented
by the standard deviation, as obtained from the correspond-
ing time averaging of P ref profiles.

https://doi.org/10.5194/amt-14-5225-2021                                           Atmos. Meas. Tech., 14, 5225–5239, 2021
5236 C. Córdoba-Jabonero et al.: Experimental assessment of a micro-pulse lidar
Data availability. All data generated and analysed for this study are aerosol/cloud database based on CALIPSO and EARLINET, At-
available from the authors upon reasonable request. mos. Chem. Phys., 15, 7127–7153, https://doi.org/10.5194/acp-
15-7127-2015, 2015.
Ansmann, A., Tesche, M., Seifert, P., Groß, S., Freudenthaler,
Author contributions. CCJ and AA designed the study and wrote V., Apituley, A., Wilson, K. M., Serikov, I., Linné, H.,
the original draft of the manuscript. CCJ, AA, CJ, and HB provided Heinold, B., Hiebsch, A., Schnell, F., Schmidt, J., Mattis,
data. CCJ and CJ performed data analysis with contributions from I., Wandinger, U., and Wiegner, M.: Ash and fine-mode
AA, HB, MALC, and RE. All authors reviewed and edited the final particle mass profiles from EARLINET-AERONET observa-
version of the manuscript. All authors agreed on the final version of tions over central Europe after the eruptions of the Eyjaf-
the manuscript. jallajökull volcano in 2010, J. Geophys. Res., 116, D00U02,
https://doi.org/10.1029/2010JD015567, 2011.
Baars, H., Kanitz, T., Engelmann, R., Althausen, D., Heese,
Competing interests. The authors declare that they have no conflict B., Komppula, M., Preißler, J., Tesche, M., Ansmann, A.,
of interest. Wandinger, U., Lim, J.-H., Ahn, J. Y., Stachlewska, I. S.,
Amiridis, V., Marinou, E., Seifert, P., Hofer, J., Skupin, A.,
Schneider, F., Bohlmann, S., Foth, A., Bley, S., Pfüller, A., Gian-
nakaki, E., Lihavainen, H., Viisanen, Y., Hooda, R. K., Pereira,
Disclaimer. Publisher’s note: Copernicus Publications remains
S. N., Bortoli, D., Wagner, F., Mattis, I., Janicka, L., Markowicz,
neutral with regard to jurisdictional claims in published maps and
K. M., Achtert, P., Artaxo, P., Pauliquevis, T., Souza, R. A. F.,
institutional affiliations.
Sharma, V. P., van Zyl, P. G., Beukes, J. P., Sun, J., Rohwer, E.
G., Deng, R., Mamouri, R.-E., and Zamorano, F.: An overview of
the first decade of PollyNET: an emerging network of automated
Acknowledgements. This work was supported by the Spanish Min- Raman-polarization lidars for continuous aerosol profiling, At-
istry of Science, Innovation and Universities (MCIU) under grants mos. Chem. Phys., 16, 5111–5137, https://doi.org/10.5194/acp-
PRX18/00137 (Programa “Salvador de Madariaga”) and CGL2017- 16-5111-2016, 2016.
90884-REDT (ACTRIS-Spain), the Spanish Ministry of Science Baars, H., Ansmann, A., Ohneiser, K., Haarig, M., Engelmann, R.,
and Innovation (MICINN) (grant PID2019-104205GB-C21), and Althausen, D., Hanssen, I., Gausa, M., Pietruczuk, A., Szkop,
the H2020 programme from the European Union (ACTRIS, GA n. A., Stachlewska, I. S., Wang, D., Reichardt, J., Skupin, A., Mat-
871115). María-Ángeles López-Cayuela is supported by the INTA tis, I., Trickl, T., Vogelmann, H., Navas-Guzmán, F., Haefele,
predoctoral contract programme. We thank MPLNET for its sup- A., Acheson, K., Ruth, A. A., Tatarov, B., Müller, D., Hu, Q.,
port even though this study was not part of MPLNET activities. The Podvin, T., Goloub, P., Veselovskii, I., Pietras, C., Haeffelin, M.,
MPLNET project is funded by the NASA Radiation Sciences Pro- Fréville, P., Sicard, M., Comerón, A., Fernández García, A. J.,
gram and Earth Observing System. Molero Menéndez, F., Córdoba-Jabonero, C., Guerrero-Rascado,
J. L., Alados-Arboledas, L., Bortoli, D., Costa, M. J., Dion-
isi, D., Liberti, G. L., Wang, X., Sannino, A., Papagiannopou-
Financial support. This research has been supported by the los, N., Boselli, A., Mona, L., D’Amico, G., Romano, S., Per-
Ministerio de Ciencia, Innovación y Universidades (grant nos. rone, M. R., Belegante, L., Nicolae, D., Grigorov, I., Gialitaki,
PRX18/00137 and CGL2017-90884-REDT), the Ministerio de A., Amiridis, V., Soupiona, O., Papayannis, A., Mamouri, R.-E.,
Ciencia e Innovación (grant no. PID2019-104205GB-C21), and the Nisantzi, A., Heese, B., Hofer, J., Schechner, Y. Y., Wandinger,
H2020 European Research Council (grant no. 871115). U., and Pappalardo, G.: The unprecedented 2017–2018 strato-
spheric smoke event: decay phase and aerosol properties ob-
served with the EARLINET, Atmos. Chem. Phys., 19, 15183–
Review statement. This paper was edited by Daniel Perez-Ramirez 15198, https://doi.org/10.5194/acp-19-15183-2019, 2019.
and reviewed by three anonymous referees. Barbosa, H. M. J., Lopes, F. J. S., Silva, A., Nisperuza, D., Barja,
B., Ristori, P., Gouveia, D. A., Jimenez, C., Montilla, E., Mar-
iano, G. L., Landulfo, E., Bastidas, A., and Quel, E. J.: The
first ALINE measurements and intercomparison exercise on li-
References dar inversion algorithms, Óptica Pura Y Aplicada, 47, 99–108,
https://doi.org/10.7149/OPA.47.2.99, 2014.
Althausen, D., Engelmann, R., Baars, H., Heese, B., Ansmann, Behrendt, A. and Nakamura, T.: Calculation of the cali-
A., Müller, D., and Komppula, M.: Portable Raman Lidar Pol- bration constant of polarization lidar and its dependency
lyXT for Automated Profiling of Aerosol Backscatter, Extinc- on atmospheric temperature, Opt. Express, 10, 805–817,
tion, and Depolarization, J. Atmos. Ocean. Tech., 26, 2366–2378, https://doi.org/10.1364/OE.10.000805, 2002.
https://doi.org/10.1175/2009JTECHA1304.1, 2009. Belegante, L., Bravo-Aranda, J. A., Freudenthaler, V., Nicolae, D.,
Amiridis, V., Marinou, E., Tsekeri, A., Wandinger, U., Schwarz, A., Nemuc, A., Ene, D., Alados-Arboledas, L., Amodeo, A., Pap-
Giannakaki, E., Mamouri, R., Kokkalis, P., Binietoglou, I., Solo- palardo, G., D’Amico, G., Amato, F., Engelmann, R., Baars, H.,
mos, S., Herekakis, T., Kazadzis, S., Gerasopoulos, E., Proes- Wandinger, U., Papayannis, A., Kokkalis, P., and Pereira, S. N.:
takis, E., Kottas, M., Balis, D., Papayannis, A., Kontoes, C., Experimental techniques for the calibration of lidar depolariza-
Kourtidis, K., Papagiannopoulos, N., Mona, L., Pappalardo, G.,
Le Rille, O., and Ansmann, A.: LIVAS: a 3-D multi-wavelength
Atmos. Meas. Tech., 14, 5225–5239, 2021 https://doi.org/10.5194/amt-14-5225-2021C. Córdoba-Jabonero et al.: Experimental assessment of a micro-pulse lidar 5237 tion channels in EARLINET, Atmos. Meas. Tech., 11, 1119– son analysis between ground-based Micro Pulse Lidar and space- 1141, https://doi.org/10.5194/amt-11-1119-2018, 2018. borne CALIOP observations, Atmos. Meas. Tech., 6, 703–717, Berkoff, T. A., Welton, E. J., Campbell, J.R., Scott, V.S., https://doi.org/10.5194/amt-6-703-2013, 2013. and Spinhirne, J. D.: Investigation of Overlap Correction Córdoba-Jabonero, C., Andrey-Andrés, J., Gómez, L., Adame, J. Techniques for the Micro-Pulse Lidar NETwork (MPLNET), A., Sorribas, M., Navarro-Comas, M., Puentedura, O., Cuevas, 2003 IEEE International Geoscience and Remote Sensing E., and Gil-Ojeda, M.: Vertical mass impact and features of Sa- Symposium (2003 IGARSS). Proceedings (IEEE Cat. No. haran dust intrusions derived from ground-based remote sensing 03CH37477), Toulouse, France, 21–25 July 2003, 4395–4397, in synergy with airborne in-situ measurements, Atmos. Environ., https://doi.org/10.1109/IGARSS.2003.1295527, 2003. 142, 420–429, https://doi.org/10.1016/j.atmosenv.2016.08.003, Böckmann, C., Wandinger, U., Ansmann, A., Bösenberg, J., 2016. Amiridis, V., Boselli, A., Delaval, A., Tomasi, F. D., Frioud, M., Córdoba-Jabonero, C., Lopes, F. J. S., Landulfo, E., Cuevas, E., Grigorov, I. V., Hågård, A., Horvat, M., Iarlori, M., Komguem, Ochoa, H., and Gil-Ojeda, M.: Diversity on subtropical and po- L., Kreipl, S., Larchevêque, G., Matthias, V., Papayannis, A., lar cirrus clouds properties as derived from both ground-based Pappalardo, G., Rocadenbosch, F., Rodrigues, J. A., Schnei- lidars and CALIPSO/CALIOP measurements, Atmos. Res., 183, der, J., Shcherbakov, V., and Wiegner, M.: Aerosol lidar in- 151–165, https://doi.org/10.1016/j.atmosres.2016.08.015, 2017. tercomparison in the framework of the EARLINET project. Córdoba-Jabonero, C., Sicard, M., Ansmann, A., del Águila, 2. Aerosol backscatter algorithms, Appl. Optics, 43, 977–989, A., and Baars, H.: Separation of the optical and mass fea- https://doi.org/10.1364/AO.43.000977, 2004. tures of particle components in different aerosol mixtures Bohlmann, S., Shang, X., Giannakaki, E., Filioglou, M., Saarto, by using POLIPHON retrievals in synergy with continuous A., Romakkaniemi, S., and Komppula, M.: Detection and char- polarized Micro-Pulse Lidar (P-MPL) measurements, Atmos. acterization of birch pollen in the atmosphere using a mul- Meas. Tech., 11, 4775–4795, https://doi.org/10.5194/amt-11- tiwavelength Raman polarization lidar and Hirst-type pollen 4775-2018, 2018. sampler in Finland, Atmos. Chem. Phys., 19, 14559–14569, Córdoba-Jabonero, C., Sicard, M., del Águila, A., Jiménez, M., https://doi.org/10.5194/acp-19-14559-2019, 2019. and Zorzano, M.-P.: Performance of a dust model to predict the Burton, S. P., Ferrare, R. A., Hostetler, C. A., Hair, J. W., Rogers, R. vertical mass concentration of an extreme Saharan dust event R., Obland, M. D., Butler, C. F., Cook, A. L., Harper, D. B., and in the Iberian Peninsula: Comparison with continuous, elas- Froyd, K. D.: Aerosol classification using airborne High Spectral tic, polarization-sensitive lidars, Atmos. Environ., 214, 116828, Resolution Lidar measurements – methodology and examples, https://doi.org/10.1016/j.atmosenv.2019.116828, 2019. Atmos. Meas. Tech., 5, 73–98, https://doi.org/10.5194/amt-5-73- Córdoba-Jabonero, C., Gómez-Martín, L., del Águila, A., Vi- 2012, 2012. laplana, J. M., López-Cayuela, M. A., and Zorzano, M.- Burton, S. P., Vaughan, M. A., Ferrare, R. A., and Hostetler, C. P.: Cirrus-induced shortwave radiative effects depending on A.: Separating mixtures of aerosol types in airborne High Spec- their optical and physical properties: Case studies using tral Resolution Lidar data, Atmos. Meas. Tech., 7, 419–436, simulations and measurements, Atmos. Res., 246, 105095, https://doi.org/10.5194/amt-7-419-2014, 2014. https://doi.org/10.1016/j.atmosres.2020.105095, 2020. Campbell, J. R. and Sassen, K.: Polar stratospheric clouds at the Córdoba-Jabonero, C., Sicard, M., López-Cayuela, M.-Á., Ans- South Pole from 5 years of continuous lidar data: Macrophysical, mann, A., Comerón, A., Zorzano, M.-P., Rodríguez-Gómez, optical, and thermodynamic properties, J. Geophys. Res., 113, A., and Muñoz-Porcar, C.: Aerosol radiative impact during D20204, https://doi.org/10.1029/2007JD009680, 2008. the summer 2019 heatwave produced partly by an inter- Campbell, J. R., Hlavka, D. L., Welton, E. J., Flynn, C. continental Saharan dust outbreak – Part 1: Short-wave dust J., Turner, D. D., Spinhirne, J. D., Scott, V. S., and direct radiative effect, Atmos. Chem. Phys., 21, 6455–6479, Hwang, I. H.: Full-Time, Eye-Safe Cloud and Aerosol https://doi.org/10.5194/acp-21-6455-2021, 2021. Lidar Observation at Atmospheric Radiation Measurement Engelmann, R., Kanitz, T., Baars, H., Heese, B., Althausen, D., Program Sites: Instruments and Data Processing, J. At- Skupin, A., Wandinger, U., Komppula, M., Stachlewska, I. S., mos. Ocean. Tech., 19, 431–442, https://doi.org/10.1175/1520- Amiridis, V., Marinou, E., Mattis, I., Linné, H., and Ansmann, 0426(2002)0192.0.CO;2, 2002. A.: The automated multiwavelength Raman polarization and Campbell, J. R., Lolli, S., Lewis, J. R., Gu, Y., and Wel- water-vapor lidar PollyXT : the neXT generation, Atmos. Meas. ton, E. J.: Daytime Cirrus Cloud Top-of-Atmosphere Ra- Tech., 9, 1767–1784, https://doi.org/10.5194/amt-9-1767-2016, diative Forcing Properties at a Midlatitude Site and their 2016. Global Consequence, J. Appl. Meteorol. Clim., 5, 1667–1679, Fernald, F. G.: Analysis of atmospheric lidar observa- https://doi.org/10.1175/JAMC-D-15-0217.1, 2016. tions: some comments, Appl. Optics, 23, 652–653, Campbell, J. R., Dolinar, E. K., Lolli, S., Fochesatto, G. J., Gu, https://doi.org/10.1364/AO.23.000652, 1984. Y., Lewis, J. R., Marquis, J. W., McHardy, T. M., Ryglicki, R. Flynn, C. J., Mendoza, A., Zheng, Y., and Mathur, S.: R., and Welton, E. J.: Cirrus cloud top-of-the-atmosphere net Novel polarization-sensitive micropulse lidar mea- daytime forcing in the Alaskan subarctic from ground-based surement technique, Opt. Express, 15, 2785–2790, MPLNET monitoring, J. Appl. Meteorol. Clim., 60, 51–63, https://doi.org/10.1364/OE.15.002785, 2007. https://doi.org/10.1175/JAMC-D-20-0077.1, 2021. Freudenthaler, V.: The telecover test: A quality assurance tool Córdoba-Jabonero, C., Guerrero-Rascado, J. L., Toledo, D., Par- for the optical part of a lidar system, in: 24th International rondo, M., Yela, M., Gil, M., and Ochoa, H. A.: Depolarization Laser Radar Conference, 23–27 June 2008, Boulder, Colorado, ratio of polar stratospheric clouds in coastal Antarctica: compari- https://doi.org/10.5282/ubm/epub.12958, 2008. https://doi.org/10.5194/amt-14-5225-2021 Atmos. Meas. Tech., 14, 5225–5239, 2021
You can also read