Interactions between human milk oligosaccharides, microbiota and immune factors in milk of women with and without mastitis
←
→
Page content transcription
If your browser does not render page correctly, please read the page content below
www.nature.com/scientificreports
OPEN Interactions between human
milk oligosaccharides,
microbiota and immune
factors in milk of women
with and without mastitis
Irma Castro1, Cristina García‑Carral1,2, Annalee Furst3, Sadaf Khwajazada3, Janneiry García3,
Rebeca Arroyo1, Lorena Ruiz4, Juan M. Rodríguez1, Lars Bode3* & Leónides Fernández5*
Lactational mastitis is an excellent target to study possible interactions between HMOs, immune
factors and milk microbiota due to the infectious and inflammatory nature of this condition. In this
work, microbiological, immunological and HMO profiles of milk samples from women with (MW) or
without (HW) mastitis were compared. Secretor status in women (based on HMO profile) was not
associated to mastitis. DFLNH, LNFP II and LSTb concentrations in milk were higher in samples from
HW than from MW among Secretor women. Milk from HW was characterized by a low bacterial load
(dominated by Staphylococcus epidermidis and streptococci), high prevalence of IL10 and IL13, and
low sialylated HMO concentration. In contrast, high levels of staphylococci, streptococci, IFNγ and
IL12 characterized milk from MW. A comparison between subacute (SAM) and acute (AM) mastitis
cases revealed differences related to the etiological agent (S. epidermidis in SAM; Staphylococcus
aureus in AM), milk immunological profile (high content of IL10 and IL13 in SAM and IL2 in AM) and
milk HMOs profile (high content of 3FL in SAM and of LNT, LNnT, and LSTc in AM). These results
suggest that microbiological, immunological and HMOs profiles of milk are related to mammary
health of women.
Human milk is a complex, non-imitable food and is unanimously considered as the best infant feeding option1.
In addition to its nutritional value, it contains a plethora of bioactive components contributing to infant growth,
tissue repair, protection, immune maturation, neurodevelopment, regulation of metabolism, angiogenesis, devel-
opment of microbial communities, and many others2,3. At present, an increasing quantity of human milk oligo-
saccharides (HMOs), cytokines, chemokines, growth factors, bacterial species and bacterial metabolites have
been identified in human milk, and their multiple functions have been d escribed4–7. Although most studies have
addressed the potential roles of individual HMOs, immune factors and bacterial strains in vitro or animal models,
they are present as a diverse and interacting mix in human milk8,9. Consequently, combinations of methodologies
are required to decipher their individual and collective impact on health.
While studies on human milk bioactive compounds have been focused on their impact in infant health, they
too are relevant for mother’s health. Lactational mastitis is one of the most common problems that compro-
mise breastfeeding10. Mastitis is not a uniform condition since it can be present as acute, subacute or chronic
processes11–13. As a consequence, the etiological agents, the course, the symptoms and their severity may vary
depending on the c ases11,13. Because of the inflammatory and infectious nature of the condition, mastitis con-
stitutes an excellent target to study potential interactions among HMOs, soluble immune factors and the milk
microbiota. In this context, the objectives of this work were, first, to describe the differences in microbiological,
immunological and HMO profiles between milk samples from healthy women and from women with mastitis,
1
Departament of Nutrition and Food Science, Complutense University of Madrid, Madrid, Spain. 2Probisearch S.L.,
Tres Cantos, Spain. 3Department of Pediatrics and Larsson‑Rosenquist Foundation Mother‑Milk‑Infant Center
of Research Excellence, University of California San Diego, La Jolla, CA, USA. 4Department of Microbiology and
Biochemistry of Dairy Products, Institute of Dairy Products of Asturias, IPLA-CSIC, Villaviciosa, Spain. 5Department
of Galenic Pharmacy and Food Technology, Complutense University of Madrid, Madrid, Spain. *email: lbode@
health.ucsd.edu; leonides@vet.ucm.es
Scientific Reports | (2022) 12:1367 | https://doi.org/10.1038/s41598-022-05250-7 1
Vol.:(0123456789)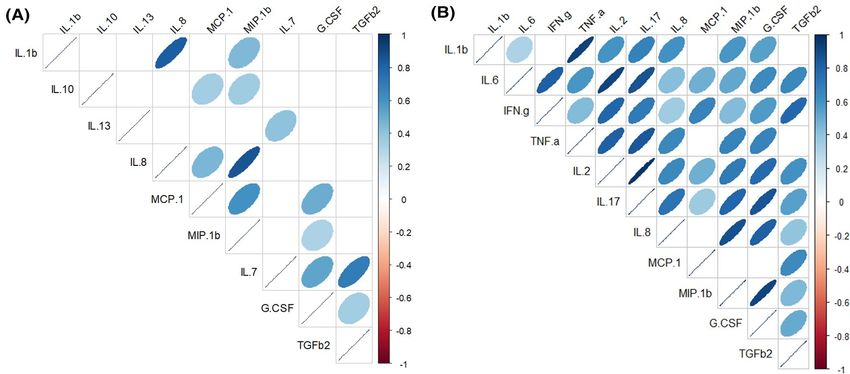
www.nature.com/scientificreports/
Mastitis n (%) Healthy n (%) Odds ratio (95% confidence interval)
Secretor 58 (65) 31 (35)
1.70 (0.65–4.45)
Non secretor 11 (52) 10 (48)
AM n (%) SAM n (%) Odds ratio (95% confidence interval)
Secretor 31 (69) 27 (31)
3.06 (0.73–12.71)
Non secretor 8 (73) 3 (27)
Table 1. Incidence of mastitis and type of mastitis (acute [AM] or subacute [SAM]) among participant
women according to the Secretor status.
and second, to explore possible associations between microbiota, immune compounds and HMO profile in milk
samples from cases of acute and subacute mastitis.
Results
Comparison of the HMOs profiles in the milk samples from the HW and MW groups. HMO
profiles of milk samples from women with mastitis (MW; n = 69) and healthy women (HW; n = 41) are shown in
Supplementary Fig. 1. A total of 19 individual HMOs were found in all samples but in different concentrations
(Supplementary Fig. 1). In a distinct group of women classified as Secretor (n = 89, 81%), 2′-fucosyllactose (2′FL)
was the predominant HMO with a median [IQR] value of 6444.10 [4820.80–7929.50] nmol/mL, meanwhile
in non-Secretor women (n = 21, 19%), the highest concentrations corresponded to 3-fucosyllactose (3FL) and
lacto-N-fucopentaose II (LNFP II). The odds ratio (OR) of the occurrence of mastitis in Secretor women was
1.70 compared to non-Secretor women, but this association was not statistically significant as indicated by the
95% CI of the OR (Table 1).
When comparing MW and HW within the Secretor status, differences in the concentrations of several HMOs
were observed (Table 2). The concentrations of DFLNH, LNFP II and LSTb were significantly higher (Wilcoxon
sum rank tests; p < 0.024) in samples from the HW group, while the content of DSLNT, LNFP I, LNFP III, LNH,
LSTc, and 6’SL was higher in samples from the MW group (Wilcoxon rank sum tests; p < 0.034). Overall, samples
from Secretor MW had about double the concentration of the sialylated, Type 2 (LNnT + LNFP III + LSTc) and
α-2,6 (LSTc + 6′SL) HMOs when compared with samples from Secretor samples from HW participants (Sup-
plementary Table 1). Among non-Secretor women, no differences were observed in the concentration of HMOs
according to the breast health status (Table 2, Supplementary Table 1).
Both strong positive and negative correlations, which globally were highly similar in samples from HW and
MW groups, were found among the concentrations of some individual HMOs (Fig. 1). In the HW group, the
strongest positive correlations were found between 6′SL and LSTc, FLNH, and FDSLNH and between 3FL and
LNFP II (Spearman’s ρ > 0.75; p = 0.000), while the strongest negative correlations were established between 2’FL
and LNFP II and 3FL (Spearman’s ρ ≥ ‒0.72; p = 0.000). The intensity of these correlations was lower in samples
from the MW group, where the strongest correlations were noted between LSTc and LNFP III (Spearman’s
ρ = 0.72; p = 0.000) and 2’FL and LNFP II (Spearman’s ρ = ‒0.72; p = 0.000) (Fig. 1).
Comparison of the microbiological profile of milk samples from the HW and MW groups. Milk
cultures were performed on all the milk samples (n = 110) and bacterial growth was observed in 106 (97%) sam-
ples (Table 3). In contrast, yeasts could only be detected in less than 10% of the samples in both groups. The 4
samples where bacterial growth was not detected had been collected from the HW group. The total bacterial
counts in the samples where growth was observed from the HW group (n = 37) ranged from 1 to 5.89 l og10 CFU/
mL of milk and the median (IQR) value was 2.67 (1.60–3.18) log10 CFU/mL. In contrast, microbial counts in the
samples from the MW group (n = 69) ranged from 4.69 to 6.19 log10 CFU/mL and had a median (IQR) value of
5.31 (5.03–5.53) log10 CFU/mL. Therefore, the microbial counts in the MW group samples were more than 100-
fold higher than in the HW group samples (Wilcoxon rank sum test; p = 0.000) (Table 3).
Staphylococcus epidermidis was the most frequently isolated species in both groups of samples being detected
in 95% of samples from the HW group and in 85% of the samples from the MW group (Table 3). However, a
large difference was observed in the levels recorded in both groups. S. epidermidis median (IQR) count was 2.50
(1.74–2.81) log10 CFU/mL in samples from the HW group but it was double (5.00 [4.52–5.30] log10 CFU/mL)
in samples from the MW group. Staphylococcus aureus was the second species more frequently isolated (52%)
and more abundant (median [IQR] count of 4.87 [3.84–5.30] log10 CFU/mL) in the MW group (Table 3). Dif-
ferences were found both in S. aureus prevalence (χ2 test; p = 0.000) and colony counts (Wilcoxon rank sum test;
p = 0.007) between samples from HW and MW groups. Streptococcus mitis/oralis (the MALDI-TOF technique
does not allow the differentiation between these two closely related species) and Streptococcus salivarius were
also detected in significantly higher colony counts in samples from the MW group than in those from the HW
group (Wilcoxon rank sum tests; p < 0.005), but their prevalences were similar in both groups (Table 3). Other
bacterial species and taxonomic groups were found in both groups (HW and MW) of samples except for “Other
Actinobacteria (Actinomyces, Bifidobacterium, Cutibacterium and Kocuria)” and “Not identified” groups that
were detected only in samples from the HW group (Table 3). On the other hand, colony counts of other bacterial
species and groups, including other staphylococci, other streptococci, other Firmicutes, Rothia mucilaginosa and
Corynebacterium sp., were higher in the MW group samples than in the HW group samples (Table 3).
Scientific Reports | (2022) 12:1367 | https://doi.org/10.1038/s41598-022-05250-7 2
Vol:.(1234567890)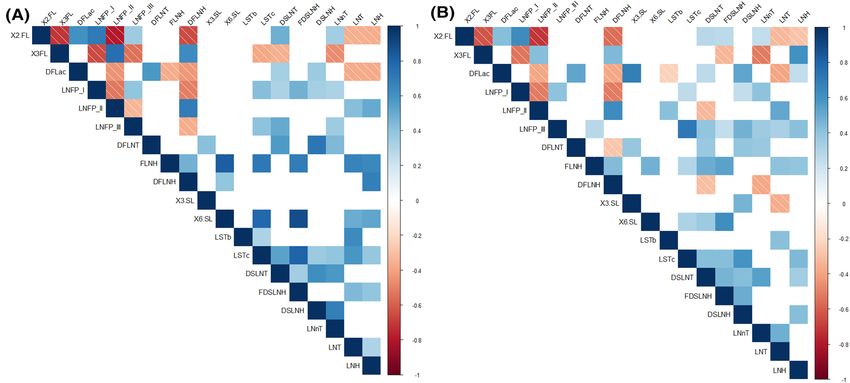
www.nature.com/scientificreports/
Non-secretor Secretor
HW (n = 10) MW (n = 11) HW (n = 31) MW (n = 62)
Median (IQR) or Median (IQR) or Median (IQR) or Median (IQR) or
HMO Mean [95% CI] Mean [95% CI] p- valuea Mean [95% CI] Mean [95% CI] p-valuea
Fucosylated
2′FL 5.05 (2.35–9.35) 16.10 (9.60–34.10) 0.605 6100.98 [649.12] 6576.35 [657.18] 0.757
3FL 5853.60 (5123.90–6865.02) 4748.20 (4314.10–5572.10) 0.605 2206.70 (1517.95–3189.50) 1703.95 (1273.95–2774.47) 0.178
DFLac 1.15 (0.45–5.15) 1.20 (0.65–10.95) 0.919 356.60 (272.25–455.10) 364.45 (288.72–513.75) 0.516
LNFP I 217.37 [61.26] 219.74 [66.23] 0.985 894.50 (482.40–1383.45) 1358.85 (809.07–1954.80) 0.034*
LNFP II 2579.35 [648.66] 2352.17 [723.90] 0.769 1175.20 (801.40–1502.80) 763.15 (481.02–974.82) 0.000*
LNFP III 5.65 (4.07–10.82) 6.50 (4.85–14.20) 0.769 12.30 (8.50–17.00) 22.35 (12.52–34.85) 0.000*
DFLNT 609.86 [214.08] 640.08 [251.10] 0.919 1255.62 [221.55] 1119.90 [162.63] 0.960
FLNH 318.50 (152.32–420.75) 242.80 (169.20–269.90) 0.663 206.10 (118.90–327.20) 181.00 (99.90–289.36) 0.516
DFLNH 516.82 [170.13] 385.74 [161.53] 0.663 232.80 (153.10–282.50) 90.55 (44.65–150.12) 0.000*
Sialylated
3′SL 293.55 (278.12–314.45) 226.60 (141.65–315.15) 0.605 347.10 (292.65–482.85) 331.15 (265.50–438.47) 0.516
6′SL 415.80 (250.72–582.27) 0.605 0.152 328.80 (226.40–547.35) 724.75 (444.85–871.77) 0.000*
LSTb 122.15 [38.01] 98.26 [32.59] 0.663 74.90 (55.95–126.85) 57.85 (42.80–85.50) 0.024*
LSTc 57.25 (30.50–75.27) 134.90 (66.60–194.40) 0.605 79.90 (44.05–101.65) 234.25 (90.32–376.02) 0.000*
DSLNT 13.05 (8.40–27.43) 16.00 (7.65–61.00) 0.919 66.10 (49.55–103.80) 156.32 (73.12–246.60) 0.000*
FDSLNH 130.84 [49.22] 147.31 [56.91] 0.769 85.40 (54.70–124.40) 132.30 (70.90–208.52) 0.154
DSLNH 40.90 [11.93] 49.25 [19.06] 0.919 57.10 (38.55–83.55) 62.10 (40.62–97.77) 0.411
Neutral
LNnT 131.20 (97.35–197.77) 140.60 (103.05–180.35) 0.969 324.10 (235.25–391.95) 350.85 (233.60–474.87) 0.411
LNT 2258.69 [841.13] 1595.31 [539.52] 0.605 1293.90 (1013.40–1727.70) 1223.40 (775.97–1540.47) 0.411
LNH 58.84 [24.29] 89.93 [32.05] 0.605 32.80 (20.65–41.60) 53.15 (33.35–90.75) 0.005*
Table 2. Concentration (nmol/mL) of individual HMOs in milk samples according to the Secretor and breast
health status (HW, healthy women; MW, mastitis cases) in women. CI confidence interval, IQR Interquartile
range, DFLac difucosyllactose, DFLNH difucosyllacto-N-hexaose, DFLNT difucosyllacto-N-tetrose, DSLNH
diasilyllacto-N-hexaose, DSLNT diasilyllacto-N-tetraose, FDSLNH fucodisialyllacto-N-hexaose, FLNH
fucosyllacto-N-hexaose, HMO human milk oligosaccharide, LNFP lacto-N-fucopentaose, LNH lacto-N-
hexaose, LNnT lacto-N-neotetraose, LNT lacto-N-tetraose, LSTb sialyl-lacto-N-tetraose b, LSTc sialyl-lacto-N-
tetraose c, 2’FL 2’-fucosyllactose, 3FL 3-fucosyllactose, 3’SL 3’-sialyllactose, 6’SL 6’-sialyllactose. *Statistically
significant difference, p < 0.05. a Wilcoxon rank sum tests or ANOVA tests (depending on the distribution of the
data) were used to determine differences in HMOs concentration between samples from mastitis-suffering or
healthy women from Secretor or non-Secretor status. FDR-adjusted p-values.
Globally, the bacterial counts of the different microbial groups did not differ between the non-Secretor and
Secretor samples of HW and MW groups (Supplementary Table 2). A trend could be observed in the counts of S.
epidermidis and the median total microbial counts, which were about 0.70 log10 CFU/mL higher in non-Secretor
samples from the HW than in samples from the Secretor HW group (Supplementary Table 2). No differences
in microbiological counts were found in the set of samples from the MW group (Supplementary Table 2). The
comparison of the prevalence of individual bacterial species or groups according to the Secretor and breast
health status of the women indicated that there was no association between both factors (Fisher tests; p > 0.05)
(Supplementary Table 2).
Comparison of the immunological profile of milk samples from the HW and MW groups. The
immunological profile including 18 immune compounds was characterized in 95 samples (41 samples from the
HW group and 54 samples from the MW group) (Table 4). All compounds were detected in, at least, one sample
of the whole set of analysed samples, although at different prevalence and abundance. In particular, notable
variations were registered when comparing samples from the HW and MW groups (Table 4). Regarding innate
immunity compounds, IL1β, IL6, IFNγ and TNFα were detected in more samples in the MW group (in 78%
of the samples) than in the HW group (in 56% of the samples) (χ2 tests; p ≤ 0.000). In addition, the concentra-
tions (expressed as median [IQR]) of IL1β and TNFα were also higher in samples from the MW group (8.10
[1.16–23.41] ng/L for IL1β and 29.02 [12.81–72.70] ng/L for TNFα) than in samples from the HW group (1.10
[0.33–2.20] ng/L for IL1β and 3.15 [2.02–4.52] ng/L for TNFα) (Wilcoxon rank sum tests; p ≤ 0.003). In contrast,
no differences were observed in IL6 and INFγ concentrations between both groups of samples (Table 4).
All compounds related to acquired immunity also occurred at different prevalence in samples from mastitis
and healthy women (Table 4). IL2, IL4 and IL17 were found more frequently in samples from the MW group
than in the HW group, while the opposite was noted for IL10 and IL13 (χ2 tests; p = 0.000). However, similar
concentrations of these compounds related to acquired immunity (IL2, IL4, IL10, and IL17) were found in
Scientific Reports | (2022) 12:1367 | https://doi.org/10.1038/s41598-022-05250-7 3
Vol.:(0123456789)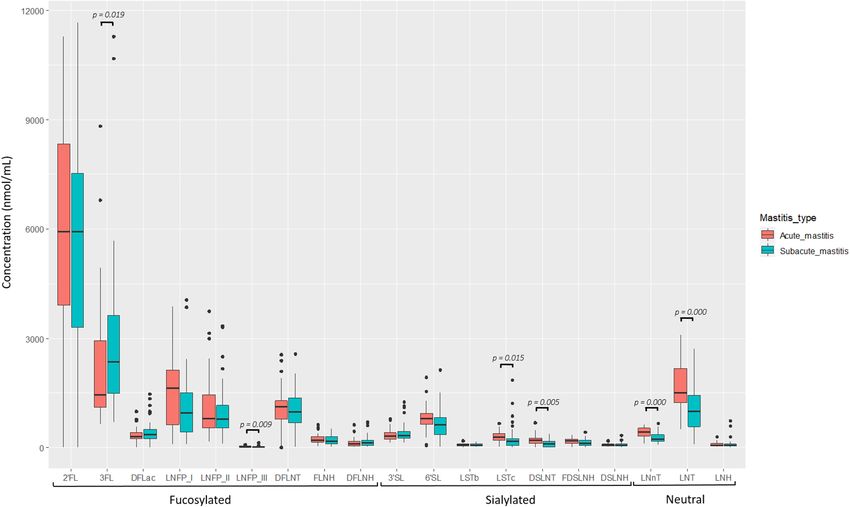
www.nature.com/scientificreports/
Figure 1. Spearman rank correlations between individual HMOs concentrations in milk samples from healthy
women (HW group; A) and mastitis cases (MW group; B) groups. Only statistically significant (p < 0.05)
correlations between individual HMOs that were present in > 50% of the samples in each group are shown .The
strength and colors indicate directionally (blue denotes positive; red denotes negative) of the association. DFLac,
difucosyllactose; DFLNH, difucosyllacto-N-hexaose; DFLNT, difucosyllacto-N-tetrose; DSLNH, diasilyllacto-
N-hexaose; DSLNT, diasilyllacto-N-tetraose; FDSLNH, fucodisialyllacto-N-hexaose; FLNH, fucosyllacto-N-
hexaose; HMO, human milk oligosaccharide; LNFP, lacto-N-fucopentaose; LNH, lacto-N-hexaose; LNnT,
lacto-N-neotetraose; LNT, lacto-N-tetraose; LSTb, sialyl-lacto-N-tetraose b; LSTc, sialyl-lacto-N-tetraose c; 2’FL,
2’-fucosyllactose; 3FL, 3-fucosyllactose; 3’SL, 3’-sialyllactose; 6’SL, 6’-sialyllactose.
HW (n = 37) MW (n = 69)
Microorganism n (%)a Median (IQR)b n (%) Median (IQR) p-valuec p-valued
Firmicutes
Staphylococcus epidermidis 35 (95) 2.50 (1.74–2.81) 59 (85) 5.00 (4.52–5.30) 0.454 0.000*
Staphylococcus aureus 3 (8) 1.30 (1.18–1.70) 39 (52) 4.87 (3.84–5.30) 0.000* 0.007*
Other staphylococcie 5 (13) 2.30 (2.00–2.84) 8 (12) 3.80 (3.02–4.66) 1.000 0.027*
Streptococcus mitis/oralis 9 (24) 1.84 (1.00–2.46) 19 (27) 4.18 (3.42–5.04) 1.000 0.000*
Streptococcus salivarius 4 (11) 1.93 (1.74–2.24) 18 (26) 4.18 (3.70–4.70) 0.300 0.005*
Other streptococcif 13 (35) 1.90 (1.30–2.08) 12 (17) 3.80 (3.02–4.66) 0.315 0.000*
Enterococcus sp. 2 (5) 3.53 (3.23–3.71) 3 (4) 4.18 (4.03–4.76) 1.000 0.433
Other Firmicutesg 7 (19) 2.30 (2.04–3.06) 6 (9) 4.18 (3.84–4.38) 0.454 0.008*
Proteobacteriah 3 (8) 3.60 (3.31–3.73) 5 (7) 2.60 (2.54–5.10) 1.000 0.881
Actinobacteria
Rothia mucilaginosa 4 (11) 1.78 (1.68–1.81) 9 (13) 3.78 (3.44–4.00) 1.000 0.032*
Corynebacterium sp. 5 (13) 1.00 (1.00–1.30) 9 (13) 3.70 (3.39–4.18) 1.000 0.006*
Other Actinobacteriai 9 (24) 2.36 (1.30–3.00) 0 (0) – 0.000*
Yeast 2 (5) 2.02 (1.76–2.18) 4 (6) 3.14 (2.84–4.15) 1.000 0.157
Not identified 20 (54) 2.41 (2.03–2.94) 0 (0) – *0.000 –
Total CFU 37 (100) 2.67 (1.60–3.18) 69 (100) 5.31 (5.03–5.53) 1.000 *0.000
Table 3. Microbiological counts (log10 CFU/mL) using culture-dependent analysis of milk samples from
healthy women (HW) and mastitis cases (MW) where growth was detected (n = 106). IQR interquartile range,
CFU colony-forming units. *Statistically significant difference, p < 0.05. a n (%): number (percentage) of samples
in which the microorganism was detected (relative frequency of detection). b All data expressed as median
(IQR) log10 CFU/mL (only samples where bacterial growth was detected). c χ2 or Fisher tests (in italics) were
used to determine a possible association between breast health status and individual microorganisms or group
of microorganisms isolated from milk samples. FDR-adjusted p-values. d Wilcoxon rank sum tests were used
to determine if there were differences in microbiological counts between samples from HW and MW groups.
FDR-adjusted p-values. e Other staphylococcal species that were identified include S. hominis, S. lugdunensis,
S. pasteuri and S. warneri. f Other streptococcal species that were identified include S. anginosus, S. gordonii,
S. parasanguinis, S. pneumoniae and S. vestibularis. g Other Firmicutes includes Bacillus, Lactococcus, former
Lactobacillus and Weisella. h Proteobacteria includes Brevundimonas, Enterobacteriaceae, Moraxella, Rhizobium
and Stenotrophomonas. i Other Actinobacteria includes Actinomyces, Bifidobacterium, Cutibacterium, Kocuria
and Propionibacterium.
Scientific Reports | (2022) 12:1367 | https://doi.org/10.1038/s41598-022-05250-7 4
Vol:.(1234567890)www.nature.com/scientificreports/
HW (n = 41) MW (n = 54)
n (%)a Median (IQR) n (%) Median (IQR) p-valueb p-valuec
Innate immunity
IL1β (ng/L) 23 (56) 1.10 (0.33–2.20) 51 (94) 8.10 (1.16–23.41) 0.000* 0.003*
IL6 (ng/L) 17 (41) 12.70 (6.80–18.40) 42 (78) 10.60 (2.42–36.81) 0.000* 0.684
IL12(p70) (ng/L) 6 (14) 0.55 (0.12–0.90) 8 (15) 2.29 (0.76–4.69) 0.796 0.331
IFNγ (ng/L) 1 (2) 4.70 52 (96) 54.43 (11.22–259.87) 0.000* –
TNFα (ng/L) 18 (44) 3.15 (2.02–4.52) 54 (100) 29.02 (12.81–72.70) 0.000* 0.000*
Acquired immunity
IL2 (ng/L) 0 (0) - 38 (70) 6.55 (0.98–18.68) 0.000* –
IL4 (ng/L) 1 (2) 0.70 28 (52) 0.65 (0.26–1.39) 0.000* –
IL10 (ng/L) 33 (80) 3.30 (1.75–4.32) 6 (11) 3.51 (3.29–4.40) 0.000* 0.680
IL13 (ng/L) 33 (80) 2.70 (1.60–3.90) 10 (18) 0.76 (0.35–1.24) 0.000* 0.000*
IL17 (ng/L) 3 (7) 4.30 (3.20–5.40) 31 (57) 18.30 (8.54–51.43) 0.000* 0.227
Chemokines
IL8 (ng/L) 41 (100) 72.10 (32.10–182.30) 54 (100) 270.94 (120.96–1818.12) 1.000 0.000*
MCP1 (ng/L) 32 (78) 156.55 (71.17–283.30) 53 (98) 380.45 (80.27–1040.27) 0.003* 0.012*
MIP1β (ng/L) 39 (95) 30.70 (16.60–68.15) 54 (100) 25.34 (9.75–161.30) 0.092 0.922
Hematopoyetic factors
IL5 (ng/L) 3 (7) 2.60 (1.70–2.70) 15 (28) 33.30 (18.16–59.57) 0.015* 0.019*
IL7 (ng/L) 38 (93) 34.60 (27.27–53.32) 22 (41) 22.41 (11.46–62.17) 0.000* 0.313
GCSF (ng/L) 29 (71) 18.30 (4.90–57.40) 51 (94) 201.40 (51.06–696.52) 0.000* 0.000*
GMCSF (ng/L) 3 (7) 12.90 (6.65–18.35) 19 (35) 4.17 (1.31–5.14) 0.005* 0.398
TGFβ 2 (µg/L) 41 (100) 2.00 (1.10–3.40) 54 (100) 1.34 (0.45–6.25) 1.000 0.471
Table 4. Frequency and concentration of immune factors detected in milk samples from healthy women
(HW) and mastitis cases (MW). GCSF granulocyte colony-stimulating factor, GMCSF granulocyte–
macrophage colony-stimulating factor, INFγ interferon-γ, IL interleukin, MCP1 macrophage-monocyte
chemoattractant protein-1, MIP1β macrophage inflammatory protein-1β, TGFβ2 transforming growth
factor-β2, TNFα tumor necrosis factor-α. *Statistically significant difference, p < 0.05. a n (%): number
(percentage) of samples in which the immunological compound was detected (relative frequency of detection).
b 2
χ or Fisher tests (in italics) were used to determine a possible association between the breast health status
and the immunological compound. FDR-adjusted p-values. c Wilcoxon rank sum tests were used to determine
differences in the concentration detected of each immunological compound between samples from the HW
and MW groups. FDR-adjusted p-values.
samples from both groups, with the exception of IL13. The concentration of IL13 (expressed as median [IQR])
was almost four times higher in the HW group samples than in the MW group samples (2.70 [1.60–3.90] ng/L
and 0.76 [0.35–1.24] ng/L, respectively; Wilcoxon rank sum test; p = 0.000).
Chemokines IL8, MCP1 and MIP1β were detected in a high percentage of samples, although MCP1 was
less frequently detected in samples from the HW group than in those from the MW group (Fisher’s exact test;
p = 0.003) (Table 4). Overall, chemokines were the most abundant immune compounds in milk samples after
TGFβ2. MCP1 and IL8 concentrations were double- and triple-fold higher, respectively, in samples from the
MW group than in samples from the HW group (Wilcoxon rank sum tests; p = 0.012 and p = 0.000, respectively).
Finally, the hematopoietic factor TGFβ2, the most abundant immune factor in milk, was detected in all sam-
ples and at similar content (Table 4). In contrast, IL5 and GCSF were more frequently detected (χ2 tests; p < 0.015)
and their levels were approximately tenfold higher (Wilcoxon rank sum tests; p < 0.019) in samples from the MW
group than in those from the HW group. GMCSF was more prevalent in samples from the MW group, whereas
on the contrary IL7 prevailed in samples from healthy participants (χ2 tests; p < 0.005).
When comparing the prevalence and concentration of this set of immunological compounds among Secre-
tor or non-Secretor women in both groups, there were differences only in the group of healthy women (Sup-
plementary Table 3). The prevalence of IL1β and GCSF and the concentration of IL13 and IL7 were higher in
non-Secretor compared to Secretor women in the HW group (Supplementary Table 3).
Across all samples from the MW group, strong positive correlations were registered between most of the
immunological compounds, especially emphasizing those between IL17 and IL2 (Spearman’s ρ = 0.97), TNFα
and IL1β (Spearman’s ρ = 0.93), IL6 and IL2 (ρ = 0.92), and MIP1β and GCSF (Spearman’s ρ = 0.91) (Fig. 2). On
the contrary, on the set of samples from the HW group, the correlations were weaker and the pairs MIP1β and
IL8 (Spearman’s ρ = 0.85) and IL1β and IL8 (Spearman’s ρ = 0.82) registered the strongest correlations (Fig. 2).
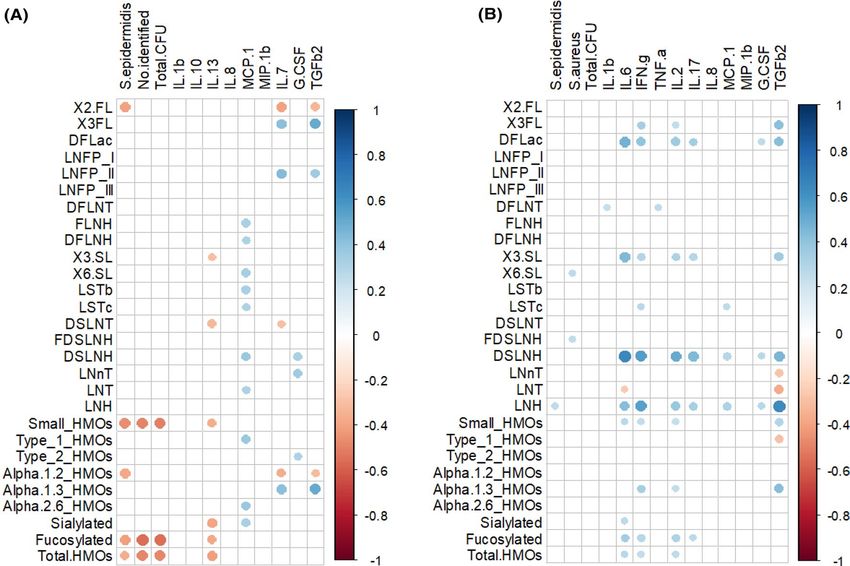
Global comparison of HMO profiles with immunological and microbial profiles in milk samples
from the HW and MW groups. The levels of S. epidermidis and “No identified” microorganisms were
negatively correlated with the concentration of small and fucosylated HMOs (Spearman’s ρ ≥ ‒0.41; p = 0.000)
Scientific Reports | (2022) 12:1367 | https://doi.org/10.1038/s41598-022-05250-7 5
Vol.:(0123456789)www.nature.com/scientificreports/
Figure 2. Spearman rank correlations between immunological compounds concentrations in milk samples
from healthy women (HW group; A) and mastitis cases (MW group; B). Only statistically significant (p < 0.05)
correlations between individual HMOs that were present in > 50% of the samples in each group are shown. The
strength and colors indicate directionally (blue denotes positive; red denotes negative) of the association. G.CSF,
granulocyte colony-stimulating factor; INF.g, interferon-γ; IL, interleukin; MCP.1, macrophage-monocyte
chemoattractant protein-1; MIP1.b, macrophage inflammatory protein-1β; TGFb2, transforming growth
factor-β2; TNF.a, tumor necrosis factor-α.
in samples from the HW group but not in those from the MW group (Fig. 3). On the other hand, in the MW
group, S. aureus was positively correlated to 6’SL and FDSLNH (Spearman’s ρ = 0.25–0.26; p = 0.000) while S.
epidermidis did to LHN (Spearman’s ρ = 0.26; p = 0.000).
In the HW group, the content of two of the most abundant HMOs, 3FL and LNFP II, were positively corre-
lated to the most abundant immune compound in human milk, TFGβ2, and to IL7 (Spearman’s ρ = 0.36—0.50)
(Fig. 3). In contrast, TFGβ2, and IL7 were negatively correlated to 2’FL (Spearman’s ρ = − 0.33 to − 0.41). In this
group of samples, IL13 showed negative correlation with sialylated HMOs (3’SL and DSLNT) while the opposite
was observed for MCP1, which was positively correlated to several HMOs (FLNH, DFLNH, 6’SL, LSTb, LSTc,
DSLNH and, LNT). A different pattern of correlations were noted in samples from the MW group since the
strongest positive correlations were those established between the pairs TFGβ2/LNH and IL6/DSLNH (Spear-
man’s ρ = 0.64). In this group, the strongest negative correlation was between TFGβ2 and LNT and LNnT. Glob-
ally, in samples from the MW group, IL17, IL2, IL6, INFγ and TFGβ2 were positively correlated to some HMOs
including 3FL, DFLac, 3’SL, DSLNH and LNH (Fig. 3).
In order to visualize the global differences in the characteristics of all the samples, a heatmap was performed
taking into account the content of HMOs, immune factors and viable bacteria that were present in at least 20% of
the samples (Supplementary Fig. 2). In accordance with some results that have already been presented above, the
main factor that determines the clustering of the samples was the breast health status (healthy vs. mastitis), and
this clustering is mainly related to the bacterial load and the composition and profile of immunological factors.
Samples from the MW group were characterized by a high load of S. epidermidis, S. aureus, S. salivarius, S. mitis/
oralis and/or other streptococci, a higher concentration of IFNγ and IL2 and a lower content of IL7, IL10 and
IL13. In contrast, the microbial groups “Other Actinobacteria” and “No identified” were only found in samples
from healthy women, usually accompanied by low level of S. epidermidis and different species of streptococci
and an immunological profile almost opposite to samples from the MW group (higher prevalence of IL7, IL10
and IL13) (Fig. 3). However, one of the samples from the MW group was similar to samples from the HW group
according to all the characteristics used for this clustering. The HMO profiles of the milk samples did not seem
to have an important contribution to this clustering as samples with Secretor and non-Secretor status were more
or less equally distributed among healthy and mastitis women (Supplementary Fig. 2).
Comparison of HMO and immunological profiles in milk samples from acute and subacute
mastitis suffering women. In 29 samples out of 69 from mastitis suffering women, which corresponded
to AM cases, S. aureus was detected at a particularly high rate (mean [IQR] = 4.88 [3.85–5.30] log10 CFU/mL)
(Supplementary Fig. 3). In the rest of samples (n = 40), which corresponded to SAM cases, S. aureus was not
detected or detected at a very low concentration (Wilcoxon rank sum test; p = 0.000). In addition, the prevalence
of S. aureus was also higher in samples from AM than in those from SAM cases, as it was present in all samples
from AM cases but only in 25% of samples from SAM cases and at lower concentration (mean [IQR] = 3.06
[2.80–3.42] log10 CFU/mL) (χ2 test; p = 0.000).
There were no more differences between samples from AM and SAM cases in relation to total bacterial counts
or to the levels of other specific bacteria (Supplementary Table 4, Supplementary Fig. 3). There was not association
between the type of mastitis and the Secretor status (OR [95% CI] = 3.06 (0.73–12.71) (Table 1).
Scientific Reports | (2022) 12:1367 | https://doi.org/10.1038/s41598-022-05250-7 6
Vol:.(1234567890)www.nature.com/scientificreports/
Figure 3. Spearman rank correlations between individual and grouped HMOs, microbial counts and
immunological compounds concentrations in milk samples from healthy women (HW group; A) and
mastitis cases (MW group; B). Only statistically significant (p < 0.05) correlations between those individual
or grouped compounds or bacteria that were present in > 50% of the samples in each group are shown. The
strength and colors indicate directionally (blue denotes positive; red denotes negative) of the association.
DFLac, difucosyllactose; DFLNH, difucosyllacto-N-hexaose; DFLNT, difucosyllacto-N-tetrose; DSLNH,
diasilyllacto-N-hexaose; DSLNT, diasilyllacto-N-tetraose; FDSLNH, fucodisialyllacto-N-hexaose; FLNH,
fucosyllacto-N-hexaose; HMO, human milk oligosaccharide; LNFP, lacto-N-fucopentaose; LNH, lacto-N-
hexaose; LNnT, lacto-N-neotetraose; LNT, lacto-N-tetraose; LSTb, sialyl-lacto-N-tetraose b; LSTc, sialyl-lacto-
N-tetraose c; 2’FL, 2’-fucosyllactose; 3FL, 3-fucosyllactose; 3’SL, 3’-sialyllactose; 6’SL, 6’-sialyllactose. Total
HMO-bound sialic acid; total HMO-bound fucose; small HMO; type 1; type 2; α-1,2; α-1,3; and α-2,6 were
calculated as the sum of all sialic acid moieties bound to each HMO; all fucose moieties bound to each HMO;
2’FL + 3FL + 3’SL + 6’SL; LNT + LNFP I + LNFP II + LSTb + DSLNT; LNnT + LNFP III + LSTc; LNFP I + 2’FL;
LNFP III + 3FL; and LSTb + LSTc + 6’SL, respectively. GCSF, granulocyte colony-stimulating factor; INFγ,
interferon-γ; IL, interleukin; MCP1, macrophage-monocyte chemoattractant protein-1; MIP1β, macrophage
inflammatory protein-1β; TGFβ2, transforming growth factor-β2; TNFα, tumor necrosis factor-α.
According to the type of mastitis, AM or SAM, statistically significant differences were observed in the con-
centration of the individual HMOs LNFP III, DSLNT, LNnT and LNT as well as of Type 1 and Type 2 HMOs
(Fig. 4, Supplementary Fig. 4, Supplementary Tables 5, 6). The content of all these HMOs were higher among
samples from AM cases than in samples from SAM cases (Wilcoxon rank sum tests; p ≤ 0.042).
Regarding the immunological profile, IL2 was found in most of the samples from the AM group, whereas IL10
and IL13 were detected more frequently in samples from the SAM group (Supplementary Table 7). Differences
in the concentration were only found for IL5 whose concentration in the samples from the SAM cases was about
five-fold of that found in AM cases (Supplementary Table 7).
Discussion
Breast pain associated to mastitis is a leading cause of breastfeeding discontinuation. Because breastmilk is
considered the optimal infant nutrition, mastitis may deprive infants of its multiple benefits during this critical
development stage. Therefore, mastitis should be considered a relevant public health issue. This study reports
notable differences in the microbiological, immunological, and HMO profiles of milk samples from lactating
mothers with mastitis and healthy controls. In addition, it describes the main microbiological features of milk
samples from AM and SAM cases, and reveals trends in immune and HMO profiles which may be useful to
assess the risk of mastitis.
Recent studies have revealed that mastitis is associated to a dysbiosis state in the mammary gland, which
is characterized by an overrepresentation of staphylococci and a depletion of other bacterial groups, including
lactobacilli and strict a naerobes14–17. The results of this study confirm a drastic change in the microbiological
profile of milk samples from mastitis women. This change was mainly related to an increase in the bacterial
Scientific Reports | (2022) 12:1367 | https://doi.org/10.1038/s41598-022-05250-7 7
Vol.:(0123456789)www.nature.com/scientificreports/
Figure 4. Box-plots showing the concentrations (nmol/mL) of the individual HMOs. The boxes represent
the values of the interquartile ranges, with the median represented as a line. Outliers are represented as dots.
Samples colored in red belong to acute mastitis (AM) cases and those in green to subacute mastitis (SAM) cases.
Wilcoxon rank sum tests or ANOVA tests (depending on the distribution of the data) were used to determine
differences in HMOs concentration between samples from acute or subacute mastitis-suffering women. DFLac,
difucosyllactose; DFLNH, difucosyllacto-N-hexaose; DFLNT, difucosyllacto-N-tetrose; DSLNH, diasilyllacto-
N-hexaose; DSLNT, diasilyllacto-N-tetraose; FDSLNH, fucodisialyllacto-N-hexaose; FLNH, fucosyllacto-N-
hexaose; HMO, human milk oligosaccharide; LNFP, lacto-N-fucopentaose; LNH, lacto-N-hexaose; LNnT,
lacto-N-neotetraose; LNT, lacto-N-tetraose; LSTb, sialyl-lacto-N-tetraose b; LSTc, sialyl-lacto-N-tetraose c; 2’FL,
2’-fucosyllactose; 3FL, 3-fucosyllactose; 3’SL, 3’-sialyllactose; 6’SL, 6’-sialyllactose.
load rather than to the type of bacterial species present in the milk samples, except for S. aureus. This species
had higher prevalence in samples from mastitis-suffering woman (52%) than in healthy controls (8%) and its
load was more than 2.5 times (log10 CFU/mL) higher in MW samples than in samples from healthy women. In
addition, S. aureus was detected in all samples and at higher amount (about 1.7-fold increase in l og10 CFU/mL
of S. aureus counts) from AM cases compared to SAM cases. This role of S. aureus as the main etiological agent
of AM is in agreement with previous studies18,19.
A different pattern was observed for S. epidermidis since, in contrast to S. aureus, this species was detected in
almost all the milk samples from both MW and HW groups, but its prevalence and abundance was much higher
in SAM than in AM cases. S. epidermidis is a commensal inhabitant of skin and mucosal surfaces in healthy indi-
viduals and its presence is a characteristic feature of milk and feces of healthy women and their breastfed infants,
respectively20. Being part of the human microbiota in healthy individuals, S. epidermidis also acts as a common
nosocomial pathogen in certain circumstances and it is frequently involved in human subacute m astitis14,16,18,21.
15,22,23
Streptococci are relevant members of the milk microbiota in healthy women , but, when their levels
increase, they can also cause subacute and subclinical m astitis21. In this study, S. mitis/oralis and S. salivarius
were detected in > 20% of the milk samples, and at higher numbers in samples from mastitis suffering women,
although globally no differences were found neither in prevalence or load between AM and SAM samples. A
detailed analysis of the individual bacterial profile of mastitis samples showed that streptococci were frequently
isolated together with staphylococci, but also they were the predominant bacterial species found in a relatively
low percentage (20%) of samples from SAM cases.
The results show bacterial changes in milk related to mastitis and bacterial differences between AM and SAM
cases. We performed a cultured-based analysis of the milk samples because all the bacterial species involved
in human mastitis grow well under simple and economical culture conditions, a fact that is of paramount rel-
evance for in practice diagnosis in Clinical Microbiology laboratories. In addition, previous metataxonomic
and metagenomic approaches form our group and o thers15,17 have already shown the ample dominance of reads
corresponding to the etiological agents (S. aureus in AM cases and S. epidermidis in the SAM ones) therefore,
there is a high correlation between the main findings using culture-dependent or culture-independent methods.
Culture of milk samples and identification of isolates should be considered as the appropriate method to disclose
the causal agent(s) for the correct etiological diagnosis of mastitis. In addition, it informs appropriate treatment
when taking into account recent descriptions of high antimicrobial resistance among mastitis p athogens18,24.
Scientific Reports | (2022) 12:1367 | https://doi.org/10.1038/s41598-022-05250-7 8
Vol:.(1234567890)www.nature.com/scientificreports/
Human milk contains a wide array of soluble immune factors, which varies according to environmental and
host factors6,25. In this work, notable differences were observed in the prevalence and the concentration of 18
soluble immune factors, reflecting a clear inflammatory response in samples from mastitis cases. IL2, a potent
regulator of the growth and differentiation of lymphocytes T controlling the Th1/Th2 differentiation and the
adaptive immune response against b acteria26, was detected only in samples from the mastitis group.
INFγ, which is the main macrophage-activating cytokine and has fundamental functions in innate immunity
and adaptive cellular immunity against intracellular m icroorganisms27, was present, and at high concentration,
in 96% of samples from mastitis samples. In contrast, no differences were observed in the prevalence and con-
centration of IL12 between samples from healthy and mastitis women. IL12 coordinates, together with INFγ,
the link between pathogen recognition by innate immune cells and the induction of specific immunity28. Other
proinflammatory cytokines (TNFα, IL1β, IL8, and MCP1 with different roles in the host’s immune response to
infection29,30) were detected in practically all samples from mastitis cases and at higher levels (eightfold, seven-
fold, fourfold and twofold increase, respectively) than those from healthy women, in agreement with previous
reports31,32. IL8 deserves special mention because is a potent chemoattractant recruiting immune cells to the
site of inflammation, and it has been proposed as an effective indicator of mastitis both in human and ovine
milk31,33. The fact that IL8 is present in practically all human milk samples analysed in this and other studies on
human milk c ytokines6 together with the substantial increase in its level (about fourfold in its median concen-
tration) linked to mastitis supports its value as mastitis biomarker. However, in this study, IL8 concentration
in milk did not have adequate discriminatory ability for mastitis in women as indicated the constructed ROC
(Receiver Operating Characteristic) curve and the calculated AUC (Area Under the Curve; AUC [95% CI] = 0.747
[0.649–0.845]; Supplementary Fig. 5).
Human milk also contains several anti-inflammatory cytokines, such as IL4, IL10, IL13, and TGFβ23,34. IL10
is one of the most potent anti-inflammatory cytokines, acting on the activated macrophages to terminate the
inflammatory response and return the system to its resting state when the microbial infection has been eradicated.
IL10 not only repress the production of pro-inflammatory cytokines (TNFα, IL1β, IL6) by activated macrophages,
similarly to IL13, but it also regulates the expression of their receptors. In this study, these anti-inflammatory
cytokines were less prevalent and their concentrations (mainly IL10 and IL13) were lower in samples from
mastitis cases than in samples from healthy women in line with the observations of Tuaillon et al.32. However,
the immunological profile of milk samples revealed remarkable differences, mainly related to the components of
the adaptive immune system, depending on the etiological agent of mastitis, with IL10 and IL13 being detected
in the samples from SAM cases but not in those of AM cases. Globally, the lower level of pro-inflammatory
cytokines and the increased content of IL10 registered in milk from SAM cases has been claimed to explain the
subacute nature and persistence of S. epidermidis infection35. S. epidermidis is a common commensal in humans
from very early in life20, but it is also one of the main SAM etiological agents as it has been revealed in this and
previous studies21,24. S. epidermidis biofilm-grown strains induce attenuation in phagocytic function and elicit
production of anti-inflammatory rather than pro-inflammatory cytokines36. In contrast, S. aureus, which is also
both a human commensal and a pathogen and was present at high levels (> 4 log10 CFU/mL) in all AM samples,
displays a diversity of virulence factors that explain the acute course of its i nfection37.
It should be highlighted that mastitis did not modify the levels of TGFβ2, the most abundant cytokine in
milk. TGFβ2 is secreted in a latent state that requires activation at the infant gastrointestinal tract, where it plays
a protective role of the gut mucosa, and develops and maintains appropriate immune responses25,38,39. The stabil-
ity of TGFβ2 levels in mastitis milk samples, would support, at least partially, that mastitis does not constitute a
problem for the lactating infant. Moreover, breastfeeding is encouraged in this condition to maintain an adequate
milk supply. SAM does not seem to affect infant growth and development at the long t erm40. This observation
is important because breastfeeding provides many non-nutritional health benefits to infants including passive
immunological protection during this period of host defence vulnerability, contributes to the active maturation
and shaping of the immature infant’s immune system and mucosal barrier, and fosters the correct infant psy-
chological development through emotional bonding.
In this study, we also explored potential relationship between HMOs, the main etiological agents of mastitis
and the immunological profile of milk samples. The Secretor status has a genetic basis related to the presence
of the gene encoding the α1-2-fucosyltransferase 2 (FUT2) enzyme which is a dominant trait. FUT2 transfers
fucose to the 2 position of β-galactose and it is required for the synthesis of 2’-fucosyllactose (2’FL), the most
abundant HMO in Secretor w omen4. FUT2, as well as other glucosyltransferases responsible for the synthesis
of HMOs in the mammary gland, are also involved in the glycosylation of cell membranes in epithelial cells.
Therefore, the Secretor status may influence the adhesion of pathogens and toxins because some microorgan-
isms attach to specific glycosylated motifs on the cell membrane structures; in the particular case of human
milk and other body secretions, HMOs may act as soluble receptors for different microorganisms and toxins
blocking their attachment to the cellular s urface41. In fact, modifications in cell glycosylation pattern have the
potential to change the susceptibility to develop numerous infections and other pathologies such as cancer
and metabolic d iseases42. Individuals with non-Secretor status, carrying null mutations in the FUT2 gene have
been associated with higher susceptibility to some pathogens such as Streptococcus pneumoniae, Streptococcus
pyogenes, Haemophilus influenza, Helicobacter pylori, Neisseria meningitis, and Candida albicans, among many
others43. Although data is scarce in relation to staphylococci, non-Secretor status was associated to an increased
risk (6.5 times) of carrying S. aureus in the throat than S ecretors44. In contrast, Secretors are at higher risk of
infections associated to other pathogens that require glycosylated receptors related to FUT2 activity, mainly
Norovirus, Rotavirus, Coronavirus, HIV…) and susceptibility to some types of cancers and chronic diseases43,45.
In this study, a high percentage of the participants (81%) were Secretors, in agreement with other s tudies46, but
there was not association between the Secretor status of the woman and a higher risk of developing mastitis or
the type of mastitis (SAM or AM). In addition, high IL7 (which is involved in lymphocyte development and
Scientific Reports | (2022) 12:1367 | https://doi.org/10.1038/s41598-022-05250-7 9
Vol.:(0123456789)www.nature.com/scientificreports/
maintenance, and can cross the intestinal barrier) and TGFβ2 milk levels in non-Secretor women, may influence
the differential susceptibility of infants from Secretor and non-Secretor mothers to infectious and autoimmune
and chronic inflammatory diseases43,45,47.
Recent studies have explored the association of maternal Secretor status on the HMO and microbiological
profiles of human milk using culture-independent m ethodology48. In our study, differences in the milk bacterial
and HMO content were noted among healthy women depending on the Secretor status. First, the concentration
of total bacterial counts and, more specifically that of S. epidermidis, which is the most frequent and abundant
bacterial species in human milk, were higher in samples from non-Secretor than in those from Secretor healthy
women. In fact, the total bacterial and S. epidermidis load had a strong negative correlation with both small
HMOs (fucosylated and sialylated lactose at different linkage positions) and the total amount of fucose linked to
HMOs. These results indicate a potential role of the human milk microbiota in the HMO content or vice versa.
However, this difference was only registered in healthy women but not in mastitis women, as this condition lead
to a substantial change of most bacterial species present in milk.
Apart from nourishing health-promoting bacteria in the gut of breastfed infants and reducing pathogen
attachment and infectivity by antiadhesive features49, emerging research suggest that HMOs may affect infant
immunity by interacting with receptors located in intestinal immune c ells9. In our study, we could find a profile
of HMOs clearly associated with the course of mastitis. The concentration of sialylated, type 2 and α2, 6-sialylated
HMOs, and more specifically LNFP I, LNFP III, 6’SL, LSTc, DSLNT and LNH, was higher among samples from
Secretor women that were suffering from mastitis than in healthy women, while LNFP II, DFLNH and LSTb were
more abundant among Secretor healthy women. Although the specific interactions between HMOs and human
milk microbiota are largely unknown, some studies have observed that certain HMOs by serving as metabolic
substrates for bifidobacteria contribute to shape the composition of the infant gut m icrobiota50–53. In contrast,
there are few studies addressing the prebiotic potential of HMOs for other species usually present in human
milk. Interestingly, a study showed that some HMOs stimulated the growth of S. aureus and S. epidermidis strains
isolated from human milk although they did not metabolize them54. In addition, the presence of Staphylococ-
cus and Streptococcus in the faeces of infants increased in relation to high consumption of fucosylated HMOs
(DFLac, LNFP-II and LNFP-III)55. In our study we found different relationships between HMOs, immunological
compounds and human milk microbiota as a function of the women’s health status, which should be explored
further. S. epidermidis was negatively correlated with the concentrations of small and fucosylated HMOs, and in
particular with those of 2’FL, DFLac and DFLNT, in healthy women but not in women with mastitis. In contrast,
in this group, only weak positive correlations were observed between S. epidermidis and the most abundant
neutral HMO (LNT) and between S. aureus and two sialylated HMOs, 6’SL and FDSLNH. A strong positive cor-
relation between S. aureus and FDSLNH has been previously r eported56. Through changes in the composition of
the microbiota, HMOs indirectly interfere with the immune system, but some recent in vitro and in vivo studies
suggest that they can also directly influence the production of immunological c ompounds57–59.
Some biological functions of HMOs are specific to their structure49, but the great structural diversity, vari-
able concentration and lack of knowledge of HMOs biosynthetic pathways have limited the accessibility to an
adequate amount of purified individual HMOs for structure–function linkage studies. In addition, the scarce
available studies of purified HMOs have focussed on their impact on infant health60, and the immunological
effect of HMOs in the mammary gland is unknown. The literature suggests that immunomodulatory effects of
HMOs are usually linked to anti-inflammatory function61. Our study showed that the mastitis immunological
profile in the mammary gland may be related to specific HMOs, as the levels of the branched hexasaccharide
LNH, its disialylated derivative DSLNH, 3’SL, and DFLac were positively associated to some pro-inflammatory
cytokines (IL2, IL6, IL17 and IFNγ). But different relationships were noted in healthy women: of the three most
abundant fucosylated HMOs, one (2’FL) was negatively associated to IL7 and TGFβ2, while the other two (3FL
and LNFP II) showed a positive association. However, more studies are needed to clarify the role that HMOs
may have in the susceptibility or resistance to develop mastitis and in the immunological course of this condi-
tion in breastfeeding women.
Overall, the findings of this study reinforce the hypothesis that microorganisms, immune compounds and
HMOs interact with each other in the mammary gland. These complex interactions take a drastic turn when
a woman experiences mastitis and the changes seem to depend on the etiological agent and the course of the
infection. Understanding these interactions in depth can provide information about a woman’s predisposition to
suffering mastitis and the development and the course of this condition. In addition, it may provide a new piece
of information to understand the influence of human milk in the infant health outcomes.
Materials and methods
Sampling. A total of 110 breastfeeding women were enrolled in this study, including 69 showing clinical
symptoms of mastitis (MW group) and 41 healthy women (HW group). Mastitis cases were classified as either
subacute (SAM) or acute (AM) mastitis, according to the criteria of Fernández et al.14. When women reported
bilateral infection (n = 21), the sample from the most affected breast was collected for analysis. To be eligible for
inclusion as members of the HW group, women had to report that they had an uncomplicated pregnancy, their
child was born at term and they were breastfeeding a healthy infant without any complications, including the
absence of symptoms related to breast infection or breast pain from birth to recruitment. HW provided a single
sample which was collected from the breast that the mother chose. In both cases (HW and MW groups), use of
antibiotics or probiotics in the previous 14 days were excluded. All volunteers gave written informed consent
to the protocol (reference 10/017E), which was approved by Ethical Committee of Hospital Clínico San Carlos
(Madrid, Spain). The study was carried out in accordance with the Declaration of Helsinki.
Scientific Reports | (2022) 12:1367 | https://doi.org/10.1038/s41598-022-05250-7 10
Vol:.(1234567890)www.nature.com/scientificreports/
Medical staff or the mother, under the supervision of medical staff, wearing sterile gloves, collected the milk
sample aseptically in a sterile polypropylene tube by manual expression. Previously, nipples and mammary areola
had been cleaned with soap and water. Samples were immediately frozen (− 20 °C) until analysis.
Milk cultures and identification of the isolates. Milk samples were plated onto Columbia Nadilixic
Acid (CNA; BioMérieux, Marcy l’Etoile, France; for isolation of staphylococci, streptococci, enterococci and
taxonomically-related Gram-positive bacteria), MacConkey (MCK; BioMérieux: for isolation of enterobacteria),
Wilkins Chalgren (WC; Oxoid, Basingstoke, UK for general isolation of anaerobic bacteria) and de Man, Rogosa
and Sharpe (MRS; Oxoid) supplemented with 0.25% L-cysteine (Sigma-Aldrich, St. Louis, USA) (MRSCys; for
isolation of lactic acid bacteria and bifidobacteria) agar plates to identify and quantify the viable bacteria present
in the samples. They were also plated on Sabouraud Dextrose Chloramphenicol (SDC, BioMérieux) for isola-
tion of yeasts. CNA, MCK and SDC plates were incubated in aerobic conditions at 37 °C for 48 h while WC and
MRSCys were incubated anaerobically (85% nitrogen, 10% hydrogen, 5% carbon dioxide) at 37 °C for 48 h in
an anaerobic workstation (DW Scientific Shipley, UK). The isolates were identified by Matrix-Assisted Laser
Desorption Ionization-Time of Flight (MALDI-TOF) mass spectrometry as described p reviously18.
HMO analysis. HMO analysis was conducted at the University of California San Diego using established
ethods5. Briefly, human milk (20 μL) was spiked with raffinose (a non-HMO carbohydrate) as an internal
m
standard at the beginning of sample preparation to correct for sample losses during sample processing and
allow for absolute oligosaccharide quantification. Oligosaccharides were extracted by high-throughput solid
phase extraction over C18 (Hypercarb-96, 25 mg bed weight, Thermo Scientific) and Carbograph microcol-
umns (Hypersep-96 C18, 25 mg bed weight, Thermo Scientific) using a controlled vacuum manifold. Use of
high-throughput microcolumns was validated in multiple different ways: (1) establishing parallelism in serial
dilutions, (2) spiking milk with individual HMO standards to determine recovery, and (3) comparison with
direct in-sample derivatization as used by o thers62. Oligosaccharides were fluorescently labelled with 2-amin-
obenzamide (2AB, Sigma) in a 96-well thermocycler at 65 °C for exactly 2 h. The reaction was stopped abruptly
by reducing the thermocycler temperature to 4 °C. The amount of 2AB was titrated to be in excess to account
for the high and variable amount of lactose and other glycans in milk samples. Unreacted 2AB was removed by
high-throughput solid phase extraction over silica microcolumns (Hypersep silica, 25 mg bed weight, Thermo
Scientific). Labeled oligosaccharides were analyzed by HPLC (Dionex Ultimate 3000, Dionex, now Thermo Sci-
entific) on an amide-80 column (15 cm length, 2 mm inner diameter, 3 μm particle size; Tosoh Bioscience) with
a 50-mmol/L ammonium formate–acetonitrile buffer system. Separation was performed at 25 °C and monitored
with a fluorescence detector at 360 nm excitation and 425 nm emission. Peak annotation was based on stand-
ard retention times of commercially available HMO standards (Sigma, Dextra, Elicityl) and a synthetic HMO
library63 and offline mass spectrometric analysis on a Thermo LCQ Duo Ion trap mass spectrometer equipped
with a Nano-ESI-source. Absolute concentrations were calculated based on HMO standard response curves
for each of the annotated HMO. (Oligosaccharide detection limit: ~ 20 pmol, dynamic range between 20 and
5000 pmol; milk samples were diluted accordingly). The total concentration of HMOs was calculated as the sum
of the annotated oligosaccharides. The proportion of each HMO making up the total HMO concentration was
also calculated. HMO-bound fucose was calculated on a molar basis. One mole HMO with one fucose residue
counted as one mole HMO-bound fucose while one mole HMO with two or more fucose residues counted
as two or more moles of HMO-bound fucose. The same was calculated for HMO-bound sialic acid. Maternal
Secretor status was determined by the high abundance (Secretor) or near absence (Non-Secretor) of the HMO
2’-fucosyllactose in the respective milk samples with a cutoff of 100 nmol 2’FL/mL.
Immunological analysis. The concentrations of 18 immune factors, including innate immune factors
(IL1β, IL6, IL12, IFNγ, TNFα), acquired immunity factors (IL2, IL4, IL10, IL13, IL17), chemokines (IL8, MCP1,
MIP1β), and growth factors (IL5, IL7, GCSF, GMCSF, TGFβ2) were determined by magnetic bead-based multi-
plex immunoassays, using a Bioplex 200 instrument (Bio-Rad, Hercules, CA, USA) and the Bio-Plex Pro Human
Cytokine and Bio-Plex Pro TGFβ assays (Bio-Rad), according to manufacturer’s instructions.
Prior to their analysis, milk samples (1 mL) were centrifuged (13,000 rpm, 15 min, 4 °C). After defatting, the
supernatant was aliquoted in different tubes for subsequent immunological analysis. A fresh aliquot was used for
each assay, avoiding freeze–thaw cycles. Every assay was run in duplicate according to manufacturer’s instruc-
tions, and standard curves were performed for each analyte on every assay. Concentration of all the immune
compounds were expressed as ng/L with the exception of those of TGFβ2, which were expressed as µg/L.
Statistical analyses. Distribution of the data was evaluated using Shapiro–Wilk normality test. Data with
normal distribution was expressed as mean and 95% confidence interval (CI), and data with non-normal distri-
bution was expressed as median and interquartile range (IQR). Microbiological data recorded as colony-forming
units (CFU) per mL of milk, HMO quantities and immunological compounds concentrations were log10 trans-
formed before analyses.
Chi-square test was performed aiming to check if the Secretor status was related to mastitis. The effect of the
group (MW/HW or Secretor/non-Secretor) on the concentrations of microorganisms, immunological com-
pounds and oligosaccharides was tested using one-way ANOVA or Wilcoxon sum rank tests (depending on
the actual data distribution). In the cases of microorganisms and immunological compounds, differences in the
frequency of detection among groups were tested using Chi-squared or Fisher’s exact tests. Wilcoxon sum rank
tests was used to identify differences in concentrations of HMOs and immunological compounds between AM
and SAM cases. False Discovery Rate was used to correct p-values in each analysis.
Scientific Reports | (2022) 12:1367 | https://doi.org/10.1038/s41598-022-05250-7 11
Vol.:(0123456789)You can also read