Research-based Soil Testing and Recommendations for Cotton on Coastal Plain Soils
←
→
Page content transcription
If your browser does not render page correctly, please read the page content below
Research-based Soil Testing and Recommendations
        for Cotton on Coastal Plain Soils

               Southern Cooperative Series Bulletin no. 410
                          ISBN 1-58161-410-1
                             January, 2010

 Southern Extension and Research Activity Information Exchange Group – 6
                                (SERA-6)

                              Edited by:
                             C. C. Mitchell
                     Department Agronomy & Soils
                           Auburn University
                           Auburn, AL 36849

                                Authors:
                              C.R. Crozier
                               D.H. Hardy
                               D.E. Kissel
                              C.C. Mitchell
                              J.L. Oldham
                               S. Phillips
                                L. Sonon

                             Published by:
                 Alabama Agricultural Experiment Station
                          Auburn University
                          Auburn, AL 36849
                               -1-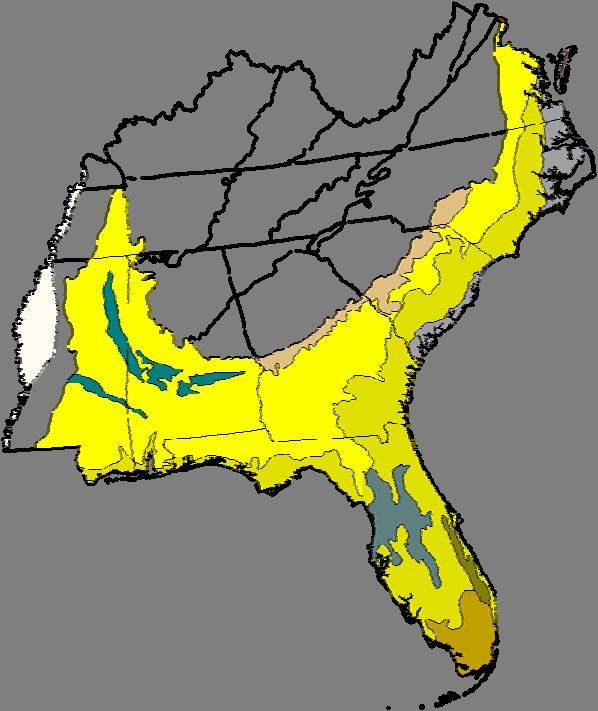
Members and Participants
                                         SERA-6
Alabama                            C.C. Mitchell and G. Huluka
Arkansas                           Morteza Mozaffari and Nathan Slaton
Florida                            Rao Mylavarapu – SERA-6 Chair
Georgia                            David E. Kissel and Leticia S. Sonon
Kentucky                           Frank J. Sikora, SERA-6 Vice-chair
Louisiana                          Rodney Henderson and Jim Wang
Mississippi                        Keith Crouse and Larry Oldham
North Carolina                     David Hardy, SERA-6 Secretary
Oklahoma                           Hailin Zhang, SERA-6 Past Chair
Puerto Rico                        David Sotomayor
South Carolina                     Kathy P. Moore
Tennessee                          Debbie Joines and Hugh Savoy
Texas                              Tony Provin (Texas A&M) and Leon Young (SFASU)
Virginia                           Steven Heckendorn
Administrative Advisor (Extension) David Kissel (University of Georgia)
Administrative Advisor (Research) Stephen R. Workman (University of Kentucky)

ADMINISTRATIVE ADVISORS
A current listing of Southern Region Cooperative Administrative Advisors may be found at:
http://saaesd.ncsu.edu/docholder.cfm?show=directory2.cfm&byCOO=1

North Carolina Department of Agriculture
Agronomic Division
Raleigh, NC 27611
ABOUT THE AUTHORS Crozier, Carl R. Professor (Soil Fertility Management in the Tidewater Region), V.G. James Research & Extension Center, 207 Research Station Rd, Plymouth, NC 27962. Phone: 252-793- 4428 ext 134. Email: carl_crozier@ncsu.edu Hardy, David H. NCDA&CS Agronomic Div., 4300 Reedy Creek Rd., Raleigh, NC 27607- 6465. Email: david.hardy@ncagr.gov Kissel, David E. Professor and Director of Agricultural & Environmental Services Lab. Soil, Plant and Water Testing Laboratory, The University of Georgia, 2400 College Station Road, Athens, GA 30602-9105. Phone: 706/542-5953. Email: dkissel@uga.edu Mitchell, Charles C., Extension Agronomist-Soils & Professor. Dep. Agronomy & Siols, 201 Funchess Hall, Auburn University, AL 36849. Phone: 334-844-5489. Email: mitchc1@auburn.edu Oldham, J. Larry. Extension Professor. Box 9555, Mississippi State, MS 39762. Phone: (662) 325-2760. Email: loldham@pss.msstate.edu. Phillips, Steve. Director, Southeast United States, International Plant Nutrition Institute, 3118 Rocky Meadows Road, Owens Cross Roads, AL 35763, Phone office: 256-533-1731 cell: 757-999-2839. Email: sphillips@ipni.net Sonon, Leticia. Chemist and Program Coordinator. Soil, Plant, and Water Laboratory, 2400 College Station Road. Athens, GA 306022-9150. Phone: 706-542-5350. Email: lsonon@uga.edu
Research-based Soil Testing and Recommendations
                for Cotton on Coastal Plain Soils
                                TABLE OF CONTENTS

I.      INTRODUCTION                                          page 1
        C.C. Mitchell

II.     SOILS OF THE SOUTHEASTERN COASTAL PLAIN REGION
        C.C. Mitchell                                         page 3

III.    SOIL SAMPLING FOR COTTON ON COASTAL PLAIN SOILS
        Larry Oldham, Leticia S. Sonon, and David E. Kissel   page 5

IV.     SOIL TEST METHODOLOGY
        C.C. Mitchell                                         page 8

V.      NITROGEN RECOMMENDATIONS
        C.C. Mitchell and S. Phillips                         page 9

VI.     MEHLICH-1 PHOSPHORUS
        C.C. Mitchell                                         page 18

VII.    MEHLICH-3 PHOSPHORUS
        C.R.Crozier & D.H. Hardy                              page 23

VIII.   MEHLICH-1 POTASSIUM
        C.C. Mitchell                                         page 31

IX.     MEHLICH-3 POTASSIUM
        C.R. Crozier & D.H. Hardy                             page 38

X.      MICRONUTRIENTS FOR COTTON
        C.C. Mitchell                                         page 46

XI.     LIMING AND pH ADJUSTMENT FOR COTTON
        D.H. Hardy and D. Kissel                              page 52
I. INTRODUCTION
C.C. Mitchell
The successful eradication of the cotton boll weevil in the southeastern U.S. during the 1990s
and the advent of genetically modified crops that allowed better boll worm control ushered in
renewed interest in cotton production on the predominantly sandy, Coastal Plain soils of this
region. Cotton acreage expanded rapidly in southern Alabama, Georgia, and the Coastal Plain
region of South Carolina, North Carolina, and Virginia during the 1990s into the early 2000s.
Cotton growers wanted to know if existing interpretations and recommendations were suitable
for the newer cultivars, higher yields, and modified production practices (e.g., conservation
tillage and irrigation) used on this expanded acreage in the Coastal Plain region.
The objective of this publication is to review existing soil fertility research for cotton on Coastal
Plain soils and to establish soil test calibration and nutrient recommendations for optimum
production. A similar publication was produced for peanuts on Coastal Plain soils (Mitchell,
1994). Much of the traditional soil fertility research with cotton today may not be published in
refereed journals. This bulletin will report relevant research and extension demonstration
results. This bulletin may be used by both public and private soil test laboratories and crop
advisors to establish a research-based, region-wide basis for soil test interpretations and
recommendations.
The term “optimum production” is casually used by many researchers, extension specialists, and
consultants to mean the highest possible yields and/or quality that any particular site is capable
of producing under the normal limitations of weather, soil conditions, and production practices.
When reporting soil test calibration research, optimum yield refers to the highest or near highest
yield under the conditions of the experiment. Researchers may report a critical soil test value
for optimum yield as being 95 percent of maximum yield. The optimum yield concept is much
easier to justify in making research-based fertilizer recommendations than the “yield goal”
approach of some laboratories. Yield goal is the yield that a producer expects to achieve based
on overall management imposed and past production records (SSSA, 1997). Some modify this
term with realistic yield goal. The yield goal approach to nutrient recommendations is used for
N recommendations on grain crops and forages where large quantities of N are removed in the
harvested portion of the crop. Nitrogen and sometimes K recommendations can be correlated
with yield potential in grain and forage crops. However, correlation research with P, Ca, Mg,
and micronutrients with yield potential is weak or non-existent.
This publication seeks to establish an unbiased basis for soil test interpretation and
recommendations based on research that has been done with cotton on Coastal Plain and
closely associated soils of the southeastern U.S.
A Note about Soil Test Units and Recommendations
Public soil testing laboratories have always tried to make soil test results and recommendations
easy for producers to understand and use. This has led to differences among states and
laboratories in the way soil test results are reported. These differences often lead to confusion
when comparing results from one lab to another. For example, most laboratories run extractable
plant nutrients using metrics such as milligrams per liter (mg/L or mg L-1) for liquids or
milligrams per kilogram (mg/kg or mg kg-1) for solids. Some may use millimoles or centimoles
per liter (mmol/L or cmol/L). Others may simply report parts per million (ppm) which is
-1-essentially the same as mg/L or mg/kg) or parts per billion (ppb) for extremely small
concentrations. The North Carolina Department of Agriculture’s laboratory has made strong
arguments over the years that soil test results should be reported as milligrams per deciliter
(mg/dL or mg dL-1) because roots grow in a volume of soil and not a weight of soil (Mehlich,
1972, Tucker, 1984). If one knows the density of the soil being tested, one can easily convert
from mg/L to mg/kg to mg/dL. Soil densities are not often reported on soil test results and will
change in the field due to soil compaction and disturbance. To avoid confusion among farmers
and other lab customers, the North Carolina laboratory reports results based on an index
(Hatfield, 1972). An index of 50 is considered optimum. Different indexes among states can
lead to further confusion in soil testing. In 1994, Alabama dropped a soil test sufficiency index
where an index of 100 was considered sufficient because it was confusing to customers.
Many laboratories still report soil test results as “pounds per acre” of extractable nutrients.
Technically, an acre is an area measurement. It has value when making fertilizer
recommendations to be spread on a surface acre of land, but this value is really erroneous when
reporting soil test results. Laboratories that use it assume that an acre of soil approximately 6
inches deep weighs about 2,000,000 pounds. Therefore, ppm or mg/kg x 2 = pounds per acre.
Even though the term was intended to put soil test results into a form that farmers could
understand, it also creates confusion. Some growers erroneously conclude that they can subtract
the "soil test results" from the pounds per acre of nutrients contained in the crop at an expected
yield.
To avoid confusion regarding units, this paper will report all soil test values of extractable
nutrients as mg/kg. Recommendations for nutrients will be made in pounds per acre of N, P2O5,
K2O, etc. because all public soil testing laboratories use the same units for recommendations.
References
Mehlich, A. 1972. Uniformity of expressing soil test results: a case for calculating results on a
volume basis. for Comm. Soil Sci. Plant Anal. 3(5): 417-424.
Mitchell, C.C. (editor). 1994. Research-based soil testing interpretation and fertilizer
recommendations for peanuts on coastal plain soils. Southern Coop. Ser. Bul. No. 380.
Alabama Agric. Exp. Stn., Auburn University, AL.
SSSA. 1997. Glossary of soil science terms. Soil Sci. Soc. Amer., Madison, WI.
Tucker, M. R. 1984. Volumetric soil measure for routine soil testing. Comm. Soil Sci. and Plant
Anal. 15(7): 833-840.
Hatfield, A. L. 1972. Soil test reporting: a nutrient index system. Comm. Soil Sci. and Plant
Anal. 3(5): 425-436.
-2-II. SOILS OF THE SOUTHEASTERN COASTAL PLAIN REGION
C.C. Mitchell
The Coastal Plain physiographic region encompasses a large area from Maryland and New
Jersey to Texas. All these soils were formed from marine sediments. However, for the
purposes of this publication, emphasis will be on those well drained soils formed from sandy
marine sediments along the Atlantic and Gulf of Mexico coastal regions from Mississippi
through Virginia encompassing USDA-NRCS Major Land Resource Area 133A, Southern
Coastal Plain (USDA-NRCS, 2006). The Coastal Plain region encompasses what may be
known locally as Upper Coastal Plain, Lower Coastal Plain, and Coastal Flatwoods. Cotton is
produced primarily on the Paleudults, Hapludults, Kandiudults, and some Fragiudults.
Throughout the Coastal Plain region are broad river terraces formed from alluvial deposits.
These are some of the most productive soils in the region. The state soils of Alabama (Bama
series), Georgia (Tifton series), South Carolina (Lynchburg series) and Virginia (Pamunkey
series) are all found in the Coastal Plain physiographic regions of these states.
Most Coastal Plain soils have
surface soil textures ranging
from loams to loamy sands with
cation exchange capacities less
than 9 cmol/kg. They tend to be
naturally acidic throughout the
soil profile although there are
exceptions. The application of
ground limestone (or other
liming material) based upon a
soil pH and lime requirement
test is necessary to maintain a
suitable pH for optimum cotton
production (see Chapter XI)
.
Because of low soil organic
matter (typically less than 2
percent) and the change in soil
texture with depth, many
Coastal Plain soils tend to
develop traffic pans or plow
pans following mechanical
plowing or cultivation. A
restricted root zone can limit
moisture and nutrient uptake by
Traffic pans can severely restrict root growth in some cotton and create saturated
Coastal Plain soils. zones during periods of heavy
rainfall. A 1991 cotton survey
in the central Alabama Upper Coastal Plain region that was repeated in 2001 indicated an
average surface soil organic matter of 0.6% with 66 percent of the fields having traffic pans
within the upper 10 inches of soil (Kuykendall et al., 2002). Although conventional tillage
(moldboard plowing or chiseling followed by disking and mechanical cultivation) is still a
common practice for cotton production on these soils, many producers have adopted
-3-conservation tillage practices that often includes in-row subsoiling or para-plowing and planting
into old crop residue or a winter cover crop of rye, wheat, clover or vetch.
References
Kuykendall, L., R.R. Beauchamp, and C.C. Mitchell. 2002. Changes in Central Alabama cotton
soil management, 1991 and 2001. Proc. 2002 Beltwide Cotton Conf.. National Cotton
Council, Memphis, TN.
USDA-NRCS. 2006. Land resource regions and major land resources areas of the U.S., the
Caribbean, and the Pacific Basin. Handbook 296. pp 427-431. US Dep. Agric. Washington,
DC.
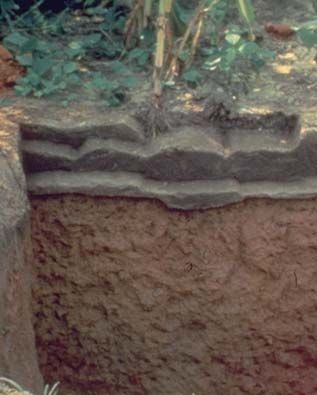
Bama series from AL Norfolk series from NC Dothan series from GA
(Fine-loamy, kaolinitic,
(Fine-loamy, siliceous, (Fine-loamy, kaolinitic,
thermic, Plinthic
subactive, thermic Typic thermic, Typic Kandiudults)
Kandiudults)
Paleudults)
Tifton series from GA Ruston series from LA Red Bay series from FL
(Fine-loamy, kaolinitic, (Fine-loamy, siliceous, (Fine-loamy, kaolinitic,
thermic, Plinthic semiactive, thermic Typic thermic, Rhodic
Kandiudults) Paleudults) kandiudults)
Examples of profiles of soil series from Coastal Plain sites where cotton could be
produced.
-4-III. SOIL SAMPLING FOR COTTON ON COASTAL PLAIN SOILS
Larry Oldham, Leticia S. Sonon, and David E. Kissel
Introduction
Determining the fertility status of soils through soil sampling and testing is one of the most
important steps to attain success in crop production. Soil testing provides information on
nutrient deficiency and availability for plant uptake and thus, guides the grower on determining
the appropriate nutrient amendment that is compatible with crop needs. The overall goals of
soil sampling and testing are (Peck and Soltanpour, 1990):
1. accurately determine the nutrient status of a soil;
2. convey to the manager the seriousness of any nutrient deficiency or excess;
3. form the basis for fertilizer decisions; and
4. allow an economic assessment of the fertility management options.
Moreover, increased awareness of environmental issues by growers has elevated the importance
of soil testing for satisfying both plant nutrient needs and environmental stewardship.
Successful nutrient management based on soil testing depends on sound soil sampling
procedures, i.e., to be able to collect samples that best represent a field or field area. The quality
of the soil sample determines the relevance of the test results. Soil itself is heterogeneous;
additionally, field variability in vegetation, terrain or slope, drainage, organic matter content,
texture, and previous fertilizer application can all affect the uniformity of soil fertility. Errors in
test results due to poor sampling are generally greater than those arising from the chemical
analysis. Representative composite samples are crucial for reliable test results and
interpretation, which will lead to optimum production, maximum investment return, and
improved environmental quality.
Defining Fields or Samping Areas
Soil sampling should always begin with a field plan or map that defines different areas to be
tested. Historically, farmers have used their personal knowledge of soils, soil characteristics,
crop growth patterns, drainage, and other factors to delineate field areas that are sampled on a
‘whole field’ basis. With technological advances, farmers now have the option to use more
intensive sampling patterns within fields on either geometrical grid patterns or user-defined soil
management zones. Soil management zones are identified through criteria such as soil series,
texture, drainage, yield maps, or use history. The methods used to choose either grid sampling
or soil management zones is beyond the scope of this chapter. Growers may work with crop
consultants, Extension personnel, or others to determine the best sampling pattern.
Soil Sampling
There are a few basic tenets to a better soil sampling program:
• use of proper equipment;
• random sampling in the field, grid, or zone;
• accounting for previous banded fertilizer applications;
• collecting samples from appropriate soil depths;
• compositing an adequate number of subsamples;
• consistent time of sampling from year to year; and
• proper handling of samples.
-5-Equipment
Soil may be collected in several ways. Specialized soil test probes are available, but not
absolutely necessary, for soil sampling. However, only stainless steel, or other non-reactive
metal tools should be used to extract soil samples in the field. Stainless steel is preferred
because some other materials react with the soil sample and produce skewed results for some
metals. Galvanized metal equipment, for instance, will dramatically increase the zinc levels in a
sample, as reconfirmed in the coastal plain region of Mississippi in 2007 (M. Howell, personal
communication).
Random Sampling
Soil samples should be selected at random across the testing area in a random walk, zig-zag
pattern when using a whole field basis. Soil sampling patterns within grids or management
zones have been researched extensively in recent years (Anderson-Cook et al., 1999; Buscaglia
and Varco, 2003; Flowers et al., 2005; Mallarino and Wittry, 2004). One option is “grid cell”,
which considers each grid as a separate whole field, and sampled with a random walk. Another
option is “grid point” where samples are obtained within a relatively small radius of a midpoint
within the grid. Where in-field nutrient levels are thought to be relatively high, “grid cell” is the
better option. “Grid point” should be better when in-field nutrient level variability is low. Fields
with a history of banded phosphorus and/or potassium fertilizer applications should be noted.
Approaches to sampling these fields are available in Clay et al. (2002).
Depth of Sampling
Fertilizer recommendations are generally based on the assumption that the samples were
collected from the surface 6 inches of soil. However, broadcast application of immobile
phosphorus and potassium fertilizers in minimum tillage production systems leads to
stratification of these nutrients near the soil surface. When minimum or no till is used, a soil
sample depth of four inches is typically recommended.
Number of Cores
A large number of soil cores should be composited to properly represent a field area, because
variability of nutrients such as P and K are typically high due to lack of uniformity of previous
years’ fertilizer applications. Soil variability of surface soil is also generally higher, and
therefore more cores should be collected. In general, a composite sample of 20-30 individual
borings should be taken to represent an area of 20 acres in size. Even smaller areas of 10 acres
in size should have 15-20 cores composited.
Time of Sample Collection
Samples should be collected every year in multiple cropped fields in order to monitor fertility
trends and use this information in managing the fertility program. For less intensive cropping,
sampling every two to three years may be adequate. Soil test results for some nutrients, pH, and
lime requirement vary by season due to climatic conditions, crop growth, and other factors
(Kowalenko, 1991). For better consistency, fields should be sampled during the same month,
whether on an annual or multi-year schedule.
-6-Sample Handling and Record Keeping
Soil samples should be collected into clean plastic buckets and mixed well. Galvanized buckets
should be avoided as they may contaminate samples if micronutrients are being tested. Cores
should be broken up and well homogenized before taking a composite subsample for laboratory
analysis. Most soil testing laboratories provide small moisture- resistant boxes, sacks or bags
that hold about a pint of soil. These are preferred by the laboratories for operational ease, but if
not available, samples may be submitted in plastic bags. Each sample box or bag should bear a
unique identification that corresponds to the sample information given on the submission form
Complete field records should be kept and maintained, including field map and names, sampling
points and timing, cropping and fertilization history, and other management activities
undertaken. This information along with the soil test reports will allow monitoring the changes
in the fertility status of fields and field areas over time.
References
Anderson-Cook, C.M., M.M. Alley, R. Noble, and R. Khosla. 1999. Phosphorus and potassium
fertilizer recommendation variability for two mid-Atlantic Coastal Plain fields. Soil
Science Society of America Journal 63:1740-1747.
Buscaglia, H.J., and J.J. Varco. 2003. Comparison of sampling designs in the detection of
spatial variability of Mississippi Delta soils. Soil Science Society of America Journal
67:1180-1185.
Clay, D.E., J.L. Kleinjan, W.A. Tjentland, N. Kitchen, and C.G. Carlson. 2002. Collecting
representative soil samples for N and P fertilizer recommendations [electronic resource].
Crop Management.
Flowers, M., J.G. White, and R. Weisz. 2005. Yield-based management zones and grid
sampling strategies: describing soil test and nutrient variability. Agronomy Journal
97:968-982.
Kowalenko, C.G. 1991. Fall vs. spring soil sampling for calibrating nutrient applications on
individual fields. Journal of Production Agriculture 4:322-329.
Mallarino, A.P., and D.J. Wittry. 2004. Efficacy of grid and zone soil sampling approaches for
site-specific assessment of phosphorus, potassium pH, and organic matter. Precision
Agriculture 5:131-144.
Peck, T. R., and P.N Soltanpour. 1990. The principles of soil testing. Pp. 1-10. In: .L.
Westerman (ed.) Soil testing and plant analysis. 3rd Edition. Soil Science Society
America Book Number 3. Madison, Wisconsin.
-7-IV. SOIL TEST METHODOLOGY
C.C. Mitchell
Methods used by public soil testing laboratories in the Coastal Plain region are reported by
Savoy (2009, http://www.clemson.edu/sera6/srbull190aug09version.pdf). Most of the state
laboratories with cotton on Coastal Plain soils (AL, GA, FL, SC, TN, and VA) use the Mehlich-
1 extraction procedure for P, K, Mg, and Ca. North Carolina uses the Mehlich-3 procedure.
The Mehlich-3 procedure was designed to improve extraction of P and micronutrients (Zn, Fe,
Cu, Mn) on soils with higher cation exchange capacities (CEC) and higher soil pH than the
Mehlich-1 procedure. Modern analytical instrumentation (e.g., ICAP spectrophotometry) is
allowing more and more laboratories to detect and report additional extractable nutrients using
both the Mehlich-1 and Mehlich-3 extraction. Currently no public laboratory in the southern
region routinely reports micronutrients on their soil test report although all laboratories may
offer a micronutrient soil test as a special analysis. Most private laboratories report extractable
micronutrients but interpreting these values are weak at best.
All public laboratories in the southeastern U.S. except the University of Georgia test soil pH
using a 1:1 soil: water ratio but the method of determining lime requirement varies. The lime
requirement test could result in some variability among different laboratories. In 2004, the
Georgia laboratory switched to measuring soil pH in a 0.01 M CaCl2 solution to reduce the
season-to-season variability associated with fertilizer salts in sandy soils. The pHsalt values
reported will generally be about 0.6 pH unit lower than traditional pHwater values. The
laboratory reports both the measured pHsalt and an equivalent pHwater
(http://www.clemson.edu/sera6/Soil%20pH%209-23-041.htm).
-8-V. NITROGEN RECOMMENDATIONS
C.C. Mitchell and S. Phillips
Nitrogen (N) is the most difficult nutrient to manage in cotton production. Nitrogen is a
primary constituent of plant protein, is required for photosynthesis and boll retention, and has
more impact on yield, earliness, and lint quality than any other primary plant nutrient. Like all
nutrients, apply too little N and yields drop; however, too much N can result in rank growth,
slow fruiting, delayed maturity, and greater susceptibility to insect and disease pressure. It is
also one of the highest input costs per acre for plant nutrients. In addition, excess soil N is a
driving force behind water quality issues and nutrient management planning policies focused on
reducing nitrate-N leaching into groundwater. Nitrogen is biologically active, is easily
transformed into several chemical forms, and can be mobile in the environment. Thus, there are
several factors that complicate making N fertilizer recommendations including inherent soil N
supply, potential losses of both soil and fertilizer N, and predicting N availability of green
manures, animal manures, composts, biosolids, and other N sources.
Soil Testing
Soil testing is the foundation for many nutrient recommendations. Measuring soil inorganic N
prior to the season in dry climates is used to improve fertilizer N recommendations. However,
N monitoring in the soils of the humid southeastern U.S. is not a widespread practice. Seasonal
variations in inorganic N concentrations in these soils greatly affect the ability of a soil test to
accurately predict soil N contributions to crop nutrient requirement in a given growing season.
Jackson (1998) monitored nitrate and ammonium accumulation and movement under long-term
N rate studies with cotton in two Alabama Coastal Plain soils, a Benndale sandy loam and a
Lucedale fine sandy loam. Figure 1 illustrates how quickly N applied as ammonium nitrate in
the spring can migrate through these soils by fall.
Current N Recommendations for Cotton
Rather than using an elusive soil test for monitoring N, states in the southeastern U.S. have
developed N recommendations for cotton using N-rate experiments conducted throughout the
region (Table 1).
Alabama is the only state that has on-going N rate experiments for cotton. Alablama’s current,
standard N recommendations were developed from these same N rate experiments in the 1950s
and 60s, modified in the 1970s, and refined in the 1980s (Scarsbrook and Cope, 1957; Cope,
1970, 1984; Touchton et al., 1981). If cotton responds to N rates differently today, the
difference would be expected to be a consequence of improved varieties, higher yields, and
different management. Nitrogen-rate variables on long-term soil fertility experiments with
cotton were summarized from 1992 through 2003 at five Alabama locations:
Benndale l.s. near Brewton, AL
Lucedale f.s.l. near Monroeville, AL
Lucedale s.c.l. near Prattville, AL
Dothan s.l. near Headland, AL
Decatur si.c.l. near Huntsville, AL
Figure 2 is a compilation of mean relative yields for N rates at each location over the period
1992-2003. Relative yield is the percentage yield of each treatment compared to the standard N
rate of 90 pounds per acre. Cotton on Coastal Plain soils (all soils except the Decatur) appear to
-9-respond to N similarly and are combined into one curve with a near maximum yield at 90
pounds N per acre. Cotton on the finer textured, Decatur soil of the Tennessee Valley reaches a
near maximum yield at 60 pounds N per acre, probably due to less leaching loss and some N
retention. Other states have followed similar strategies by providing a range of recommended N
rates and guidelines for adjusting N rates according to changes in soil properties (Table 1).
Recommendations among states in the Southeast are similar with suggested N rates in the 60 to
90 lb/acre range. This similarity is not surprising as cotton is largely grown on soils common
throughout the region and average lint yield potentials are comparable among states.
Table 1. Standard total N recommendations (lb/acre/yr) for cotton in the southeastern U.S.
Alabama: 90±30 in split application for all soils
Florida: 60 in split applications
Georgia: 60 to 105 in split applications based on realistic yield goals of 750 to
1500 lb. lint/acre.
Mississippi: 50 to 60 per bale on “light-textured soils”; 60-70 per bale on “medium-
textured soils”; split applications if over 100 lb N per acre applied.
North Carolina: 50 to 70 in split applications
South Carolina: 70±30 in split applications
Virginia: 60 to 90
Tennessee: 30 to 60 on bottom soils; 60 to 80 on upland soils
Yield Goals for Cotton
Two states in the region, Mississippi and Georgia, recommend N rates for cotton based on
expected yield goal. Basing N fertilizer rate recommendations on expected yield is commonly
used in grain crops such as corn and wheat as these crops remove large quantities of N in the
harvested portion of the crop. However, because the cotton plant is by nature a perennial that is
forced to grow as an annual, managing N solely based on yield goal is especially challenging
and is not as widely used. Cotton plants take up 80 lb N/acre to produce one bale of harvested
cotton. Of this 80 lb N/acre, approximately 32 lb N/acre is removed in the harvested crop. The
yield-based system used in Georgia ranges from 60 lb N/acre for a 750 lb cotton lint yield (1.5
bale) to 105 lb N/acre for a 1500-lb crop (3 bale). This scale calculates into 40 lb N
required/bale at the lower yield level and only 35 lb N/bale being needed at the highest yield
level. This difference suggests that N use efficiency is much higher in the higher yielding
environments, possibly due to more productive soil types due to increased water and nutrient
retention, higher soil N contributions, or less risk of N loss. Mississippi also makes adjustments
for apparent differences in N use efficiency recommending 50 to 60 lb N/expected bale on
“light textured soils” and 60 to 70 lb N/bale on “medium textured soils”. Yield-based N
recommendation systems are subject to the uncertainty of annual yield estimates and the
variable nature of crop response to N fertilizer applications from year to year. One of the
problems with yield-based N rate recommendation systems is that they assume that crop
responsiveness to fertilizer inputs is constant across locations and years. In other words, a high
yielding crop always has a high N fertilizer requirement. Yield levels are known to vary widely
in a given environment from year to year; however, crop responsiveness to N fertilizer also
fluctuates as a result of the environment, independent of crop yield potential.
- 10 -A summary of Alabama’s long-term N-rate experiments on non-irrigated cotton from 1992
through 2003 demonstrates the extreme variability associated with cotton yield and
responsiveness to N fertilizer application (Fig. 3). At the five sites illustrated in Fig. 3, non-
irrigated cotton lint yields varied two- to three-fold over the years at a given location. What is
especially interesting about these data is that these wide yield ranges occurred at a consistent N
fertilizer application rate, showing a lack of relationship, for the most part, between response to
N fertilizer and yield level. For example, at the Decatur site, the N rate needed to achieve the
average lint yield over the 7-yr test period (1100 lb/A) was 60 lb N/A (Fig. 3e). However, in a
low yielding year (800 lb lint/A) and the highest yielding year (1600 lb lint/A) the optimum N
rate remained 60 lb/A, indicating the site’s ability to adapt to changing yield potentials by
supplying the N needed for the higher production levels. Similarly on a Lucedale soil (Fig. 3c
and d), the recommended N rate of 90 lb/A was sufficient to sustain yield increases of
approximately one bale/A in the highest yielding years. In the lowest yielding year, the 90-lb
N/A rate resulted in decreased yield of 200 lb lint/A, probably due to rank growth and
suggesting that a lower rate may have been needed (Fig. 3c and d). The Dothan site (Fig. 4b) is
an example of where increased yield potential did warrant an increase in N fertilizer rate.
However, the overall results of this study indicate that a yield-based N rate recommendation is
not a reasonable approach for Alabama’s non-irrigated cotton producing regions. Despite the
reliance of some states on this method, it is expected that irregularity in the relationship between
lint yield and optimum N rate, particularly under dryland conditions, will commonly occur
throughout most of the Southeast.
Tissue Testing
Most N fertilizer rate recommendations, whether they be soil test- or yield-based, are made
prior to establishing the crop or very early in the growing season. However, to be fully
committed to matching nutrient supply with plant demand throughout the growing season, some
in-season monitoring may be necessary. One of the more common in-season methods is plant
tissue analysis.
Plant tissue analysis is the sampling of a diagnostic plant part and measurement of the nutrient
concentration in the tissue or the sap from the tissue. Nutrient deficiencies identified by tissue
testing can be corrected in some situations or direct corrective action for future crops. While a
range of nutrient concentrations is often provided to help guide the plant nutrient analysis
interpretation, adequate concentrations can vary with crop, variety, plant part sampled, growth
stage when sampled, environment, geographic area, and other factors. Collecting tissue and soil
samples from both ‘poor’ and ‘good’ areas of a field often helps to diagnosis nutrient
deficiencies.
A comprehensive document providing interpretation of both petiole nitrate and leaf blade N for
Southeast cotton has been reported in a web-based, Southern Coop. Series Bulletin
(http://www.clemson.edu/sera6/scsb394notoc.pdf).
Optical Sensor Technology
A strategy for determining in-season N fertilizer application rates that is rapidly gaining
popularity is the use of optical sensors. Most optical sensors currently being used for making N
rate decisions are active sensors, meaning they have an internal light source, rather than using
sunlight. The sensors emit light at specific wavelengths and measure the portion of the light
reflected back to the sensor. The amount of reflected light is correlated with plant
- 11 -characteristics such as greenness (much like a chlorophyll meter) and biomass. One type of
sensor that has been used to make on-the-go adjustments in N rate is the GreenSeeker®. This
sensor measures reflected red and near-infrared light to calculate a vegetation index
[Normalized Difference Vegetation Index (NDVI)], which has been correlated with leaf area
index, leaf N content, and crop yield. The NDVI values measured by the sensors are entered
into an algorithm using an on-board computer and an N rate requirement is calculated. Nutrient
rate algorithm components vary by region, but most are fairly sophisticated taking into
consideration several factors. Some of the factors used in various N rate algorithms include in-
field reference measurements that are usually collected from “non-limiting” or “nutrient-rich”
areas established earlier in the growing season to compare with the target measurements at the
time of fertilization; consideration of spatial and temporal conditions that affect crop growth,
soil nutrient availability, overall yield potential; and estimates of crop responsiveness to applied
fertilizer that account for other nutrient sources such as manures or early-season mineral
fertilizer applications.
Variable-rate N applications in cotton have not been developed as rapidly as in grain crops such
as wheat and corn, probably for the same reasons that the yield-goal approach to N fertilization
does not work as well for cotton as for grain crops. However beginning in 2008, Cotton
Incorporated named sensor technology as its precision agriculture research focus. In addition to
the internal work being conducted in their core program, Cotton Inc. is coordinating university
research in 13 states across the US cotton producing regions. As part of this program, various
methods to determine cotton N requirement using optical sensors are being evaluated.
Researchers at Mississippi State University have established strong relationships between leaf N
and sensor measurements across a range of cotton growth stages. The ability to use sensors to
indirectly determine leaf N can result in accurate N rate recommendations without having to
collect and analyze leaf tissue samples. Several southeastern states have not advanced past
small-plot research work, but those that have taken the technology to grower fields are
encouraged by the results.
Cotton Following Soybean or Peanut
A comment on soil test reports for cotton in Alabama recognizes that residue from a good
soybean or peanut crop may contribute 20 to 30 pounds N per acre to the following cotton crop
(Adams et al., 1994). The University of Georgia indicates that 30 to 40 lb N/A may be available
following peanuts and Virginia Tech guidelines suggest that similar availability can be
considered for a good soybean crop. The North Carolina cotton production guide indicates only
20 to 25 lb N/acre is needed to get the crop through sidedress time and if the crop is following
peanut or soybean, no initial N may be required. Florida also recommends reducing the total N
rate applied for cotton by 30 lb/A following a legume crop.
However, because as many as 6 months could elapse between soybean/peanut harvest in the fall
and cotton planting the following April or May, much of the residual N may be lost from the
cotton-producing soils in the Southeast. Data from N-rate treatments on a long-term cotton
experiment in Alabama (circa 1929) verify the variable nature of residual N from legumes (Fig.
2).
Adjusting N Rates for Tillage, Irrigation, and Starter Fertilizers
In general, N rate recommendations for cotton under conventional, reduced, or no-tillage
systems in the Southeast do not differ. An exception is when reduced or no-till cotton follows
- 12 -small grain. In this situation, an additional 30 lb N/acre may be recommended. Alabama
guidelines indicate that this additional N may be applied as a starter, while Florida
recommendations suggest a surface application to help decompose the straw residue so that N
needed for plant growth is not limited.
Several studies throughout the Southeast have shown that starter fertilizers can enhance early-
season growth, promote earlier fruiting, and increase cotton lint yields. Significant increases in
lint yields were observed in 13 of 18 locations in Mississippi in 3-yr field trials. Significant lint
yield increases were also observed in Louisiana studies evaluating both 3-inch surface-band and
in-furrow applications. Other starter application methods include 2x2 band placements, where
yield increases were reported for four locations over a 2-yr period in North Carolina. Responses
to N-only starter applications have been observed, but most of the larger yield increases have
been due to N and P being applied together, typically as 10-34-0 or a similar ammonium
polyphosphate solution. Starter effects are also most commonly seen on soils where lint yield
potential are greater than 700 lb/A and other good management practices are followed. Starter
N applications will not be as effective when the complete N fertilization program is not
managed responsibly.
Irrigation does not typically affect crop response to N fertilizer applications. Usually, irrigated
cotton will yield more than dryland cotton, resulting in a higher N requirement, but the
subsequent change in optimum N rate is tied to the increased yield potential, not directly to the
presence of water. Thus, states in the Southeast do not have separate N recommendations for
irrigated and dryland cotton production. However, some states warn growers that the need to
split N applications will be greater under irrigated conditions as the risk for leaching losses is
higher.
Summary and Recommendations
Producers in the Southeast should follow the standard N recommendations provided for their
state and make adjustments as experience and cropping systems dictate. To best achieve their
economic and environmental production goals, growers should strive to apply the appropriate N
rate for their crop in the most efficient manner possible.
Some techniques growers can use to try and optimize N use efficiency in cotton include:
• Split or multiple N applications
• Starter fertilizers
• Appropriate N fertilizer placement
• Foliar urea (46-0-0) applications during bloom
• Petiole monitoring
• Plant leaf analyses
• Proper water management (irrigation timing)
• Plant growth regulators (e.g., Pix Plus®)
• Urease inhibitors for urea-based fertilizers
• Nitrification inhibitors
• Cover crops
• Computer programs and plant growth models (e.g., Gossym-Comax®, NLEAP®, EPIC®,
COTMAN®)
• Real-time monitoring and precision N application.
- 13 -Efficient N management in cotton, as well as all crops, involves selecting the right fertilizer
source and applying it at the right rate, at the right time in the growing season, and using the
right placement method for each specific cropping system.
References
Adams, J.F., C.C. Mitchell, and H.H. Bryant. 1994. Soil test fertilizer recommendations for
Alabama crops. Agronomy & Soils Dep. Ser. No. 178. Alabama Agric. Exp. Stn., Auburn
University, AL.
Cope, J.T., Jr. 1970. Response of cotton, corn, bermudagrass to rates of N, P, and K. Ala. Agric.
Exp. Stn. Cir. 181. Auburn University, AL.
Cope, J.T. 1984. Long-term fertility experiments on cotton, corn, soybeans, sorghum, and
peanuts, 1929-1982. Ala. Agric. Exp. Stn. Bul 561. Auburn University, AL.
Jackson, S.E. 1998. Nitrogen movement under long-term fertilization and cropping in two
Alabama soils. M.S. Thesis. Auburn University, AL.
Mitchell, C.C., F.J. Arriaga, J.A. Entry, J.L. Novak, W.R. Goodman, D.W. Reeves, M.W.
Runge, and G.J. Traxler. 1996. The Old Rotation, 1896-1996 – 100 years of sustainable
cropping research. Special publication of the Ala. Agric. Exp. Stn., Auburn University, AL.
Mullins, G.L., and C.H. Burmester. 1990. Dry matter, nitrogen, phosphorus, and potassium
accumulation by four cotton varieties. Agron. J. 82:729-736.
Scarsbrook, C.E., and J.T. Cope, Jr. 1957. Sources of nitrogen for cotton and corn in Alabama.
Ala. Agric. Exp. Stn. Bul. 308. Auburn, AL.
Touchton, J.T., F. Adams, and C.H. Burmester. 1981. Nitrogen fertilizer rates and cotton petiole
analysis in Alabama field experiments. Ala. Agric. Exp. Stn. Bul. 528. Auburn University,
AL.
- 14 -Soil nitrate-N (mg/kg) Soil nitrate-N (mg/kg)
0 2 4 6 8 10 12 14 16 18 0 2 4 6 8 10 12 14 16 18
1 1
Late
2
Early 2 Fall
3 Spring 3
Depth (feet)
Depth (feet)
4 4
5 5
High N High N
6 6
7
No N
* 7
No N
8 8
Fig. 1. Nitrate movement under cotton in a Benndale loamy sand fertilized with no
N and 120 lb. N/acre/year (High N) (data from Jackson, 1998).
- 15 -Cotton Every Year
110
Relative Cotton Yield (%)
100
90
80
70 Standard
60 recommendation for Standard recommendation
Tenn. Valley soils for Coastal Plain soils
50
0 30 60 90 120 150
N Rate (lb/acre)
Benndale Lucedale-Mon Lucedale-Prat Dothan Decatur
Cotton following soybeans
110
100
Relative yield (%)
90 Tennessee Valley
80
70 Mean for 4 Coastal Plain
sites
60
50
40
30
0 30 60 90 120 150
N rate (lb/acre)
Fig. 2. Nitrogen rates where cotton is planted every year (“Rates of N-PK Test”) and cotton
following soybean (“Two-Year Rotation Experiment”) at five Alabama locations, 1992-2003.
Relative yield is the lint yield compared to the lint yield of a treatment receiving 90 pounds N
per acre. All N is applied in split applications.
- 16 -Benndale l.s. Lucedale f.s.l.
Cotton lint yield (lb/acre)
Cotton lint yield (lb/acre
1800 Highest yield 7-yr mean 1800
1500 1500
1200 1200
900 900
600 600
300 300
Lowest yield
0 0
0 30 60 90 120 150 0 30 60 90 120 150
N Rate (lb/acre) N Rate (lb/acre)
Lucedale s.c.l. Dothan s.l.
Cotton lint yield (lb/acre)
Cotton lint yield (lb/acre
1800 1800
1500 1500
1200 1200
900 900
600 600
300 300
0 0
0 30 60 90 120 150 0 30 60 90 120 150
N Rate (lb/acre) N Rate (lb/acre)
Decatur si.c.l.
Cotton lint yield (lb/acre
1800
1500
1200
900
600
300
0
0 30 60 90 120 150
N Rate (lb/acre)
Figure 3. . Cotton yield response to N rates on the “Rates of N-P-K Test” (c. 1954) , 1992-
2003, at five Alabama locations. Lines represent the highest yielding year, the lowest yielding
year, and the mean of 7 years.
- 17 -VI. MEHLICH-1 PHOSPHORUS
C. C. Mitchell
Mehlich-1 (dilute double acid) extraction is used by laboratories in Alabama, Florida, Georgia,
South Carolina, Tennessee, and Virginia for testing Coastal Plain soils for P and other nutrients.
Critical values for cotton range from 18 mg extractable P/kg to 30 mg/kg (Table 1).
Table 1. Calibration of Mehlich-1 extractable P for cotton by state soil testing laboratories in
the southeastern U.S..
Soil test rating for P
High
State Low Medium (critical
value)
----Extractable P (mg/kg)-------
Alabama
CECtesting laboratories in the region for Mehlich-1 P and cotton on Coastal Plain soil (18 to 30 mg
P/kg). No attempt was made to fit a regression to these data because the purpose was to
determine if the current critical values are still valid for modern yields, cultivars, and production
practices. Evans (1987) summarized calibration results in on-farm tests for 7 Alabama crops on
Coastal Plain soils and found a critical Mehlich-1 extractable P level of 18 mg/kg, somewhat
lower than the 25 mg/kg value that has been used. He used the following regression for the
responsive region of the curve in Fig. 1.
:
Relative yield = 54.6 + 4.86 (M-1 P) – 0.132 (M-1 P)2
The fine-textured soils of the Tennessee Valley have a high P fixation capacity and a lower
critical P value as currently used by the Auburn University Soil Testing Laboratory (Adams et
al., 1994). These data verify the current value of 15 mg P/kg for these soils (Fig. 1). Other state
laboratories also recognize lower critical values for finer textured soils (Table 1).
The current soil test calibration for P on cotton as used by the Auburn University Soil Testing
Laboratory was established by Rouse (1968) and verified and updated in numerous Alabama
Agricultural Experiment Station reports since then (Cope, 1970, 1983, 1984; Burmester et al.,
1981; Adams et al.; Cope et al., 1981). While the 25 mg P/kg value used for Coastal Plain soils
(soils with CEC < 9.0 cmol/kg) is higher than that proposed by Evans (1987) and will result in
more P fertilizer recommended for cotton than Evans suggested, it is still a reasonable critical
value considering values used throughout the region. These data provide no evidence that P
fertilization should be adjusted for yield goal (Cope and Rouse, 1973).
Because no additional P fertilization is recommended when M1 extractable P is rated “High”
(25+ mg P/kg), growers often ask, “How many years can I grow crops before I have to resume P
fertilization?” This question was addressed by the same experiments that established the
calibration curve for cotton (Fig. 1). In these experiments, direct P applications were stopped
from 1982 to 1998, a period of 16 years. Only one treatment continued to receive annual P
applications and this treatment was used as the basis for calculating relative yield, e.g. the mean
cotton yield of the fertilized control was 100% yield. All other treatments were compared to the
fertilized control. Mean cotton lint yield, highest yield, and lowest yield for the control during
the period 1992-1998 are presented in Table 2.
Table 2. Mean yield, highest yield, and lowest yield for cotton lint on the fertilized control
treatment on long-term soil fertility experiments at 5 Alabama locations, 1992-1998.
Cotton lint yields (pounds per acre)
Soil series (location) Mean Highest Lowest
Benndale l.s. (Brewton) 1020 1570 380
Dothan.s.l. (Headland) 760 890 610
Lucedale f.s.l. (Monroeville) 880 1140 700
Lucedale s.c.l. (Prattville) 1110 1500 390
Decatur si.c.l. (Belle Mina) 1150 1420 660
Composite, plow layer soil samples were collected every other year from each plot. Mean soil
test P did not change very much during the entire 16 years at three of the five sites (Fig. 2).
Grain crops (corn, wheat, soybean, and sorghum) and cotton were planted and harvested
throughout the period. Soil test P did drop gradually on the highest rate of the Dothan soil
because no P was applied to this treatment. Data from the Dothan soil was from a different
- 19 -experiment. Therefore, continuous cropping under the conditions of these experiments will have
little effect on soil test P over a 16-yr period. Once soil test values reach a “high” rating,
growers can expect them to stay near this value for many years even with no additional P
fertilization. In fact, at all sites, “high” soil test P levels in 1982 remained “high” in 1998
although the actual values may have dropped where no P was applied.
Summary and Recommendations
Data from long-term fertility experiments in Alabama verify that the currently used critical
values for Mehlich-1 extractable P for cotton on Coastal Plain soils in the Southeastern U.S.
appear reasonable although critical values range from 18 to 30 mg P/kg depending upon state
and soil textures within states. Above the critical value, no yield response to additional P is
expected. These same experiments demonstrate that Mehlich-1 P values will drop very slowly
due to cropping. In a 16-yr study, values that were high at the beginning of the experiment,
remained high (above critical value) 16 years later although cropped to cotton and grain crops
during this period.
References
Adams, F. 1975. Field experiments with magnesium in Alabama – cotton, corn, soybeans,
peanuts. Ala. Agric. Exp. Stn. Bul. 472. Auburn University, AL
Adams, J.F., C.C. Mitchell, and H.H. Bryant. 1994. Soil test fertilizer recommendations for
Alabama crops. la. Agric. Exp. Stn. No. 178. Auburn University, AL
Cope, J.T. 1970. Response of cotton, corn, bermudagrass to rates of N, P, and K. Ala. Agric.
Exp. Stn. Cir. 181. Auburn University, AL
Cope, J.T. 1972. . Fertilizer recommendations and computer program key used by the soil
testing laboratory. Ala. Agric. Exp. Stn. Cir. 176 (revised). Auburn University, AL
Cope, J.T. 1983. Soil test evaluation experiments at 10 Alabama locations, 1977-1982. Ala.
Agric. Exp. Stn. Bul. 550. Auburn University, AL.
Cope, J.T. 1984. Long-term fertility experiments on cotton, corn, soybeans, sorghum, and
peanuts, 1929-1982. Ala. Agric. Exp. Stn. Bul. 561. Auburn University, AL
Cope, J.T., Jr., J.T. Eason, and G. Simmons. 1970. Fertilizer recommendations and computer
program key used by the soil testing laboratory. Ala. Agric. Exp. Stn. Cir. 176. Auburn
University, AL
Cope, J.T., and D.L. Kirkland. 1975. . Fertilizer recommendations and computer program key
used by the soil testing laboratory. Ala. Agric. Exp. Stn. Cir. 176 (revised). Auburn
University, AL.
Cope, J.T., C.E. Evans, and H.C. Williams. 1981. Soil test fertilizer recommendations for
Alabama crops. Ala. Agric. Exp. Stn. Cir. 251. Auburn University, AL
Cope, J.T., Jr., and R.D. Rouse. 1973. Interpretation of soil test results. P. 35-54. In L.M. Walsh
and J.D. Beaton (ed) Soil testing and plant analysis. Revised Edition. Soil Sci. Soc.
Amer., Madison, WI.
Evans, 1987. Soil test calibration. P. 23-29. In J.R. Brown (ed.) Soil testing: Sampling,
correlation, calibration, and interpretation. Soil Sci. Soc. Amer. Spec. pub. No. 21.
Madison, WI.
Rouse, R.D. 1968. Soil test theory and calibration for cotton, corn, soybeans, and coastal
bermudagrass. Alabama Agric. Exp. Stn. Bull. 375. Auburn University, AL.
- 20 -Coastal Plain Soils
CEC< 9.0 cmol/kg
****
140
Relative cotton Yield (%)
120
100
80
60
40 Benndale
Critical soil test P values Dothan
20 currently in use by state soil Lucedale-M
testing labs
Lucedale-P
0
0 20 40 60 80 100
M1-extractable P (mg/kg)
120
Decatur si.c.l.
Tennessee Valley
*
Relative cotton Yield (%)
100
80
60
40
2-Yr Rot.
Current critical soil test P
20 used in Alabama NPK Test
0
0 10 20 30 40 50 60
M1-extractable P (mg/kg)
Fig. 1. Mehlich-1 soil test calibration for cotton based on data from Alabama’s “Two-year
Rotation” and “Rates of N-P-K” experiments at five Alabama locations. Shaded area includes
the current critical Mehlich-1 extractable P values used by public soil testing laboratories in
Alabama, Georgia, Florida, South Carolina, and Tennessee. All Coastal Plain soils in these
experiments had CEC < 9.0 cmol/kg.
- 21 -.
Benndale l.s. Dothan s.l.
Brewton Headland
90 2-Yr. Rotation
M1-Extractable P (mg/kg)
100
M1-Extractable P (mg/kg)
80
P rate before
80 1982 70 P rate before
1982
0 60
60 50 0
20
40 30
40 40
60 30 Current critical soil test P 60
20 100
20
10
0 0
1980 1985 1990 1995 2000 1980 1985 1990 1995 2000
Year Year
Lucedale f.s.l. Lucedale s.c.l.
Monroeville Prattville
90
M1-Extractable P (mg/kg)
120
M1-Extractable P (mg/kg)
80 P rate before
70 1982
100 P rate before
1982
60 0 80 0
50 20
60 20
40 40
40
30 60 40 Current critical soil test P 60
20 100
10 20 100
0 0
1980 1985 1990 1995 2000 1980 1985 1990 1995 2000
Year Year
Decatur si.c.l.
Tennessee Valley
60
M1-Extractable P (mg/kg)
P rate before
50 1982
40 0
20
30 40
20 Current critical soil test P 60
10 100
0
1980 1985 1990 1995 2000
Year
Fig. 2. Change in Mehlich-1 extractable P at five Alabama locations over 16 years. Only the
highest P rate (100 lb. P2O5/acre/yr) was applied; the other rates were applied prior to 1982.
The Dothan s.l. had no P applied to any of the treatments.
- 22 -VII. MEHLICH-3 PHOSPHORUS
Carl R. Crozier and David H. Hardy
Mehlich-3 extraction is used by laboratories in Arkansas, Kentucky, Louisiana, North Carolina,
Oklahoma, & Pennsylvania for testing soils for P and other nutrients (Hardy et al., 2007). The
Mehlich-3 extractant was developed and adopted for routine use by the North Carolina
Department of Agriculture & Consumer Services Agronomic Division Laboratory because it
improved correlations between soil test P and crop yield over the Mehlich-1 extractant (0.05 N
HCl + 0.05 N H2SO4), and was also effective in quantifying soil K, Ca, Mg, Na, Cu, Mn, and
Zn (Mehlich, 1984).
Mehlich-3 critical P levels have been characterized for grain crops (Cox and Lins, 1984; Cox,
1996), and Irish potato (Solanum tuberosum L.) (McCollum, 1978) in North Carolina. Limited
data are available for cotton, but reports include critical levels of 13 to 19 mg P kg-1 (Cox and
Barnes, 2002) and 22 to 42 mg P kg-1 in North Carolina (Fig. 1, 2; Crozier et al., 2004), and 33
mg P kg-1 for cotton on the Texas High Plains (Bronson & Bowman, 2004; Booker et al., 2007).
Statistical analyses typically use linear-plateau regression to evaluate the effect of soil or plant
tissue P concentration on seed cotton yield (Crozier et al., 2004) with the lower limit of the
plateau portion of the function considered to be the critical level (Cate and Nelson, 1971). Crop
responses to nutrient levels can also be characterized using analysis of variance, exponential, or
quadratic-plateau functions. Nevertheless, the linear-plateau method provides a simple
quantification of the critical level, independent of fertilizer and cotton price fluctuations (Cate
and Nelson, 1971; Dahnke and Olson, 1990; Cox, 1996). Differences among studies could be
due to soil, variety, or other climatic variables, but the North Carolina studies highlight the need
to insure adequate fertility levels for other nutrients. Limitations due to K may have reduced
yield response to P in the earlier years (Fig. 3; Cox and Barnes, 2002; Crozier et al., 2004).
General principles derived from studies with other crops that are probably applicable to cotton
include soil texture effects, a need to account for variability in developing commercial fertilizer
rate prescriptions, lack of correlation between critical level and yield level, and temporal
fluctuations in soil test P associated with fertilizer addition and crop removal.
Studies with corn (Zea mays L.) document that the response to soil P gradients depends on soil
clay content (Cox and Lins, 1984; Cox, 1994a). Their model suggests critical levels for corn
ranging from < 20 to 125 mg kg-1 as clay content decreases from 40 to 5% (Fig. 4).
Since research estimates of critical P levels can vary substantially due to random experimental
errors, soil test P variability, and textural variability, Cox (1992) presents justification for soil
testing laboratories to recommend fertilization at P levels up to 50% greater than the average
experimental critical level. According to this principle, and considering average critical levels
for North Carolina as 40 mg P kg-1 in the tidewater region and 28 mg P kg-1 in the coastal plain,
P fertilization would be recommended at soil test levels up to 64 mg kg-1 in the tidewater and 45
mg kg-1 in the coastal plain. This estimate yields results similar to projections of Cox and Lins
(1984, Fig. 4) for soils with 10-20% clay, which are typical for these regions. For simplicity
and due to the limited amount of calibration data, a single P recommendation function is used in
North Carolina (Fig. 4).
Cox (1992) reported little correlation between critical P level and grain yield for corn and
soybean. Perhaps this needs to be investigated for cotton, but no trends have been apparent and
crop yield levels have been typical for the region in North Carolina studies to date.
- 23 -You can also read