Role of landslides on the volume balance of the Nepal 2015 earthquake sequence
←
→
Page content transcription
If your browser does not render page correctly, please read the page content below

www.nature.com/scientificreports
OPEN Role of landslides on the volume
balance of the Nepal 2015
earthquake sequence
A. Valagussa*, P. Frattini, E. Valbuzzi & G. B. Crosta
The 7.8 Mw earthquake that struck Nepal on April 25th, 2015 triggered over 21,000 landslides
over an area of more than 25,000 km2. These landslides contributed to mass wasting, partially
compensating the tectonic uplift by the earthquake. In this paper we quantify the volume balance
resulting from the 2015 earthquake uplift (or subsidence) and landslide erosion. Starting from a
new complete earthquake-induced landslide inventory, we calculated landslide volume by adopting
different strategies for low-mobility and high-mobility landslides, considering also the potential
supply of sediments to the drainage network. The results show that the contribution of earthquake-
induced landslides to erosion is about one order of magnitude smaller than the vertical coseismic
displacement. We found landslide volume values, due to the 2015 Nepal earthquake, ranging between
251 (− 15/ + 16) Mm3 up to 1503 (− 183/ + 210) Mm3 based on the adopted method, and a volume due
to coseismic vertical displacement of 2134 (± 1269) Mm3 for the whole area. The volume balance of the
2015 Nepal earthquake is strongly dominated by tectonic displacement. We show that these estimates
depend on several uncertainties. We identified and quantified uncertainties related to: (1) the choice of
empirical volume-area scaling relationships and their parameters; (2) the completeness and quality of
landslide inventory through comparison with available inventories; (3) the approach adopted for the
assessment of elongated landslide volume; (4) the InSAR displacement data.
Shallow earthquakes are the most important driver of rock uplift in mountain ranges, through repeated verti-
cal displacements1. Moreover, earthquakes are a primary trigger of landslides2 that may have a relevant role in
the mountain belt e volution3–6 by causing intense erosion. The point and area density7,8 and the size (i.e. area
and volume) of slope failures were found to be potentially proportional to specific seismic parameters, such as
the peak ground acceleration and the earthquake m agnitude9–12. Therefore, larger earthquakes are commonly
associated to a larger erosional i mpact2.
The net volume balance between seismically-induced rock uplift and landslide erosion may differ between
earthquakes13. In some cases, the tectonic uplift or subsidence was higher than topographic lowering due to
earthquake-induced landslides (e.g., 1999 Chi‐Chi earthquake14; 2010 El Cucapah Mayor e arthquake15). In other
cases, such as the 2008 Wenchuan earthquake, the landslide mass wasting matched the seismic uplift6,16. Start-
ing from these observations, Li et al.16 suggested that earthquakes larger than a critical magnitude would allow
erosion to compensate the rock uplift. Based on a model of earthquake‐triggered landslides and an analytical
solution of coseismic surface displacement, Marc et al.13 suggested that earthquakes with a net erosive effect are
not those with a large magnitude, above Mw 8, but rather those with intermediate magnitudes between Mw 6.3 and
7.3. On the other hand, earthquakes with both smaller and larger magnitude ( Mw < 6, Mw > 7.3) have a net positive
volume balance. As far as we know, an estimate of the net volume balance associated to the 2015 Nepal earthquake
is still missing, although some authors already tried to estimate the volume of landslides occurred during the
earthquake17,18. These volumes are consistent with the landslide volume-earthquake magnitude relationships
available in the literature2,9,10. However, due to the large rock uplift that occurred during the e arthquake19–21,
our first hypothesis is that the overall contribution of landslide erosion to the volume balance of the 2015 Nepal
earthquake is small with respect to tectonic uplift, differently from what was observed for other earthquakes
(e.g. Li et al.16). This is important because it reveals how single large earthquakes may significantly contribute
to the overall surface uplift of the Nepal Himalayan belt. A second hypothesis is that the uncertainty related to
either the landslide volume or the vertical coseismic displacement is very high, of the same order of magnitude
of the estimated values.
Department of Earth and Environmental Sciences, University of Milano-Bicocca, Milan, Italy. * email: andrea.
valagussa@unimib.it
Scientific Reports | (2021) 11:3434 | https://doi.org/10.1038/s41598-021-83037-y 1
Vol.:(0123456789)
www.nature.com/scientificreports/
Figure 1. Earthquake-induced landslides inventory, with the 21,151 landslides mapped as a polygons. The
bold grey line is the boundary of Nepal, while the thin grey lines are the district boundaries in Nepal. The blue
rectangle identifies the area (2230 km2) where the scar area was identified and mapped as an independent
feature for 1500 out of 2258 landslides. The red and blue stars localize the main foreshock and the main
aftershock, respectively. The inset 1 shows an example of landslides mapped as polygons in the inventory, with
the distinction of scar (filled) and runout (outline) areas. The red line indicates the study area. Orange areas
indicate unmapped areas due to clouds cover or low quality images. (The map was generated by using ArcGIS
10.3.1, http://www.esri.com/).
The 2015 Nepal earthquake landslide inventory
On April 25th, 2015, an earthquake (Mw 7.8) occurred 80 km to the northwest of Kathmandu. The earthquake,
known as the Gorkha earthquake20,22–24, is the result of faulting on the main thrust plane (Main Himalayan
Frontal Thrust, MFT) between the subducting Indian plate to the south and the overriding Eurasian plate to
the north. The largest aftershock (Mw 7.3) occurred on May 12, 2015, 80 km to the east of Kathmandu. The area
affected by the earthquake extends between Nepal and China (Fig. 1).
Immediately after the event, various research groups mapped the co-seismic landslides25,26 as points or lines.
In addition, Zhang et al. 27, and Lacroix28 mapped landslides as polygons for small areas. Gnyawali and Adhikari29
mapped 17,628 landslides as polygons based on high-resolution images available in Google E arth29 (Supplemen-
tary Figure S1). Martha et al.30 developed an inventory with 15,551 landslides using high-resolution satellite data.
Roback et al.17 developed a co-seismic landslide inventory where source and runout areas are differentiated. The
inventory contains 24,915 landslides and it was realized by using high-resolution pre- and post-event satellite
imagery (Supplementary Figure S1). Another inventory (47,200 landslides) was realized by Xu31 based on visual
interpretation of pre- and post-earthquake high-resolution optical satellite images and field reconnaissance.
Finally, Valagussa et al.32 developed an inventory of 4300 landslides, mainly located in the central part of the area
affected by the earthquake. This inventory was subsequently completed and used for all the analyses presented
in this study. The inventory was prepared, at a 1:2000 scale through manual mapping of landslide polygons on
available multi-temporal images, and helicopter-based videos. The inventory covers an area of about 25,000 k m2
and contains 21,151 landslides (Fig. 1; Supplementary Figure S1). The mapped landslides were classified as debris
flows, shallow translational slides, rockfalls, and in the upper sector of the mountain belt, rock-ice avalanches
and rock-ice falls.
Manual mapping of landslides avoids or minimizes common problems recognized in landslide inventories
such as amalgamation11,33. Manual mapping allows accurate description of the shape and the size of each land-
slide, thus allowing a reliable analysis of denudation rate, sediment yield and size frequency density at a regional
scale.
On the other hand, some problems may exist with: the exact positioning of landslides, due to inaccuracies in
the georeferencing of the Google Earth imagery, the image rectification, the lighting, the vegetation cover, and
the steep slope of the topography34. While the first issue does not affect the study of volume balance, the other
issues may introduce uncertainties in the landslide footprint and therefore in the estimation of the landslide
volumes. Where available, helicopter-based videos were used to resolve some of the mentioned issues. In addi-
tion, field checks of a small part of the landslide inventory were carried out in October 2015 in the Rasuwa and
Sindhupalchok districts. A subsequent validation was performed based on the photos taken in the field. Another
issue with manual mapping is the consistency of interpretation and mapping among different interpreters. For
Scientific Reports | (2021) 11:3434 | https://doi.org/10.1038/s41598-021-83037-y 2
Vol:.(1234567890)
www.nature.com/scientificreports/
Figure 2. Scatterplot showing the relationship between the scar area and the total landslide area as obtained for
a subsample of 1500 landslides from the inventory (Fig. 1). The points are coloured according to the aspect ratio
(AR). The linear fitting functions (Table 2) and the landslides size frequency distribution for each AR class are
also reported.
this reason, the inventory was entirely mapped by a single geomorphologist, crosschecked with other expert
mappers and by using available satellite images and helicopter-based video.
Landslide scar area
The mapping of the landslide scar is important for volume estimation35. Due to the variable quality of the images
used for landslide mapping, it was extremely difficult to consistently separate the scarp and the runout areas
throughout the study area. Hence, this separation was completed for a subset of well visible 1500 landslides of
different type (Fig. 1) for which the scar ratio (SR, i.e. the slope of the best-fitting linear regression between scar
area and total landslide area) and the aspect ratio (AR, i.e. the ratio between the landslide length and width)
were calculated. Since it was expected the SR to be a function of the landslide shape and elongation, landslides
were classified into six AR classes for which different relationships between the total landslide area and the main
scar area were attained.
As expected, the modelled SR declines with the degree of elongation: the more elongated the landslide, the
smaller the ratio (Fig. 2 and Table 1). The size frequency distribution of landslides belonging to the different
aspect ratio (AR) classes shows a shift toward larger landslides for higher AR ratios, together with an overall
reduction in frequency (Fig. 2).
Landslide volume and erosion
To estimate the landslide volume removed by the earthquake, the study area was divided in 235 lattice cells,
with a dimension of 10 × 10 km. For each cell, the landslide volume was calculated with three approaches to
analyse the source of uncertainty in landslide volume assessment: (1) V_ALL in which the volume was defined
for all the landslides by using two volume/area relationships R1 (global relationship for all landslides) and R2
(relationship for Himalayan landslides)36; V_AR, for which the inventory was separated into elongated (AR > 3)
and non-elongated (AR ≤ 3) landslides. For non-elongated landslides the same approach as V_ALL was applied.
For elongated landslides, the volume was calculated by applying R1 and R2 to the scar area only, while the con-
tribution of erosion along the runout path was calculated by assuming an erosion thickness of 0.5, 1 and 3 m;
(2) V_AR_river, in which the volume was defined as for V_AR, but only for landslides that reached the channel
network (see “Methods” for details).
The volumes calculated with this three approaches (V_ALL, V_AR, and V_AR_river) are significantly differ-
ent, and different for the same approach with the two adopted formulas (R1, global relationship for all landslides
and R2, relationship for Himalayan landslides, see “Methods”). In general, the mean erosion values obtained
with R2 are much higher than the values obtained with R1. For V_AR_river the differences between the two
formulas are smaller due to the reduced number of landslides on which the analysis is conducted (23% of the
entire inventory) and their covered area.
By considering the total landslide area (V_ALL), the mean erosion averaged over the 10 × 10 km lattice cells is
about 30 and 70 mm for R1 and R2, respectively. The erosion is over 50 mm for 37 (R1) and 71 (R2) lattice cells
located along the sub-Himalayan range between the epicentres of mainshock and main aftershock (Fig. 3a,b,
orange/red lattice cells). For the whole area, the total eroded volume amount to 628 (− 39/ + 42) Mm3 and 1503
(− 183/ + 210) Mm3 by R1 and R2, respectively. The uncertainty on the volume estimation was assessed by mean
values ± 16th and 84th percentiles of 10,000 Monte Carlo samplings for α and γ scaling parameters.
The mean erosion values over the 10 × 10 km lattice cells range between 26.7 (− 1.7/ + 1.8) mm to 64.0
(− 7.8/ + 8.9) mm for R1 and R2, respectively.
Scientific Reports | (2021) 11:3434 | https://doi.org/10.1038/s41598-021-83037-y 3
Vol.:(0123456789)
www.nature.com/scientificreports/
Figure 3. erosion (Ecell) computed for the 235, 10 km x10km, lattice cells. (a,b) Mean erosion for V_ALL:
the volume is calculated from the entire landslide area with R1 (global relationship for all landslides) and R2
(relationship for Himalayan landslides), respectively (see Supplementary Table S2). (c,d) Mean erosion for
V_AR. The landslides volume was calculated with R1 and R2, respectively; (e,f) mean erosion for landslides
that overlap the river network, V_AR_river, again with R1 and R2, respectively. For the scar area both R1 and
R2 were applied. For V_AR and V_AR_river, the volume eroded from the runout area is computed assuming
an erosion depth ranging between 0.5 and 3 m. Black lines indicate the districts in Nepal. (The maps were
generated by using ArcGIS 10.3.1, http://www.esri.com/).
By adopting the V_AR approach, a significant decrease in mean erosion is observed. The mean erosion over
the 10 × 10 km lattice cells is about 15 and 30 mm, with R1 and R2, respectively. The number of lattice cells with
an erosion higher than 50 mm decreases to 21 (R1) and 43 (R2), and the total eroded volume is almost halved
amounting to about 324 (− 15/ + 16) M m3 and 660 (− 70/ + 81) M m3 by R1 and R2, respectively. The mean ero-
sion values over the 10 × 10 km lattice cells range between 13.8 (− 0.6/ + 0.7) mm to 28.1 (− 3.0/ + 3.4) mm for
R1 and R2, respectively (Fig. 3c,d).
By considering only landslides supplying sediment to the channel network (V_AR_river), the total eroded
volume amounts to about 251 (− 15/ + 16) Mm3 (R1) and 582 (− 72/ + 83) Mm3 (R2). The mean erosion over the
10 × 10 km lattice cells range between 10.7 (− 0.6/ + 0.7) mm to 24.8 (− 3.1/ + 3.5) mm for R1 and R2, respectively
(Fig. 3e,f). The uncertainty on erosion values is propagated from the uncertainty on landslide volume.
The differences between the proposed methods for the assessment of the landslide volumes are clearly shown
by Fig. 4a. It is possible to observe that the selection of different equations and approaches gives a range of varia-
tion between 251 M m3 and 1503 M m3. Change in the values of the considered soil thickness (0.5 and 3 m) along
the runout area does not return significant change in the calculated volume (black line in Fig. 4a,b). In addition
Fig. 4c underlines the importance of the input data involved in the analysis. The total landslide volumes calculated
by applying V_ALL R1 method for the three landslide inventories available online are: 6 Mm3 for Zhang et al.27;
209 Mm3 for Gnyawali and A dhikari29; 343 M m3 for Roback et al.17. The integration of landslides by Roback
17
et al. in our inventory only for areas that we have not mapped due to the presence of clouds or high-distorted
images leads to only a small increase in estimated landslide volume, from 628 Mm3 (V_ALL R1) to 631 Mm3
(V_ALL R1 + Roback et al.17 in Fig. 4c).
Vertical coseismic displacement
The April 2015 M w 7.8 earthquake occurred in a region with less than optimal seismic and geodetic c overage19.
For this reason, the vertical displacement was analysed by using satellite InSAR data. Two satellites were opera-
tional before and after the earthquake allowing measurements of line-of-sight (LOS) displacement: the Sentinel-
1a satellite (operated by the European Space Agency—ESA) and the ALOS-2 satellite (operated by the Japanese
Space Agency—JAXA)19 which collect C‐band (5.6 cm wavelength) and L-band (23.5 cm wavelength) InSAR
Scientific Reports | (2021) 11:3434 | https://doi.org/10.1038/s41598-021-83037-y 4
Vol:.(1234567890)
www.nature.com/scientificreports/
Figure 4. (a) Mean landslide volume (Mm3) for the three methods based on R1. (b) Mean landslide volume
(Mm3) for the three methods based on R2. In (a,b) horizontal bars indicate the range of variation due to a
change in the soil thickness eroded along the runout area (0.5 and 3 m). (c) Mean landslide volume (Mm3)
for the earthquake-induced landslide inventories in Nepal: Roback et al.17; Gnyawali and Adhikari29; Zhang
et al.27 and the integration in our inventory of landslides by Roback et al.17 located in unmapped areas (V_ALL
R1 + Roback et al.17).
observations, respectively (Supplementary Figure S3). In this work, we adopted the ALOS-2 LOS displacement
data processed by Lindsey et al. (2015) and corrected to assess the mean vertical coseismic displacement (VCD)
for the study area (Fig. 6).
According to Wang and Fialko37 the ALOS-2 estimates for the path T04819 are affected by a RMSE of 54 mm.
When this value is applied over the study area, this is equivalent to an estimated uncertainty of 1269 Mm3 on
the total coseismic volume6.
The uncertainty on this estimate is also shown by the comparison with Sentinel 1 data with GPS data22 (see
Supplementary Figures S2, S3).
As found in the literature19–21, the mean vertical coseismic displacement allowed us to identify four different
sub-areas. Subsidence of up to − 0.9 m (average value − 0.2 m) along the sub-Himalayan and Himalayan sec-
tors N/NE of Kathmandu (sub-area 1 in Fig. 5) was observed roughly between the two main epicentres of the
earthquake sequence. This sub-area covers 7300 k m2. Conversely, rock uplift up to 1.3 m (average value 0.4 m)
was observed within an area that extends ESE–WNW from Kathmandu. This zone, defined as sub-area 2 for
the subsequent analysis, covers an area of 6700 km2 (Fig. 5). A third area south of Kathmandu, with an extent
of 1700 k m2, is characterized by a slight subsidence (sub-area 3, Fig. 5). Finally, a fourth area is located west of
Kathmandu. The area extends for 7800 k m2 and it is characterized by a slight rock uplift with an average value
of 0.1 m and a maximum of 0.6 m (sub-area 4, Fig. 5).
Considering the entire area, an average positive vertical coseismic displacement of 91 mm was calculated,
corresponding to a total coseismic volume addition to the entire area of 2134 (± 1269) M m 3.
Net volume change
The net volume change was calculated as the difference between the volume due to the coseismic vertical dis-
placement and the volume due to landsliding. For the whole area, a coseismic volume uplift equal to 2134
(± 1269) Mm3 was found (Table 2). The net volume change ranging between 1505 (− 1308/ + 1311) M m3 (R1)
and 630 (− 1452/ + 1479) Mm3 (R2) for the V_ALL method. This value decreases to 1809 (− 1284/ + 1285) Mm3
(R1) and 1473 (− 1339/ + 1350) M m3 (R2) for V_AR method and to 1882 (− 1284/ + 1285) M m3 (R1) and 1551
(− 1341/ + 1352) Mm3 (R2) for V_AR_river.
Considering the subdivision of the study area based on the mean vertical displacement, the largest net surface
change is found in sub-area 1. In addition to a coseismic volume change of − 1309 (± 394) M m3 (subsidence) a
landslide volume ranging between 442 (− 28/ + 30) Mm3 (R1) to 1066 (− 131/ + 151) M m3 (R2) was computed
with V_ALL. The landslide volume decreases to 212 (− 10/ + 11) M m3 (R1) and 429 (− 45/ + 52) M m3 (R2) for
V_AR, and to 191 (− 12/ + 13) M m3 (R1) and 447 (− 56/ + 65) M
m3 (R2) for V_AR_river (Table 2). The sub-area
2 is affected by rock uplift, with a coseismic volume contribution value of 2649 (± 362) M m3, with a landslide
volume ranging between 51 (± 3) Mm3 (R1) and 118 (− 13/ + 15) Mm3 (R2) for V_ALL. This value decreases
m3 (R1) and 59 (− 5/ + 6) M
to 31 (± 1) M m3 (R2) for V_AR, and to 12 (± 1) M m3 (R1) and 25 (± 3) M m3 (R2)
for V_AR_river (Table 2). Sub-area 3 shows a small subsidence coseismic volume equal to − 54 (± 92) Mm3 and,
due to a limited occurrence of landslides, a slight eroded volume (Table 2). Finally, sub-area 4 shows a coseismic
Scientific Reports | (2021) 11:3434 | https://doi.org/10.1038/s41598-021-83037-y 5
Vol.:(0123456789)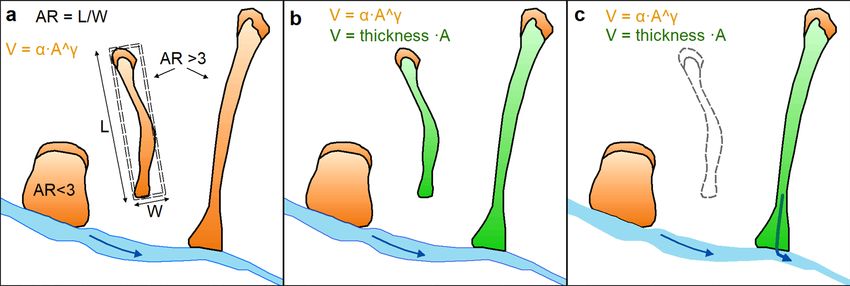
www.nature.com/scientificreports/
Figure 5. Mean vertical coseismic displacement (VCD, mm) computed in each 10 × 10 km cell of the study area
from ALOS-2 InSAR data (Supplementary Figure S4). Negative and positive values indicate ground subsidence
and uplift, respectively. Black lines indicate the districts in Nepal. The four sub-areas (1, 2, 3 and 4), identified
according to the displacement values, are shown. The vertical coseismic displacement is derived from the LOS
displacement developed by Lindsey et al.19. (The map was generated by using ArcGIS 10.3.1, http://www.esri.
com/).
AR Fitting function Landslide scar area (As, %)
10 As = 0.040A 4.0
Table 1. Linear functions describing the relationships between the scar area ( As) and the total landslide area
(A), for six different classes of the aspect ratio (AR). The percentages quantify the amount of landslide scar area
with respect to the total landslide area (see Supplementary Table S1).
m3, partially compensated by a landslide volume ranging
volume due to vertical displacement of 848 (± 421) M
between 132 (− 8/ + 9) M m3 (R1) and 315 (− 38/ + 43) M
m3 (R2) for V_ALL. With V_AR approach, the land-
3
slide volume decreases to 81 (± 4) Mm (R1) and 172 (− 19/ + 22) M m3 (R2), and to 49 (± 3) Mm3 (R1) and 110
(− 13/ + 15) Mm3 (R2) for V_AR_river (Table 2).
To evaluate the sensitivity of InSAR data from different satellites, the net volume change for the method
V_ALL R1 was calculated also with Sentinel-1 data. For a sub-area in which the two InSAR datasets are over-
lapping (Supplementary Figures S2, S3), the mean net change values amount to 1417 M m3 and 1841 M m3 for
ALOS-2 and Sentinel-1, respectively.
Discussion
This study allowed quantification of the net change in volume due to the 2015 Nepal earthquake and the trig-
gered landslides.
As stated in the introduction, our first hypothesis was that the contribution of erosion due to earthquake-
induced landslides should be small when compared to the amount of coseismic volume change in the study
area. The results confirm this hypothesis, showing that the landslide erosion ranges between 12 and 70% of the
vertical displacement depending on the adopted approaches. This is different from what was observed in other
earthquakes. For the Wenchuan 2008 earthquake, Li et al.16 found that the earthquake-induced landslides volume
might effectively offset the addition of coseismic volume. Due to a lower number of landslides with respect to the
Wenchuan 2008 earthquake (21,151 for our inventory vs 57,150 in Wenchuan 2008 according to Li et al.16) the
landslide volume of Nepal 2015 landslides is lower than the Wenchuan 2008 landslide volume, despite similarity
Scientific Reports | (2021) 11:3434 | https://doi.org/10.1038/s41598-021-83037-y 6
Vol:.(1234567890)www.nature.com/scientificreports/
Figure 6. Example of coseismic landslides mapped as polygons in Rasuwa District. (a) Satellite image from
Google Earth with pre-seismic condition (date 12/12/2014, map data: Google, 2020 CNES / Airbus, https://earth
.google.com/web/). (b) Satellite image from Google Earth, with an oblique view of the slope (date 5/25/2015,
map data: Google, 2020 Maxar Technologies, https://earth.google.com/web/). Orange line delineates the scar
sources. (c) Field photograph of the rotational slide made during the field activity carried out in October 2015
(photo by Frattini Paolo). The landslide on the west of the scar was not mapped in (b) because it was a post-
monsoon landslide. (The figure was generated by using Microsoft PowerPoint 2013, http://www.microsoft.
com/).
in moment magnitude ( Mw). In this analysis, we estimated a volume ranging from 251 (− 15/ + 16) M m3 (method
V_AR_river_R1) to 1503 (− 183/ + 210) Mm3 (method V_ALL_R2), while the volume of Wenchuan 2008 land-
slides was estimated as high as 2800 (− 700/ + 900) M m3 (Li et al. 2014). In any case, the total landslide volume
associated to the Nepal earthquake fits the empirical landslide volume/earthquake magnitude curves proposed
in the l iterature2,9,10 (see Supplementary Figure S4), as also found by Roback et al.17.
The overall net volume change is positive for the whole study area, thus demonstrating that the 2015 Nepal
earthquake is net constructional for the Nepal Himalayan belt. This is observable considering both the whole
area and the sub-areas. Sub-area 1 and sub-area 4 show a greater contribution of landslide volume, essentially
due to a higher concentration of landslides.
This positive balance is even larger if considering that most of the material eroded by landsliding remains
along the slopes or within the lower-order channel network for long periods, as observed for the Wenchuan
earthquake38,39. We have tried to roughly estimate the material that can be more easily evacuated from the
study area by fluvial transport by considering only landslides that reach the channel network (V_AR_river).
This amounts to a total volume ranging between 251 (− 15/ + 16) M m3 (R1) and 582 (− 72/ + 83) M m3 (R2),
corresponding to 40% and 77% of V_ALL R1 and V_AR R1, and 39% and 88% of V_ALL R2 and V_AR R2,
respectively. A more detailed analysis is recommended to define the channel network’s capability to remove
such material.
The second hypothesis of the paper is that the uncertainty related to either the landslide volume or the vertical
coseismic displacement is very high.
Regarding the landslide volume calculation, we identified and analysed four sources of uncertainty; the
first and second related to the choice of the empirical equations and the uncertainty about their parameters,
respectively; the third related to the landslide inventory; and the latter related to the approach adopted for the
assessment of elongated landslide volume.
As already reported in the literature6,8,17 the choice of the empirical area/volume equation introduces a large
source of uncertainty. In order to test this uncertainty, we adopted two different equations from Larsen et al.
(2010), the first for all the landslides (R1) and the second for mixed-debris and rock slides in Himalaya (R2)36.
For the method V_ALL the two equations return a mean value of landslide volumes of 628 M m3 and 1503 Mm3
for R1 and R2, respectively (Fig. 4a,b). This difference is due to the fact that the Larsen et al.’s36 equation for mixed
landslides in the Himalaya predicts landslides deeper with respect to the global dataset, especially for larger
landslides, with large values for both the α and γ scaling parameters of the power-law equation. The sensitivity
of the choice of empirical equation in volume estimation is lower for V_AR and V_AR_river due to the smaller
size of the scar areas with respect to the whole landslide area.
The uncertainty about the parameters of the empirical equations is reported in Larsen et al.36 and derives
from the dispersion of the empirical data used by the authors to obtain the equations. By propagating this
uncertainty in the calculation of the landslide volume erosion for the entire inventory we obtained a range of
variation ranging from a minimum of 4.9% (V_AR_R1, where the maximum variation is 16 M m3 with a mean
3
value of 324 Mm ) to a maximum of 14.3% (V_AR_river _R2, where the maximum variation is 83 M m3 with a
mean value of 582 Mm3).
The third source of uncertainty lies in the quality and completeness of the landslide inventory. To test and
quantify this uncertainty, we calculated the landslide volume from different inventories by applying the method
V_ALL R1. First of all, we used the online available landslide inventories for the 2015 Nepal e arthquake17,27,29.
Scientific Reports | (2021) 11:3434 | https://doi.org/10.1038/s41598-021-83037-y 7
Vol.:(0123456789)www.nature.com/scientificreports/
The landslide volumes calculated with these inventories show dramatic differences, with values varying from 6
Mm3 for Zhang et al.27 to 209 M m3 for Gnyawali and A dhikari29 to 343 M
m3 for Roback et al.17, and to 628 M
m3
27 29
for our inventory. The differences with Zhang et al. and Gnyawali and Adhikari are mainly due to a different
number of landslides in the inventories, especially for Zhang et al.27 which reports only 2645 landslides. The
difference with Roback et al.17 is due to the size of the landslides, which is slightly larger in our inventory (see
Supplementary Figure S5). The integration of Roback et al.17 landslides in our inventory in unmapped area, show
smaller differences in total landslide volumes due to a limited number of unmapped landslides, suggesting that
they are both almost complete.
A further comparison with volumes reported in Roback et al.17, ranging from 130 to 1270 M m3, and Xu et al.40,
equal to 964 M m3, confirms the strong controls of inventories and empirical relationships in the assessment of
the landslide volume.
The fourth source of uncertainty lies in the approach used for the volume computation of landslides with
high mobility and aspect ratio. These landslides are usually very shallow, with mass wasting occurring in the scar
area due to sliding or toppling that is successively fed by to erosion along the slope. Since the volume is typically
calculated by empirical equations starting from volume–area relationships, the choice of the appropriate area
or relationship is fundamental.
If the volume is calculated by using the entire landslide area (i.e. V_ALL), the empirical equation would yield
a depth that is too large for shallow elongated landslides, resulting in a strong overestimation of the volumes.
This may have partially occurred in Parker et al.6,41 leading to possible incorrect estimate of the landslide volume.
On the other side, volumes calculated by considering only the scar area would neglect (or account for it only
implicitly) the entrainment of material occurring along the runout zone, which may be considerable for long-
runout landslides such as debris fl ows42,43.
For this reason, we tested in this paper a hybrid approach for long-runout landslides, consisting of decoupling
the volume of the scar source (V_AR and V_AR_river) and the contribution of erosion along the runout zone.
We believe this approach to be more realistic in the description of the mechanisms responsible for mass wast-
ing of long runout landslides, such as debris flows, although there is a strong uncertainty on the erosion depth,
which depends on local geologic and soil conditions. However, as shown in Fig. 4a,b, the volumes calculated by
decoupling the initial scar and the transport erosion are always much lower with respect to the V_ALL method,
also considering different erosion thicknesses along the runout (from 0.5 to 3 m). For instance, by using equation
R1, the volume calculated by decoupling scar area and runout ranges from 283 to 490 M m3 for V_AR method,
3
versus 628 Mm for the V_ALL method. This difference is even larger for R2, due to the effects of the different
scaling parameters. For a more accurate estimate of the volume, a detailed analysis of the soil thickness would
be necessary.
Regarding the vertical coseismic displacement, we adopted for the LOS displacement a RMSE of 54 mm
according to Wang and F ialko37 to define the uncertainty on the volume estimation. This uncertainty is able to
control the uncertainty on the final net volume change estimate being even two orders of magnitude higher than
the uncertainty defined for the landslide volumes.
In addition, we analysed the degree of uncertainty associated to the choice of the InSAR dataset, obtaining
a difference of about 20% between the ALOS-2 and Sentinel-1, with net volume change values of 1417 Mm3
and 1841 M m3, respectively. To assess the reliability of the calculated vertical coseismic displacement, we also
compared these InSAR-derived data with vertical GPS records22. As shown in Supplementary Figure S3, both
ALOS-2 and Sentinel-1 show a very good agreement with GPS data. This validates the use of ALOS-2 data for
the characterization of the vertical coseismic displacement in the study area.
Conclusion
The main findings of the paper are:
• the volume balance of the 2015 Nepal earthquake is strongly dominated by tectonic displacement, with
landside erosion being only a small fraction of the overall balance.
• The uncertainties in the calculation of landslide volumes are manifold, and very high. We identified and
quantified uncertainties related to the choice of the empirical equations and the uncertainty about their
parameters, the completeness and quality landslide inventory, the approach adopted for the assessment of
elongated landslide volume, and the InSAR displacement data. In fact, these uncertainties can be as high as
the volume itself.
• The different landslide types may require different approaches for the calculation of the volume. We argue
in this paper that the classical approach based on empirical area/volume equation may be unsuitable for
elongated landslides. We tested a new method decoupling the scar area and the runout components of the
volume. With this method, we demonstrate that, although the results are very uncertain due to the difficulty
to estimate the erosion thickness, the classical approach tends to overestimate the volumes for such landslides.
Methodology
Landslide mapping. The landslide inventory was prepared through manual mapping of landslide poly-
gons based on multi-temporal Google Earth and Google Crisis Imagery from May 2, 2015 to June 6, 2015.
Google Crisis imagery included DigitalGlobe WorldView-2, WorldView-3, and Airbus Pleiades imagery. Also
helicopter-based videos recorded by U SGS44 and OM (Operation Mobilisation) Nepal were used. The inventory
was prepared at 1:2000 scale to avoid undersampling of small landslides, especially away from the seismic source.
Smaller landslides, in fact, are not systematically accessible and could be easily censored or amalgamated, even
with recent i magery33,45. Due to the presence of clouds or low quality images about 1500 k m2 out of 26,240 k m2
Scientific Reports | (2021) 11:3434 | https://doi.org/10.1038/s41598-021-83037-y 8
Vol:.(1234567890)www.nature.com/scientificreports/
Study area Sub-area1 Sub-area2 Sub-area3 Sub-area4
Net volume change (Mm3)
ALOS-2 Coseismic volume
2134 (± 1269) − 1309 (± 394) 2649 (± 362) − 54 (± 92) 848 (± 421)
change (Mm3)
V_ALL_R1 1506 (− 1308/ + 1311) − 1752 (− 422/ + 424) 2598 (± 365) − 57 (± 92) 716 (− 429/ + 430)
V_ALL_R2 630 (− 1452/ + 1479) − 2375 (− 525/ + 545) 2531 (− 375/ + 377) − 59 (± 93) 533 (− 459/ + 464)
V_AR_R1 1809 (− 1284/ + 1285) − 1521 (− 404/ + 405) 2619 (± 363) − 55 (± 92) 767 (± 425)
V_AR_R2 1473 (− 1339/ + 1350) − 1738 (− 439/ + 446) 2591 (− 367/ + 368) − 56 (± 92) 676 (− 440/ + 443)
V_AR_river_R1 1882 (− 1284/ + 1285) − 1500 (− 406/ + 407) 2637 (± 363) − 55 (± 92) 799 (± 424)
V_AR_river_R2 1551 (− 1341/ + 1352) − 1757 (− 450/ + 459) 2625 (± 365) − 55 (± 92) 738 (− 434/ + 436)
Table 2. Net volume change (Mm3) correlating the coseismic volume change due to the earthquake and the
earthquake-induced landslides volume. The data are reported both for the whole study area and for the three
sub-areas identified that represent portions of the study area characterized by different uplift and subsidence
rates (see Fig. 7). The coseismic volume change from ALOS-2 is reported for comparison in the first line.
R1 global relationship for all landslide types, R2 relationship for mixed bedrock and soil landslides in the
Himalaya36. The range of variation is propagated from the uncertainty on the ALOS-2 coseismic volume
change and landslide volume.
remained unmapped (Fig. 1). Field checks of a small part of the landslide inventory were carried out in Octo-
ber 2015 in the Rasuwa and Sindhupalchok districts and a subsequent validation based on the photos taken
on the field was carried out (Fig. 6b,c). About 5% of the landslides in the two districts were checked on site
(~ 500 landslides). During the field activities, information provided by locals allowed to recognize and ignore
the monsoon-induced landslides. The size frequency distribution of the inventory is reported in Supplementary
Figure S5. To manage manual mapping consistency of interpretation and reduce possible errors, the inventory
was entirely mapped by a single geomorphologist, but crosschecked with other expert mappers and by using all
the available data.
Landslide scar area. In order to extract the scar size (i.e. the source area of the detachment) from the land-
slide size, a subset of 1500 landslides located in the central part of the inventory area (Fig. 1) was analysed for
detailed mapping of the scar based on high-resolution imagery available in Google Earth (~ 7% of the inventory,
Fig. 1) selected on the basis of the image quality and to provide a representative population of the different types.
For such representative subset, both the scar ratio (i.e. the slope of the best-fitting linear regression between scar
area and total landslide area) and the aspect ratio (AR, the ratio between the landslide length and width) were
calculated.
The shape of the landslide was characterized by the aspect ratio (AR), which is defined as the ratio between
the landslide length (L) and the landslide width (W) and computed by enveloping the landslide polygons with
bounding rectangles46,47. Based on this aspect ratio, the landslides were classified into six classes (< 2, 2–4, 4–6,
6–8, 8–10, and > 10). For each class, a different linear function relating the total landslide area with the scar area
was defined (Fig. 2; Table 1). These equations were applied to all the landslide inside the inventory to assess the
landslides scar areas.
Landslide volume and erosion. To analyse the amount of landslide material removed by the earthquake,
the area that corresponds to the envelope of the earthquake-induced landslide inventory was divided into a lat-
tice (235 cells) with a dimension of 10 × 10 km. For each cell of the lattice, three different values of volume eroded
by landslides were calculated (Fig. 7):
• V_ALL: the volume was defined for all the landslides inside the inventory by using the empirical area/vol-
ume relationship by Larsen et al.36 considering the total area of each landslide ( Ai), without any distinction
between scar and runout a reas36 (Fig. 7a):
n
γ
Vtot = α · Ai (1)
1
where Vtot is the total volume for all landslides, n is the number of landslides and the scaling parameters α
and γ are constants that vary as a function of the geological and geomorphological settings and the hillslope
process. The constants α and γ used in this work are those proposed by Larsen et al.36 as a global relationship
for all kinds of landslide (R1) and a relationship for mixed bedrock and soil landslides in the Himalaya (R2).
Although the empirical area/volume relationship proposed by Lacroix28 refers to the 2015 Nepal landslides,
it is limited to Langtang valley and was not used because we believe it may be too local scale to be representa-
tive for the entire dataset.
• V_AR: the inventory was divided into elongated (AR > 3) and non-elongated (AR ≤ 3) landslides. For non-
elongated landslides, the area/volume relationships R1 and R2 were applied to the total area (as for V_ALL).
For elongated landslides, the volume was calculated by decoupling the scar from the erosion along the runout.
The scar contribution was calculated with area/volume relationships (R1 and R2) applied to the scar area
Scientific Reports | (2021) 11:3434 | https://doi.org/10.1038/s41598-021-83037-y 9
Vol.:(0123456789)www.nature.com/scientificreports/
Figure 7. Schematic representation of the three methods for volume calculation. (a) V_ALL: Larsen et al.36
relationship was applied to the entire landslide area with the two parameterizations (R1 and R2)36. (b) V_AR:
Larsen et al.36 for landslides with AR < 3, and for scar area of landslide with AR > 3; for the runout of landslides
with AR > 3, the volume was defined as the area multiplied for the thickness. (c) The methodologies were applied
to landslides that overlap the river network with the same method of “b” case”.
only (Fig. 7b), while the contribution of erosion along the runout was calculated by assuming an erosion
thickness of 0.5, 1 and 3 m. This range of values was adopted based on field observations and assuming an
erosion depth corresponding to the soil thickness48–50.
• V_AR_river: the volume was defined only for landslides that overlap the channel network (i.e. 23% out of
total inventory) by using the same approach V_AR (Fig. 7c). To be conservative, a raster-based criterion was
adopted to identify all landslides that overlap directly with the channel network, defined by calculating the
flow accumulation parameters from the Shuttle Radar Topographic Mission (SRTM) GDEM (Global Digital
Elevation Model) with a resolution of 3 arc second (about 90 m resolution, SRTM-3)51,52. A drainage area
of ~ 0.48 km2 (~ 60 contributing cells), as proposed by Roback et al.17 was selected.
The uncertainty on the volume estimation was assessed with mean values ± 16th and 84th percentiles of 10,000
times Monte Carlo sampling for α and γ parameters.
Starting from these volumes and considering the area of each cell, the mean erosion ( Ecell) is calculated as
(Fig. 3):
Ecell = Vtot /Acell (2)
where Acell is the lattice cell area (10 km × 10 km) and Vtot is the total volume of all the landslides located in each
cell of the lattice.
Mean vertical coseismic displacement. Inside each cell of the lattice, the mean vertical coseismic dis-
placement (VCD) due to tectonic displacement is given by:
n
VCDx Ax
VCDcell = x=1 (3)
Acell
where the numerator corresponds to the coseismic volume change; A x is the ALOS-2 grid-cell area (88 × 88 m);
VCDx is the vertical displacement in each ALOS-2 cell; n is the total number of cells. This value corresponds to the
average of the VCDx within the lattice cells. VCDx represents the vertical displacement only, and was calculated
by dividing the LOS displacement by the cosine of the incidence angle, that ranges from 27° to 49° from West
to East for the five s ubswaths19. This simplified calculation was possible because the LOS vector resulting from
the descending geometry of ALOS-2 is nearly parallel to the strike of the Main Frontal Thrust, thus reflecting
only the vertical displacement.
Comparison among different inventories. The method V_ALL R1 was applied to three published
inventories available online (https://www.sciencebase.gov/catalog/item/587352ebe4b0a829a31e309a, see Sup-
plementary Figure S1):
• Zhang et al.27 (2645 landslides).
• Gnyawali and Adhikari 29 (17,638 landslides).
• Roback et al. 17 (24,915 landslides).
• integration in our inventory of landslides in Roback et al.17 that are located in areas (1500 km2 out of 26,240
km2) unmapped due to the presence of clouds or a very high distortion of aerial images (21,654 landslides).
Scientific Reports | (2021) 11:3434 | https://doi.org/10.1038/s41598-021-83037-y 10
Vol:.(1234567890)www.nature.com/scientificreports/
Received: 20 July 2020; Accepted: 25 January 2021
References
1. Avouac, J. P. Dynamic processes in extensional and compressional settings-mountain building: From earthquakes to geological
deformation. Treatise Geophys. 6, 377–439 (2008).
2. Keefer, D. K. The importance of earthquake-induced landslides to long-term slope erosion and slope-failure hazards in seismically
active regions. Geomorphology 10, 265–284 (1994).
3. Hovius, N., Stark, C. P. & Allen, P. A. Sediment flux from a mountain belt derived by landslide mapping. Geology 25(3), 231–234
(1997).
4. Densmore, A. L., Ellis, M. A. & Anderson, R. S. Landsliding and the evolution of normal-fault-bounded mountains. J. Geophys.
Res. Solid Earth 103(B7), 15203–15219 (1998).
5. Hovius, N., Stark, C. P., Hao-Tsu, C. & Jiun-Chuan, L. Supply and removal of sediment in a landslide-dominated mountain belt:
Central Range, Taiwan. J. Geol. 108(1), 73–89 (2000).
6. Parker, R. N. et al. Mass wasting triggered by the 2008 Wenchuan earthquake is greater than orogenic growth”. Nat. Geosci. 4(7),
449 (2011).
7. Meunier, P., Hovius, N. & Haines, A. J. Regional patterns of earthquake-triggered landslides and their relation to ground motion.
Geophys. Res. Lett. 34, 20 (2007).
8. Xu, C., Xu, X., Shyu, J. B. H., Zheng, W. & Min, W. Landslides triggered by the 22 July 2013 Minxian-Zhangxian, China, Mw 5.9
earthquake: Inventory compiling and spatial distribution analysis. J. Asian Earth Sci. 92, 125–142 (2014).
9. Malamud, B. D., Turcotte, D. L., Guzzetti, F. & Reichenbach, P. Landslides, earthquakes, and erosion. Earth Planet. Sci. Lett.
229(1–2), 45–59 (2004).
10. Marc, O., Hovius, N., Meunier, P., Gorum, T. & Uchida, T. A seismologically consistent expression for the total area and volume
of earthquake-triggered landsliding. J. Geophys. Res. Earth Surf. 121(4), 640–663 (2016).
11. Valagussa, A., Marc, O., Frattini, P. & Crosta, G. B. Seismic and geological controls on earthquake-induced landslide size”. Earth
Planet. Sci. Lett. 506, 268–281 (2019).
12. Medwedeff, W. G., Clark, M. K., Zekkos, D. & West, A. J. Characteristic landslide distributions: An investigation of landscape
controls on landslide size. Earth Planet. Sci. Lett. 539, 116203 (2020).
13. Marc, O., Hovius, N. & Meunier, P. The mass balance of earthquakes and earthquake sequences. Geophys. Res. Lett. 43(8), 3708–3716
(2016).
14. Hovius, N. et al. Prolonged seismically induced erosion and the mass balance of a large earthquake. Earth Planet. Sci. Lett. 304(3–4),
347–355 (2011).
15. Barlow, J. et al. Seismically-induced mass movements and volumetric fluxes resulting from the 2010 Mw= 7.2 earthquake in the
Sierra Cucapah, Mexico. Geomorphology 230, 138–145 (2015).
16. Li, G. et al. Seismic mountain building: Landslides associated with the 2008 Wenchuan earthquake in the context of a generalized
model for earthquake volume balance. Geochem. Geophys. Geosyst. 15(4), 833–844 (2014).
17. Roback, K. et al. The size, distribution, and mobility of landslides caused by the 2015 Mw7. 8 Gorkha earthquake, Nepal. Geomor-
phology 301, 121–138 (2018).
18. Marc, O. et al. Long-term erosion of the Nepal Himalayas by bedrock landsliding: The role of monsoons, earthquakes and giant
landslides. Earth Surf. Dyn. 7(1), 107–128 (2019).
19. Lindsey, E. O. et al. Line of sight deformation from ALOS-2 interferometry: Mw 7.8 Gorkha earthquake and Mw 7.3 aftershock.
Geophys. Res. Lett. 42, 20 (2015).
20. Elliott, J. R. et al. Himalayan megathrust geometry and relation to topography revealed by the Gorkha earthquake. Nat. Geosci.
9(2), 174–180 (2016).
21. Duan, H., Wu, S., Kang, M., Xie, L. & Chen, L. Fault slip distribution of the 2015 Mw7.8 Gorkha (Nepal) earthquake estimated
from InSAR and GPS measurements. J. Geodyn. 139, 101767 (2020).
22. Galetzka, J. et al. Slip pulse and resonance of the Kathmandu basin during the 2015 Gorkha earthquake, Nepal”. Science 349(6252),
1091–1095 (2015).
23. Wilkinson, S. et al. The 2015 Gorkha Nepal earthquake: Insights from earthquake damage survey. Front. Built Environ. 1, 8 (2015).
24. Avouac, J. P., Meng, L., Wei, S., Wang, T. & Ampuero, J. P. Lower edge of locked Main Himalayan Thrust unzipped by the 2015
Gorkha earthquake. Nat. Geosci. 8(9), 708–711 (2015).
25. Kargel, J. S. et al. Geomorphic and geologic controls of geohazards induced by Nepal’s 2015 Gorkha earthquake. Science 351, 6269
(2016).
26. Robinson, T. R. et al. Rapid post-earthquake modelling of coseismic landslide magnitude and distribution for emergency response
decision support. Nat. Hazards Earth Syst. Sci. Discuss. 17, 1521–1540 (2017).
27. Zhang, J. Q. et al. Characteristics of landslide in Koshi River basin, central Himalaya. J. Mt. Sci. 13(10), 1711–1722 (2016).
28. Lacroix, P. Landslides triggered by the Gorkha earthquake in the Langtang valley, volumes and initiation processes. Earth Planets
Sp. 68(1), 46 (2016).
29. Gnyawali, K. R., and Adhikari, B. R. Spatial relations of earthquake induced landslides triggered by 2015 Gorkha earthquake Mw=
7.8. In Workshop on World Landslide Forum. Springer, Cham. 85–93 (2017).
30. Martha, T. R., Roy, P., Mazumdar, R., Govindharaj, K. B. & Kumar, K. V. Spatial characteristics of landslides triggered by the 2015
Mw 7.8 (Gorkha) and Mw 7.3 (Dolakha) earthquakes in Nepal. Landslides 14(2), 697–704 (2017).
31. Xu, C. Landslides triggered by the 2015 Gorkha, Nepal Earthquake. International archives of the photogrammetry. Remote Sens.
Spat. Inf. Sci. 42, 3 (2018).
32. Valagussa, A., Frattini, P., Crosta, G. B. & Valbuzzi, E. Pre and post 2015 Nepal earthquake landslide inventories. In Landslides and
Engineered Slopes. Experience, Theory and Practice 1957–1964 (CRC Press, New York, 2018).
33. Marc, O. & Hovius, N. Amalgamation in landslide maps: Effects and automatic detection. Nat. Hazards Earth Syst. Sci. Discuss.
15(15), 723–733 (2015).
34. Williams, J. G. et al. Satellite-based emergency mapping using optical imagery: Experience and reflections from the 2015 Nepal
earthquakes. Nat. Hazards Earth Syst. Sci. 18(1), 185–205 (2018).
35. Xu, C. et al. Optimized volume models of earthquake-triggered landslides. Sci. Rep. 6, 29797 (2016).
36. Larsen, I. J., Montgomery, D. R. & Korup, O. Landslide erosion controlled by hillslope material. Nat. Geosci. 3(4), 247 (2010).
37. Wang, K. & Fialko, Y. Slip model of the 2015 Mw 7.8 Gorkha (Nepal) earthquake from inversions of ALOS-2 and GPS data. Geophys.
Res. Lett. 42(18), 7452–7458 (2015).
38. Fan, X. et al. Spatio-temporal evolution of mass wasting after the 2008 Mw 7.9 Wenchuan earthquake revealed by a detailed multi-
temporal inventory. Landslides 15(12), 2325–2341 (2018).
39. Zhang, S., Zhang, L., Lacasse, S. & Nadim, F. Evolution of mass movements near epicentre of Wenchuan earthquake, the first eight
years. Sci. Rep. 6(1), 1–9 (2016).
40. Xu, C. Landslides triggered by the 2015 Gorkha, Nepal earthquake. International archives of the photogrammetry. Remote Sens.
Spat. Inf. Sci. 20, 42–43 (2018).
Scientific Reports | (2021) 11:3434 | https://doi.org/10.1038/s41598-021-83037-y 11
Vol.:(0123456789)www.nature.com/scientificreports/
41. Xu, C., Xu, X., Gorum, T., van Westen, C. J. & Fan, X. Did the 2008 Wenchuan earthquake lead to a net volume loss? In Landslide
Science for a Safer Geoenvironment 191–196 (Springer, Cham, 2014).
42. Chen, H., Crosta, G. B. & Lee, C. F. Erosional effects on runout of fast landslides, debris flows and avalanches: A numerical inves-
tigation. Geotechnique 56(5), 305–322 (2006).
43. Hungr, O., McDougall, S. & Bovis, M. Entrainment of material by debris flows. In Debris-Flow Hazards and related phenomena
135–158 (Springer, Berlin, 2005).
44. Collins, B.D. & Jibson, R.W. Assessment of existing and potential landslide hazards resulting from the April 25, 2015 Gorkha,
Nepal earthquake sequence (No. 2015-1142). US Geological Survey. https://pubs.er.usgs.gov/publication/ofr20151142 (2015).
45. Stark, C. P. & Hovius, N. The characterization of landslide size distributions. Geophys. Res. Lett. 28(6), 1091–1094 (2001).
46. Taylor, F. E., Malamud, B. D., Witt, A. & Guzzetti, F. Landslide shape, ellipticity and length-to-width ratios. Earth Surf. Proc. Land.
43(15), 3164–3189 (2018).
47. Tian, Y., Xu, C., Chen, J., Zhou, Q. & Shen, L. Geometrical characteristics of earthquake-induced landslides and correlations with
control factors: A case study of the 2013 Minxian, Gansu, China, Mw 5.9 event. Landslides 14(6), 1915–1927 (2017).
48. Dahal, R. K. et al. Comparative analysis of contributing parameters for rainfall-triggered landslides in the Lesser Himalaya of
Nepal. Environ. Geol. 58(3), 567–586 (2009).
49. Dahal, R. K., Hasegawa, S. H. U. I. C. H. I., Yamanaka, M. I. N. O. R. U. & Nishino, K. Rainfall triggered flow-like landslides:
Understanding from southern hills of Kathmandu, Nepal and northern Shikoku, Japan. Proceedings of 10th International Congr
of IAEG, The Geological Society of London, IAEG2006 Paper, (819), 1–14. (2006).
50. West, A. J. et al. High natural erosion rates are the backdrop for present-day soil erosion in the agricultural Middle Hills of Nepal.
Earth Surf. Dyn. 3(3), 363 (2015).
51. Farr, T. G. et al. The shuttle radar topography mission. Rev. Geophys. 45, 2 (2007).
52. Hayakawa, Y. S., Oguchi, T. & Lin, Z. Comparison of new and existing global digital elevation models: ASTER G-DEM and SRTM-
3. Geophys. Res. Lett. 35, 17 (2008).
Acknowledgements
The manuscript was strongly improved following the comments and the suggestions by A. Densmore and two
anonymous reviewers. We thank the non-governmental organisation ASIA onlus for supporting the field activi-
ties in the Rasuwa and Sindhupalchok districts, and the International Organization for Migration (IOM) Nepal
for financing part of the research. This work has been supported by Fondazione Cariplo, Grant no. 2016-0769
and the MIUR—Dipartimenti di Eccellenza Project.
Author contributions
A.V., P.F., and G.C. designed the study. A.V. and E.V. prepared the inventory of earthquake-induced landslides.
A.V. and P.F. perform the log-term erosion analysis. A.V. performed all other analyses. A.V. wrote the manuscript
with input from all authors.
Competing interests
The authors declare no competing interests.
Additional information
Supplementary Information The online version contains supplementary material available at https://doi.
org/10.1038/s41598-021-83037-y.
Correspondence and requests for materials should be addressed to A.V.
Reprints and permissions information is available at www.nature.com/reprints.
Publisher’s note Springer Nature remains neutral with regard to jurisdictional claims in published maps and
institutional affiliations.
Open Access This article is licensed under a Creative Commons Attribution 4.0 International
License, which permits use, sharing, adaptation, distribution and reproduction in any medium or
format, as long as you give appropriate credit to the original author(s) and the source, provide a link to the
Creative Commons licence, and indicate if changes were made. The images or other third party material in this
article are included in the article’s Creative Commons licence, unless indicated otherwise in a credit line to the
material. If material is not included in the article’s Creative Commons licence and your intended use is not
permitted by statutory regulation or exceeds the permitted use, you will need to obtain permission directly from
the copyright holder. To view a copy of this licence, visit http://creativecommons.org/licenses/by/4.0/.
© The Author(s) 2021
Scientific Reports | (2021) 11:3434 | https://doi.org/10.1038/s41598-021-83037-y 12
Vol:.(1234567890)You can also read