San Pedro Creek and Pacifica State Beach Bacteria TMDL Best Management Practices Implementation Plan and Monitoring Plan Update
←
→
Page content transcription
If your browser does not render page correctly, please read the page content below
San Pedro Creek and Pacifica State
Beach Bacteria TMDL Best
Management Practices
Implementation Plan and Monitoring
Plan Update
Submitted in Compliance with Provision C.14.b.iii(1)(e) of the California Regional
Water Quality Control Board San Francisco Bay Region Municipal Regional
Stormwater National Pollutant Discharge Elimination System (NPDES) Permit
(Order No. R2-2015-0049, NPDES Permit No. CAS612008)

Prepared by:

City of Pacifica
170 Santa Maria Avenue
Pacifica, CA 94044

County of San Mateo
400 County Center
Redwood City, CA 94063

                                                                June 26, 2020
Contents
Introduction .................................................................................................................................................. 3
   Regulatory Background ............................................................................................................................. 4
       Beneficial Uses and Water Quality Objectives...................................................................................... 4
       Total Maximum Daily Load ................................................................................................................... 7
   Environmental Setting ............................................................................................................................ 13
       San Pedro Creek Watershed ............................................................................................................... 13
       Pacifica State Beach ............................................................................................................................ 14
Wasteload Allocation Attainment Assessment........................................................................................... 16
   Compliance Monitoring .......................................................................................................................... 16
   Pacifica State Beach Compliance Monitoring ......................................................................................... 17
   San Pedro Creek Compliance Monitoring ............................................................................................... 17
   Characterization Monitoring ................................................................................................................... 18
   Assessment Recommendations .............................................................................................................. 18
Revised Implementation Tasks ................................................................................................................... 19
   Summary Table ....................................................................................................................................... 21
Revised Monitoring Plan ............................................................................................................................. 27
Appendices.................................................................................................................................................. 27
   April 2015 BMP Implementation Plan and Monitoring Plan .................................................................. 27
Introduction
This Best management Practices (BMP) implementation plan and water quality monitoring plan report
update is submitted to fulfill the reporting requirements of Provision C.14 of the Municipal Region
Permit (MRP).

San Pedro Creek and Pacifica State Beach, located along the Pacific Ocean in San Mateo County,
California (Figure 1), are listed as impaired water bodies on the Clean Water Act (CWA) 303(d) list due to
high densities of fecal indicator bacteria (FIB) (e.g., fecal coliform, total coliform, Escherichia coli,
enterococcus) measured in water samples. High indicator bacteria densities suggest the presence of
fecal contamination from wildlife (e.g., birds, deer, raccoons), humans, and/or domestic warm-blooded
animals (e.g., dogs, horses). Fecal contamination from some of these sources (primarily humans) is
associated with pathogens that, when present, pose potential health risks to people who ingest water
from contaminated water bodies and may result in impairment of the water contact recreation (REC-1)
Beneficial Use. The source of fecal contamination is critical to understanding the associated human
health risk since the amount of risk varies depending on the fecal source. In most cases, human sources
are associated with much higher risk than wildlife or domestic animal sources (USEPA 2012).

On November 14, 2012, the San Francisco Bay Regional Water Quality Control Board (Regional Water
Board) adopted the San Pedro Creek and at Pacifica State Beach Bacteria TMDL to address the FIB-based
impairments. An amendment to the Water Quality Control Plan for the San Francisco Bay Basin (Basin
Plan; Regional Water Board 2013) establishing the TMDL was approved by the State Water Resources
Control Board (State Water Board) on March 19, 2013, by the State Office of Administrative Law on June
24, 2013, and by the U.S. Environmental Protection Agency (USEPA) on August 1, 2013. The Basin Plan
Amendment, which became effective on October 1, 2013, is included as Appendix A.

The San Pedro Creek and Pacifica State Beach Bacteria TMDL establishes load allocations and wasteload
allocations in terms of allowable exceedances of water quality objectives for indicator bacteria in marine
and freshwater measured at two compliance points. The TMDL Implementation Plan (Section 7.4.1.6 of
the Basin Plan) specifies actions needed to attain the TMDL and allocations and requires that they are
described in a BMP Implementation Plan. The TMDL also requires development and implementation of
a bacteria water quality monitoring plan for the San Pedro Creek watershed to 1) better characterize
bacteria contributions; and 2) to assess compliance with wasteload allocations. This report contains
both the monitoring plan and BMP Implementation Plan. The San Pedro Creek and Pacifica State Beach
Bacteria Monitoring Plan (Monitoring Plan) describes a monitoring program that will address these goals
and will be implemented collaboratively by the City of Pacifica (City) and the County of San Mateo
(County). The BMP Implementation Plan describes specific actions that the City and County will
implement to attain the TMDL.

The introduction of this report (Section 1.0) summarizes the regulatory background, including the TMDL,
and describes the environmental setting. Section 2.0 contains the BMP Implementation Plan, including
existing and proposed BMPs. Section 3.0 contains the compliance and characterization Monitoring
Plan, including data evaluation. Section 4.0 summarizes the tasks, schedule, and milestones that will be
implemented collaboratively by the City and County to meet the TMDL. References used in this report
are cited in Section 5.0.

Figure 1. San Pedro Creek watershed and Pacifica State Beach location map.

Regulatory Background
Beneficial Uses and Water Quality Objectives
The State Water Board is part of the California Environmental Protection Agency and administers water
rights, water pollution control, and water quality functions for the state. It shares authority for
implementation of the federal CWA and the state Porter-Cologne Act with the nine Regional Water
Boards. The nine Regional Water Quality Control Boards regulate surface water and groundwater
quality through development and enforcement of Water Quality Objectives (WQOs) and
implementation of plans that will protect the Beneficial Uses of the State’s waters. The Basin Plans
designate Beneficial Uses, WQOs that ensure the protection of those uses, and programs of
implementation to achieve WQOs.

The Water Quality Control Plan for Ocean Waters of California (State Water Board 2012; Ocean Plan)
provides the basis for protection of the quality of ocean waters. It is implemented by the State Water

Board and the six coastal Regional Water Quality Control Boards. The Ocean Plan identifies Beneficial
Uses of California’s ocean waters, establishes narrative and numerical WQOs protective of those
Beneficial Uses, identifies areas where discharges are prohibited, and sets forth a program of
implementation to ensure that ocean water WQOs are achieved and Beneficial Uses are protected.

Several Beneficial Uses are designated for San Pedro Creek and Pacifica State Beach including water
contact recreation (REC-1) and noncontact water recreation (REC-2), which are defined in the Basin Plan
as:

    •   REC-1: “Uses of water for recreational activities involving body contact with water where
        ingestion of water is reasonably possible. These uses include, but are not limited to, swimming,
        wading, water-skiing, skin and scuba diving, surfing, whitewater activities, fishing, and uses of
        natural hot springs.”

    •   REC-2: “Uses of water for recreational activities involving proximity to water, but not normally
        involving contact with water where water ingestion is reasonably possible. These uses include,
        but are not limited to, picnicking, sunbathing, hiking, beachcombing, camping, boating, tide pool
        and marine life study, hunting, sightseeing, or aesthetic enjoyment in conjunction with the above
        activities.”

REC-1 use of water with fecal contamination could cause gastrointestinal and other types of illnesses if
pathogens (i.e., certain viruses, bacteria, or protozoa) are present. Testing water samples for specific
pathogens is generally not practical for a number of reasons (e.g., concentrations of pathogens from
fecal contamination may be small but still of concern, laboratory analysis is often difficult and expensive,
and the number of possible pathogens is large). Therefore, the presence of pathogens is inferred by
testing for “pathogen indicator” organisms. Since the 1950’s, numerous epidemiological investigations
have been conducted to evaluate the relationship between illness rates and suitable pathogen or fecal
indicators. The United States Environmental Protection Agency (USEPA) recommends using E. coli and
enterococci as indicators of fecal contamination based on historical and recent epidemiological studies
(USEPA 2012).

The Basin Plan (2013) Table 3-1 establishes REC-1 WQOs for fecal coliform, total coliform, and
enterococci, and REC-2 WQOs for fecal coliform. Table 3-2 of the Basin Plan refers to USEPA (1986) for
E. coli and enterococci ambient water quality criteria. The Ocean Plan (2012) establishes REC-1 WQOs
for total coliform, fecal coliform, and enterococci in ocean water that are identical to California
Department of Public Health (CDPH) standards and that equate to USEPA (1986) ambient water quality
criteria for enterococci in marine water. Criteria listed by both agencies are based on sampling
protocols where five equally-spaced samples are collected over a 30-day period and the geometric mean
(GM) is calculated. A statistical threshold value (STV) is also listed. The STV is intended to be a value
that should not be exceeded by more than a designated percentage of the samples used to calculate the
GM, but is typically used as a single sample maximum (SSM) by regulators. Basin Plan (2013) and Ocean
Plan (2012) WQOs for pathogen indicators in freshwater/estuarine water and ocean water are listed in
Table 1. WQOs referenced in the TMDL are shown in bold font in Table 1.

The USEPA (1986) ambient water quality criteria for E. coli and enterococci were derived from
epidemiological studies of bathers recreating at surface water beaches that received bacteriological
contamination via treated human wastewater. The criteria distinguish between different levels of beach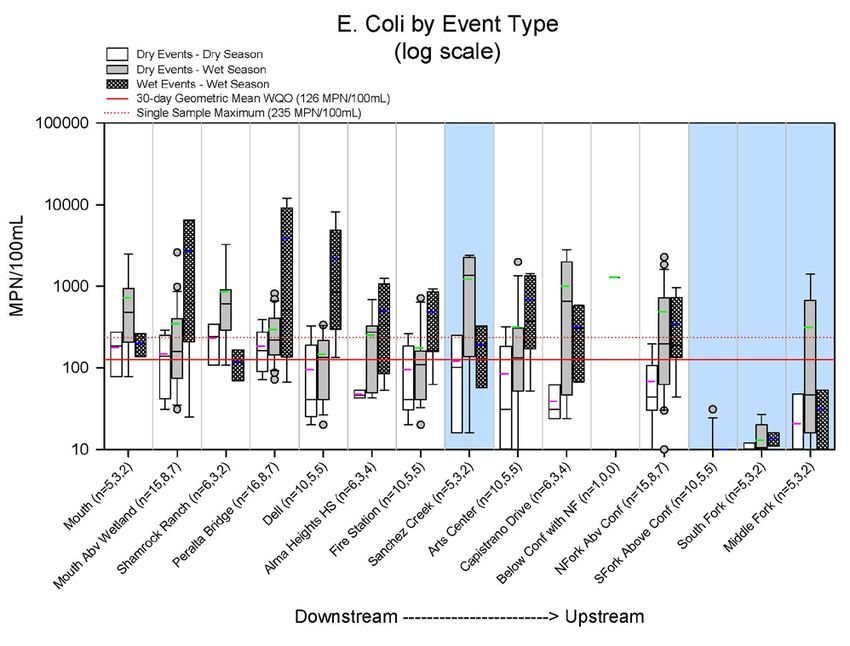
usage and establish STVs corresponding to the 75th, 82nd, 90th, and 95th percentiles of the expected
water quality sampling distribution. The San Pedro Creek and Pacifica State Beach Bacteria TMDL
adopts the most conservative “designated bathing beach” criteria (i.e., 75th percentile STV). In 2012,
USEPA published new recreational water quality criteria that supersede the 1986 recommendations.
Neither the Basin Plan (2013) nor the Ocean Plan (2012) have been updated to reference or reflect the
new USEPA (2012) criteria 1. The USEPA (2012) GM criteria remain similar to 1986 criteria; however, the
SSM (or STV) no longer distinguishes between different levels of beach usage and is set at the updated
90th percentile STV. USEPA (2012) considers the 90th percentile protective of all primary contact
recreation. USEPA (2012) also suggests a Beach Action Value (BAV) as a conservative, precautionary tool
for making beach notification decisions. The BAV is not a recommended water quality criterion, but
could be used as a “do not exceed” value for beach advisories. The more conservative BAV for E. coli in
freshwater is equal to the “designated bathing beach” (75th percentile STV) criteria from USEPA (1986).

Table 1. Bacteriological objectives and criteria for water recreation in freshwater and ocean water.
                                  Freshwater/Estuarine                                Ocean/Marine Water
                     Total          Fecal                                     Total         Fecal
                                                E. coli      Enterococci                               Enterococci
                    Coliform      Coliform                                   Coliform      Coliform
                  (MPN/100ml)    (MPN/100ml)   (CFU/100ml)   (CFU/100ml)   (MPN/100ml)     (MPN/100ml)    (MPN/100ml)
    REC-1
    GM                  240 a, f      200 a     125 b, 126 d  33 b , 35 d      1,000 c         200 c         35 b, c
    SSM                10,000 a         --           --           --          10,000 c, e      400 c         104 c
    75 PCTL
        th

    (designated           --            --         235 b         61 b             --             --         104 b, c
    beach)
    82nd PCTL
    (moderate             --            --         298 b         89 b             --             --         124 b, c
    bathing use)
    90th PCTL
    (light                --          400 a        406 b        108 b             --             --         276 b, c
    bathing use)
    95th PCTL
    (infrequent           --            --         576 b        151 b             --             --         500 b, c
    bathing use)
    STV                   --            --         410 d        130 d             --             --          130 d
    BAV                   --            --         235 d         70 d             --             --           70 d
    REC-2
    Mean                              2,000          --           --              --             --            --
    90 PCTL
        th
                                      4,000          --           --              --             --            --
    BAV = Beach Action Value, GM = geometric mean, PCTL = percentile, REC-1 = water contact recreation,
    REC-2 = noncontact water recreation, SSM = single sample maximum, STV = statistical threshold value
    Bold values are the WQOs referenced in the San Pedro Creek and Pacifica State Beach TMDL
    a
       Basin Plan (Regional Water Board 2013)
    b
       USEPA (1986)
    c
       Ocean Plan (2012)

1
 The State Water Board is beginning a process to update WQOs based on USEPA (2012) recreational water quality
criteria and provide efficient and consistent statewide implementation guidance.
d
   USEPA (2012)
 e
   Total coliform density shall not exceed 1,000 when the fecal coliform/total coliform ratio exceeds 0.1 (Ocean Plan
 2012).
 f
   The total coliform WQO of 240 MPN/100ml is the median, not the GM.

Total Maximum Daily Load
Section 303(d) of the federal Clean Water Act (CWA) requires states to identify waters that do not meet
applicable WQOs and prioritize such waters for the purposes of developing TMDLs. Impaired water
bodies and the pollutants for which they are impaired are placed on the State’s CWA 303(d) list.
Placement on the 303(d) list generally leads to the development of a TMDL. A TMDL is a plan and
process to restore water quality in an impaired water body. TMDLs examine the water quality
problems, identify sources of pollutants, and specify actions to restore water quality. TMDLs and their
associated implementation plans are adopted by Regional Water Quality Control Boards as amendments
to the Region’s Water Quality Control Plan.

Pacifica State Beach and San Pedro Creek were added to the State’s 303(d) list in 2002 due to indicator
bacteria densities that exceeded REC-1 WQOs. The listings were primarily based on monitoring
conducted by the County Health Department which collects (or coordinates the collection of) year-
round weekly samples at the creek mouth and at the beach about 300 feet northwest of the creek
mouth (Linda Mar #5). E. coli results from the creek mouth and enterococci results from Linda Mar #5
measured from May 1998 to May 2014 are graphed in Figure 2. A second beach station located about
1,500 feet northwest of the creek mouth (Linda Mar #6) was monitored through September 2008 and
then discontinued due to budget constraints and consistently good water quality. Beach samples are
analyzed for total coliform, E. coli, and enterococci, and creek mouth samples are analyzed for total
coliform and E. coli. Results of the County Health Department monitoring are used to inform beach
warning and closure decisions.

The Final Staff Report for the Proposed Basin Plan Amendment (Regional Water Board 2012)
summarizes bacteriological data collected by the San Pedro Creek Watershed Coalition in 2006. This
study, which was funded by a grant from the State Water Board (Proposition 13), confirmed E. coli and
total coliform densities exceeding REC-1 WQOs in wet and dry season samples collected throughout the
urbanized portion of the San Pedro Creek watershed (Davis and Chan 2008).

More recent sampling for E. coli was conducted by Regional Water Board staff at ten stations in the San
Pedro Creek watershed in 2013 during two five-week periods in the wet and dry seasons. Exceedances
of REC-1 E. coli WQOs were found in all sampled urban reaches during the dry season. However, during
the wet season, E. coli exceedances were primarily confined to lower watershed stations (unpublished
data). Grab samples for fecal coliform and E. coli analyses were collected in July 2013 from five stations
along the main stem in compliance with the Municipal Regional Stormwater National Pollutant
Discharge Elimination System (NPDES) Permit (MRP; Order R2-2009-0074) (SMCWPPP 2014a). In
addition, the City sampled two stations along the main stem of San Pedro Creek in February and March
2014 for total coliform, E. coli, and enterococci. The combined results of these monitoring efforts
confirmed FIB densities that exceeded REC-1 WQOs. Box plots showing the mean, median, quartiles, and
variability for E. coli measured at stations along the creek are shown in Figure 3. Data are grouped into
three categories: dry season – dry events, wet season – dry events, and storm samples (i.e., during or
within 24-hours after a rain event). In general, E. coli results in the creek are highly variable and, based
on examination of these plots, show no major spatial or seasonal trends with the exception of stations
above urban areas (see Figure 8 for station locations).

Figure 2. E. coli at San Pedro Creek mouth and enterococci at Linda Mar #5 reported by County
Environmental Health (1998 – 2014).
Data sources: Davis and Chan
                                                                                  (2008), Regional Water Board
                                                                                  (unpublished), SMCWPPP (2014a)

Figure 3. E. coli densities measured at stations along San Pedro Creek (2006 – 2013).
Bacteria Sources
The TMDL Final Staff Report includes the results of a bacteria source assessment. Controllable sources
of bacteria in the watershed were identified as Pacifica’s sanitary sewer system (including sanitary sewer
overflows), horse facilities, and municipal stormwater runoff and dry weather flows (Regional Water
Board 2012). Wildlife is identified as a non-controllable source of bacteria in the watershed. These
findings are primarily based on a microbial source tracking (MST) analysis using E. coli DNA that was
conducted by the San Pedro Creek Watershed Coalition as a central goal of their 2006 study (Davis and
Chan 2008).

The results were grouped into 10 source type categories based on potential significance for pollution
source management purposes. Source types in order of frequency of detection in San Pedro Creek
samples were: avian (37.8%), canine (14%), suburban wildlife (mainly raccoons) (10%), rodents (9%),
human (8%), wildlife (8%), unknown (6%), feline (primarily domestic cats) (4%), horse (3%), bovine
(0.2%). For purposes of this TMDL BMP Implementation Plan it is assumed that the potentially
controllable sources include canine, human, and horse which were associated with 25% of the detected
markers. (In this discussion it is assumed that domestic cat waste is largely uncontrollable).
Of these potentially controllable sources, per the TMDL, regulatory measures are already in place or will be implemented by the Regional Water Board to address the majority of the human component (Cease and Desist Order, Consent Decree) and the horse component (Clean-Up and Abatement Order, Confined Animal Waste Discharge Requirements). Therefore the primary remaining potentially controllable source available for new control measures is canine, i.e., domestic dogs. The BMP Implementation Plan (Section 2.0) therefore focuses extensively on pet waste public education and outreach measures. However, it needs to be noted that even if 100% of the potentially controllable “sources” (based on the number of detected markers in the samples collected for the San Pedro Creek Water Coalition Study), 75% of the “sources” are by definition uncontrollable. While it is not possible to equate these results of detectable source markers to source loadings, it does make the point that there is a very high level of background “sources” in the watershed contributing to FIB concentrations measured at the compliance stations. The perennial nature of San Pedro Creek and the extensive riparian habitat along the Creek provides a desirable environment for attracting and sustaining wildlife and avian populations. The extensive residential development throughout much of the watershed provides suitable conditions for attracting and maintaining populations of suburban wildlife and rodents. While it can neither be proven nor disproven based on the available data, the 2006 San Pedro Creek MST study, and subsequent MST studies (summarized below), and results from the International Stormwater BMP Database (also summarized below), raise two important considerations regarding the BMP Implementation Plan. First, the primary remaining potentially controllable source that is not already being addressed by other regulatory measures, is pet (primarily dog) waste. Second, even if the three major potentially controllable sources (human, dog, horse) were eliminated over time, it is not clear that on-going contributions from uncontrollable sources would not cause or contribute to continued excursions above the REC-1 WQOs in the Creek and therefore also at the Creek mouth, given the uncertainties in and limitations of the reference approach employed by the TMDL. More recently (and not reported in the TMDL Final Staff Report), in 2009-2010, Stanford University researchers sampled eight stations along the main stem of San Pedro Creek within the urban zone and two stations upstream of urban land uses (Sassoubre et al. 2011). Sampling was conducted in June, September, and February. MST analyses were conducted using state of the art, widely tested methods and modeling tools that were less-widely available at the time of the 2006 San Pedro Creek Watershed Coalition study. Bacteroidales source tracking tools using human- and horse-specific assays were applied to identify whether these species contribute fecal contamination to the creek. The human- and horse- specific markers were not detected in any samples, suggesting that other species (e.g., wildlife, avian, insects) found in the watershed were the source of fecal contamination and Bacteroidales in San Pedro Creek. As noted above, the 2006 MST study found that bird markers were most prevalent (i.e., detected in the greatest number of samples) (Davis and Chan 2008). Bacteria Allocations The TMDL for Bacteria in San Pedro Creek and at Pacifica State Beach became effective on October 1, 2013. Irrespective of MST findings that suggest low to unidentifiable contributions of human and other controllable sources to the bacteria load in San Pedro Creek, the TMDL uses a reference system approach to setting load allocations and wasteload allocations. It establishes load allocations for horse facilities and wasteload allocations for stormwater runoff and dry weather flows, expressed in terms of allowable exceedances of single-sample objectives measured at two compliance stations: Pacifica State
Beach and the mouth of San Pedro Creek. The monitoring data used to determine allowable
exceedance rates were from reference systems/watersheds in Southern California: Leo Carrillo State
Beach for Pacifica State Beach, and several Southern California Coastal Water Research Project
(SCCWRP) freshwater system studies for San Pedro Creek. The allowable exceedance rates differ
depending on season (wet or dry) and rainfall conditions. The TMDL includes WQOs for fecal indicator
bacteria (i.e., E. coli, fecal coliform, and total coliform in freshwater and WQOs for fecal coliform,
enterococcus, and total coliform in marine water). Exceedances are based on WQOs for E. coli and
enterococci derived from the more conservative USEPA (1986) ambient water quality criteria for
designated bathing beaches rather than the updated USEPA (2012) recreational water quality criteria
(Table 1). WQOs referenced in the TMDL are shown in bold in Table 1. Allowable exceedances are listed
in Table 2. The TMDL requires that allocations for Pacifica State Beach are attained within eight years of
the TMDL effective date (i.e., October 1, 2021), and allocations for San Pedro Creek are attained within
15 years of the TMDL effective date (i.e., October 1, 2028).

It is important to acknowledge that the San Pedro Creek and Pacifica State Beach Bacteria TMDL criteria
were developed for FIB and do not distinguish among sources of FIB. As noted above, it is also
important to understand that FIB do not directly represent actual pathogen concentrations and that
animal fecal waste is much less likely to contain pathogens of concern to humans than human fecal
waste. The City of Santa Barbara in partnership with the University of California, Santa Barbara is
aggressively researching and implementing actions to eliminate FIB. In a recent publication (2012), they
noted the following:

        Beach warnings in California are based on levels of fecal indicator bacteria, as mandated by the
        USEPA and State Assembly Bill AB411………….While eliminating all fecal indicator bacteria may
        lead to fewer beach warnings, it can be an impractical or impossible task in many locations.

        Fecal indicator bacteria can come from animal sources, including wildlife, decaying plant
        material, and even growth on gutters, storm drain pipes, and sand grains. Indicator bacteria
        growing in the environment are unlikely to pose health risks to humans, and the risk associated
        with recreational contact with animal fecal sources in water is unknown. The USEPA reports that
        there has never been a documented outbreak of animal-associated illness among swimmers at
        marine beaches. The vast majority of fecal indicator bacteria are not themselves pathogens
        (microbes that cause illness), and the majority of pathogens are not indicator bacteria.

        Among types of fecal contamination at coastal urban beaches, untreated human waste has the
        greatest potential to sicken beach goers. Most illnesses would likely cause mild-to-moderate
        gastrointestinal (GI) problems, but untreated waste also has the potential to transmit more
        harmful pathogens.

There are a number of environmental sources of bacteria that can confound FIB monitoring and source
identification studies. For example, biofilms (slime layers) in storm sewers provide a safe environment
for enhanced bacterial replication, supply nutrients and water for biofilm bacteria, and offer protection
against microbial predators, ultraviolet light, drying, and disinfectants. Sediments in outfalls and
streambeds can also be sources (reservoirs) of fecal bacteria (International Stormwater BMP Database,
2010). Diffuse and/or slug loads of fecal coliform sources (e.g., bird and wildlife sources) could be
deposited in the Creek and accumulate and grow in sediments and biofilms, during low flow periods,
rather than being immediately conveyed downstream. These accumulated bacterial “loads” can be
flushed out into the water column during storm or other sources of elevated flow events (e.g., irrigation
runoff), potentially giving a false positive indication of a “hot spot”. This study also made the following
observations about FIB concentrations and sources:
“Regardless of whether the source is natural or human-caused, fecal indicator bacteria
concentrations in urban stormwater are typically well above primary contact recreation stream
standards, regardless of the land use.” … “Although some of these sources can be reasonably
controlled (e.g., wastewater discharges, illicit connections), other sources are much more
difficult to control such as raccoons and other animals in storm sewers, beavers, wildlife in open
space areas, birds on bridges, and stream and storm sewer sediments and biofilms.”
Table 2. TMDL Allocations based on allowable exceedances of single-sample bacteria objectives for San
Pedro Creek and Pacifica State Beach.
San Pedro Creek Pacifica State Beach
Summer Dry Winter Dry
Dry Wet Weather Weather Wet
Weather Weather a (Apr. 1 to Oct. 31) (Nov. 1 to Mar. 31) Weather a
Allowable Exceedances of
Single-Sample Objectives
4 26 0 2 30
(assuming daily sampling is
conducted)
Allowable Exceedances of
Single-Sample Objectives
1 4 0 1 5
(assuming weekly sampling
is conducted)
a
Wet weather is defined as any day with 0.1 inches of rain or more and the following three days.
Implementation
The TMDL Implementation Plan (Section 7.4.1.6 of the Basin Plan Amendment; Appendix A) specifies
actions needed to attain the allocations (some of which are already in place) and parties responsible for
each action. Actions for which requirements are already in place include: 1) reduction of sanitary sewer
discharges by the measures required under an existing Cease and Desist Order issued to the City of
Pacifica and the general waste discharge requirements for sanitary sewer systems; and 2) a Cleanup and
Abatement Order issued to one of the three horse facilities in the watershed. New actions include
requirements for horse facility owners and operators to obtain coverage under waste discharge
requirements to ensure the clean operation of their facilities and new requirements for stormwater
management. Actions and BMPs being implemented by the City and County are described in the BMP
Implementation Plan below (Section 2.0).
Adaptive Implementation
The TMDL states that “Water Board staff will periodically, in coordination with the implementation
schedule, at five, eight and 15 years, evaluate new and relevant information from implementation
actions, water quality monitoring results and the scientific literature, including any local reference
system studies, USEPA’s revised recommended bacteria criteria, or new or revised State bacteria water
quality objectives, and assess progress toward attaining TMDL targets and load allocations, and presentthat information to the Water Board. The Water Board will consider a Basin Plan amendment that
reflects any necessary modifications to the targets or implementation plan.”
Monitoring
The TMDL requires development and implementation of a comprehensive bacteria water quality
monitoring plan for the San Pedro Creek watershed to “1) better characterize bacteria contributions;
and 2) assess compliance with the wasteload allocations.” The City and County are encouraged to
collaborate on a single cooperative plan that shall be acceptable to the Executive Officer. The Basin Plan
Amendment and TMDL Final Staff Report (Regional Water Board 2012) describe specific requirements
for the Monitoring Plan, including guidance on station locations and frequency of sampling. As stated in
the San Pedro Creek and Pacifica State Beach Bacteria TMDL:
The monitoring plan shall include applicable bacteria water quality objectives and the sampling
frequency shall be adequate to assess compliance with the 30-day geometric mean objectives.
Responsible parties may build upon existing monitoring program(s) for San Pedro Creek and
Pacifica State Beach when developing the bacteria water quality monitoring plan. At a minimum,
in addition to the existing San Mateo County sampling stations at the mouth of San Pedro Creek
and at Pacifica State Beach, which will be used to evaluate achievement of the designated load
and wasteload allocations, at least one sampling station shall be located in each creek
reach/subwatershed, such that bacteria contributions from each of the San Pedro Creek’s
forks/subwatersheds are distinguished. In addition, indicator bacteria concentrations in the
stormwater and dry weather discharges from the Linda Mar and Anza pump stations shall be
monitored and characterized sufficient to determine their contribution to exceedances and the
effects of any corrective actions. Lastly, monitoring of some of the stormwater outfalls within the
watershed may be needed to characterize and identify indicator bacteria loadings from different
land uses and locations and the effects of any corrective actions. Monitoring data shall be
entered into the State Water Board’s “Beach Watch” database as appropriate.
Environmental Setting
San Pedro Creek Watershed
San Pedro Creek is a perennial stream that flows westward to the Pacific Ocean through the City of
Pacifica in San Mateo County, California (Figure 4). The creek drains roughly eight square miles of the
western side of Montara Mountain and has five major tributaries, all of which contain perennial flows
fed by springs. The North, Middle and South Forks extend into the upper reaches of the watershed. The
North Fork headwaters are comprised of several steep first order streams that drain into an extensive
network of underground culverts flowing through an urbanized valley. The Middle and South Fork
tributaries also drain steep hillsides into a low gradient stream flowing through the upper end of San
Pedro Valley; however, their subwatersheds are entirely within public open-space (e.g., San Pedro Valley
County Park). The North Fork and combined Middle/South Fork drainages are roughly equal in size,
about 2.4 square miles each. There are two smaller tributaries in the watershed, Sanchez Creek and an
unnamed tributary flowing through Shamrock Ranch, which drain into the lower reaches of the main
stem. The main stem of San Pedro Creek flows for about 2.5 miles through a broad valley floor, which is
mostly developed to the banks of the creek. About one-fifth of the total watershed area is urbanized
with the remainder comprised mainly of open space and recreational uses. The overall imperviousnessof the watershed is approximately 15 percent and about 64 percent of the creek channel is unmodified
(STOPPP 2001 and 2002).
Runoff from urban areas within the watershed is collected in the municipal separate storm drain system
(MS4) that is owned and maintained by the City. This network of drainage ditches and pipes conveys
stormwater runoff and dry season flows to San Pedro Creek. Flows originating from approximately 300
acres of relatively dense residential and commercial land use in the lower watershed are conveyed to
two pump stations located at Pacifica State Beach. The storm drain network and pump station locations
are mapped in Figure 4; major outfall catchment boundaries delineated by the San Mateo Countywide
Water Pollution Prevention Program (SMCWPPP 2 2014) are shown for context. The lower watershed is
characterized by high groundwater and aging infrastructure which results in year-round infiltration into
and discharges from the MS4. Dry season (April through October) and winter dry weather flows from
this area are pumped out of the lower San Pedro Creek watershed by the Linda Mar and Anza pump
stations (Figure 4) to the City of Pacifica Calera Creek Water Recycling Plant (WWTP). Wet weather
flows from this area are pumped directly to the beach at locations northeast of the mouth of San Pedro
Creek.
San Pedro Creek contains the northern-most population of naturally producing steelhead trout
(Oncorhynchus mykiss) in San Mateo County. Although degradation of physical habitat and the presence
of fish barriers such as bridge culverts may threaten the steelhead population, restoration efforts are
helping to reestablish and enhance habitat. For example, in 2005 the City removed a fish passage and
migration barrier at Capistrano Avenue Bridge and restored approximately 1,300 linear feet of channel.
The City also implemented the San Pedro Creek Flood Control Project which reconstructed a
meandering channel and active floodplain in the lower 3,100-feet of San Pedro Creek. Protection of
steelhead habitat is a high priority for many stakeholders and part of the reason why the Basin Plan
Amendment (Section 7.4.1.3; Appendix A) stated that “It is not the intent of this TMDL to require
treatment or diversion of water bodies or to otherwise require treatment of natural sources of indicator
bacteria.”
Pacifica State Beach
San Pedro Creek drains to the Pacific Ocean at the southwest end of Pacifica State Beach. Also known as
Linda Mar Beach, this wave-dominated, 0.75-mile long, crescent shaped beach is a popular surfing
location. Pacifica State Beach is owned by California State Parks and managed and operated by the City.
It is served by three daily-fee parking lots and a full-time beach ranger. Dogs are allowed on the beach
but must be on leash. In 2006, in part to reduce litter, the City established an ordinance prohibiting
smoking on the beach. Like many coastal California beaches, Pacifica State Beach has experienced
beach erosion, possibly as the result of shoreline armoring. Managed retreat efforts include the San
Pedro Creek Flood Control Project and removal of vulnerable structures on the beach.
A recent study was conducted to investigate entrainment of pollution from coastal discharges into the
surf zone (Wong et al. 2013). Rhodamine WT dye was released into San Pedro Creek on three occasions
and measured at several points inside the surf zone along the beach. Measured dye concentrations and
corresponding measured and modeled concentrations of FIB (total coliform, E. coli, and enterococci)
suggest complex mixing dynamics between creek and ocean waters, dependent on tidal stage, discharge
2
SMCWPPP was formerly named the San Mateo Countywide Stormwater Pollution Prevention Program (STOPPP).rates, and surf zone alongshore velocity, with FIB dilution increasing with distance from the creek mouth. Figure 4. San Pedro Creek watershed, showing the storm drain network and pump stations.
Wasteload Allocation Attainment Assessment
As required by the MRP, a detailed assessment of wasteload allocation attainment progress is provided
based on the compliance monitoring data summarized in each annual status report.

Compliance Monitoring
Beginning WY2016, Compliance Monitoring has occurred on a weekly basis at two monitoring stations.
County Environmental Health performs weekly compliance monitoring on behalf of the City of Pacifica
and the County at Pacifica State Beach (Linda Mar Station #5) and the mouth of San Pedro Creek (Creek
Mouth). See Figure 5 for a map of sampling locations. Ocean water samples from Linda Mar beach were
analyzed for total coliform, enterococci, and E. coli (in place of fecal coliform). Creek mouth samples
were analyzed for E. coli and total coliform. Monitoring data from Linda Mar and the Creek Mouth is
entered by County Environmental Health into the State Water Board’s Beach Watch database on a
weekly basis.

Figure 5. County Environmental Health Weekly Beach Sampling Locations
Pacifica State Beach Compliance Monitoring
As shown in the tables below, water quality samples continue to exceed water quality objectives with no
trends indicating improvement of water quality at Pacifica State Beach. The October 1, 2021 deadline for
attainment is unlikely to be met at this time.

    Table 3: Pacifica State Beach allowable exceedances vs actual exceedances for weekly sampling,
                                             WYs 2016-2019
                       Summer Dry Weather           Winter Dry Weather                Wet Weather
        WY              Allowed    Actual          Allowed         Actual         Allowed      Actual
       2016                 0         6                1              8               5           7
       2017                 0         9                1              0               5          11
       2018                 0        10                1             12               5           6
       2019                 0        10                1              5               5           7

                     Table 4: Pacifica State Beach percent exceedances, WYs 2016-2019
                                       % of Samples Exceeded (total samples in parenthesis)
              WY                       Summer Dry          Winter Dry          Wet Weather
                                         Weather            Weather
              2016                       21% (28)           57% (14)             70% (10)
              2017                       33% (27)             0% (9)             79% (14)
              2018                       36% (28)           75% (16)              86% (7)
              2019                       32% (31)            83% (6)             64% (11)

On average, between WY2016 and WY2019, 31% of summer dry weather samples exceeded water
quality objectives, 54% of winter dry weather samples exceeded water quality objectives and 75% of
wet weather samples exceed water quality objectives. The attainment goals of 0 exceedances during
summer dry weather, 1 exceedance during winter dry weather and 5 exceedances during wet weather
remain far below water quality sampling results.

San Pedro Creek Compliance Monitoring
Exceedances at the San Pedro Creek monitoring station also continue to be well above allowable
exceedances in both wet and dry weather conditions (see table below). The attainment deadline for San
Pedro Creek is October 1, 2028 which still allows time to adjust implementation of BMPs to achieve
water quality objectives.

    Table 5: San Pedro Creek allowable vs actual exceedances for weekly sampling, WYs 2016-2019
                                                 Dry Weather                      Wet Weather
                        WY                 Allowed          Actual          Allowed         Actual
                       2016                    1              32                4              9
                       2017                    1              26                4             12
                       2018                    1              33                4              5
                       2019                    1              28                4              9
Table 6: San Pedro Creek percent exceedances, WYs 2016-2019
% of Samples Exceeded (total samples in parenthesis)
WY Dry Weather Wet Weather
2016 76% (42) 90% (10)
2017 72% (36) 86% (14)
2018 73% (45) 83% (6)
2019 76% (37) 75% (12)
On average, between WY2016 and WY2019, 74% of dry weather samples exceeded water quality
objectives and 84% of wet weather samples exceeded water quality objectives. The percentage of wet
weather exceedances has consistently trended downward since WY2016, moving from 90% of samples
exceeding water quality objectives down to 75% of samples in exceedance. While this indicates some
progress, the attainment goals of 1 exceedance during dry weather and 4 exceedances during wet
weather remain far below water quality sampling results.
Characterization Monitoring
Characterizing monitoring has been conducted by the San Mateo County Resource Conservation District
since 2016 and has alternately focused on characterization during the wet season or dry season of each
year (see table below). Characterization monitoring has been helpful in evaluating effectiveness of
specific BMPs and allowing for prioritization of existing or new BMPs. Recent characterization
monitoring results suggest that wildlife continues to be a prominent source of bacteria in the watershed
but remains largely uncontrollable. Results also suggest a relationship between increased E Coli. levels
and urban land use. Despite the high levels of wildlife prevalent in the watershed, controllable sources
identified as human, horse, and dog waste have been detected with reasonable confidence at most
monitoring locations, especially during the wet season.
Assessment Recommendations
Based on the results of compliance and characterization monitoring conducted from WY2016 to
present, it is evident that BMPs currently in place are not sufficient in addressing bacterial sources and
should be adjusted and/or increased in order to improve water quality. Changes based on feedback
from Water Board staff and resulting from Characterization Monitoring analysis are suggested in the
next section.
The responsible parties are concerned that the compliance monitoring locations (see figure X above) are
located in close proximity to each other near the mouth of San Pedro Creek and, while conservative in
respect to health concerns, may not accurately represent water quality at Pacifica State Beach. An
alternative sampling site may allow for better mixing with ocean water and demonstrate fewer
exceedances of water quality objectives. Alternatively, given the high levels of background bacteria from
uncontrollable sources such as wildlife, it may also be beneficial to review waste load allocation
attainment timelines or the feasibility of achieving water quality objectives at all given the number of
terrestrial, marine and avian wildlife present in the watershed. A Source/Stressor Identification Study,
similar to what was conducted recently for Pillar Point Harbor, may provide updated information on
sources of bacteria in the watershed by using new methods and techniques to identify specific sources
and locations of bacteria.Revised Implementation Tasks
Given the lack of progress towards attainment of wasteload allocations, responsible TMDL parties
propose the following updates to the BMP Implementation Plan:
Sanitary Sewer Mapping Effort
Map the age of the sanitary sewer infrastructure and understand operations and maintenance activities,
including planned upgrades and integrity testing. Opportunities for improved coordination, O&M, and
additional investigations will be explored. An updated map will be submitted with the TMDL Status
Report by March 15, 2022.
Storm Drain Infrastructure Mapping Effort
To the extent that data are available, City will map the age of the storm drain infrastructure systems.
Results of the mapping will be used to identify opportunity for additional investigations. An updated
map will be submitted with the TMDL Status Report by March 15, 2022.
Video Inspection of Storm Drain System
City to video inspect the storm drain infrastructure systems. Results of the inspections will be used to
identify opportunity for additional measures. Results will be submitted with the TMDL Status Report by
March 15, 2021.
Homeless Encampment Clean-Up and Prevention
The City will include a description of the actions currently being done to address clean-up of homeless
encampments. The issue of homelessness is complex and politically sensitive. Potential solutions are
generally resource intensive and beyond the scope of stormwater programs. Clean-up activities can be
dangerous to personnel due to encounters with individuals/dogs and the presence of hazardous
materials. However, the City will identify opportunities to improve homeless encampment clean-up
and/or prevention actions. These may include:
• coordination with other municipal departments, NGOs, and non-profits;
• Development of flyers and signage specifically targeting the homeless population
A summary of current and planned actions will be submitted with the TMDL Status Report by March 15,
2021.
Outreach to Recreational Vehicles (RVs)
The City will conduct outreach on proper disposal of greywater where RVs and trucks stay overnight.
Another consideration will be development of a voucher program for the RV population for disposal of
black water. A summary of current and planned actions will be submitted with the TMDL Status Report
by March 15, 2021.
Pet Waste Stakeholder Group
The City will explore the possibility of establishing a new Public Pet Waste Management Stakeholder
Group. Evaluation of feasibility of public workgroup will be completed by March 15, 2021
Annual Horse Facility Compliance InspectionsAs described in the initial BMP Implementation Plan, the City of Pacifica will formalize an agreement with the County for annual horse facility compliance review and inspection services. Crespi Canal Fence Repairs City will evaluate and repair fences and gates along Crespi Canal. Repairs will be completed by March 15, 2021.
Summary Table
The table below summarizes Implementation tasks and provides a status update of existing tasks and incorporates additional proposed tasks.
Changes are highlighted in red.

San Pedro Creek and Pacifica State Beach Bacteria TMDL Monitoring and BMP Implementation Plan UPDATED tasks and schedule.
                                                                                                 Responsible   Enforcement
 Category      Implementation Task                                                   Location       Party         Entity           Schedule
 BMP Implementation Plan (Section 2.0)
                                                                                                                                Combined SSMP
               Comply with:                                                                                                  Audit/SSO Report and
               • RWB Cease and Desist Order No. R2-2011-0031 for the Pacifica                                                 CDO Section VIII. 23
                                                                                                                Regional
                 WWTP and Collection System; and                                     City-wide      City                      Compliance Report
                                                                                                               Water Board
               • SWB Order No. 2006-0003-DWQ Statewide General Waste                                                           submitted to RWB
                 Discharge Requirements for Sanitary Sewer Systems                                                            March 15 each year
                                                                                                                                beginning 2012
                                                                                                                             At property transfer,
 Sanitary
                                                                                                                             significant structural
 Sewer         Private Sewer Lateral Ordinance Enforcement – Requires
                                                                                                                             remodel, addition of
 System        Individual Building Lateral Condition Assessment and Potential        City-Wide      City          City
                                                                                                                              drain or fixture, or
               Replacement to Obtain City Approvals
                                                                                                                                change in water
                                                                                                                                     service
                                                                                                                             Updated map will be
               Map the age of the sanitary sewer infrastructure and understand
                                                                                                                             submitted with TMDL
               operations and maintenance activities, including planned upgrades
                                                                                     Watershed      City          City         Status Report by
               and integrity testing. Opportunities for improved coordination,
                                                                                                                               March 15, 2022.
               O&M, and additional investigations will be explored.

                                                                                                                             Updated map will be
               To the extent that data are available, City will map the age of the
                                                                                                                             submitted with TMDL
               storm drain infrastructure systems. Results of the mapping will be    Watershed      City          City
                                                                                                                               Status Report by
 Storm         used to identify opportunity for additional investigations.
                                                                                                                               March 15, 2022.
 Drainage
 System                                                                                                                         Results will be
               City to video inspect the storm drain infrastructure systems.
                                                                                                                             submitted with TMDL
               Results of the inspections will be used to identify opportunity for   Watershed      City          City
                                                                                                                               Status Report by
               additional measures.
                                                                                                                               March 15, 2021.
Responsible Enforcement
Category Implementation Task Location Party Entity Schedule
The City will include a description of the actions currently being
done to address clean-up of homeless encampments. The issue of
homelessness is complex and politically sensitive. Potential
solutions are generally resource intensive and beyond the scope of
stormwater programs. Clean-up activities can be dangerous to
Homeless
personnel due to encounters with individuals/dogs and the Submit current and
Encampme
presence of hazardous materials. However, the City will identify planned actions with
nt Clean- City-Wide City City
opportunities to improve homeless encampment clean-up and/or TMDL Status Report
up/Preventi
prevention actions. These may include: by March 15, 2021.
on
• coordination with other municipal departments, NGOs, and
non-profits;
• development of flyers and signage specifically targeting the
homeless population
The City will conduct outreach on proper disposal of greywater Submit current and
Outreach to where RVs and trucks stay overnight. Another consideration will planned actions with
City-Wide City City
RV’s be development of a voucher program for the RV population for TMDL Status Report
disposal of black water. by March 15, 2021.
Millwood
Obtain coverage under and comply with Water Board’s updated Ranch,
Existing and No later than two
General Waste Discharge Requirements for Confined Animal Sweeney
future horse Regional years after the TMDL
Facilities, when Order is reissued/or the existing version, if an Ridge
facility owners or Water Board effective date (by
update to the Order is not made within two years of the effective Stable,
operators October 1, 2015)
date of the TMDL) Shamrock
Ranch
Horse Millwood Ranch Regional As required by the
Facilities Comply with the CAO for Millwood Ranch City
Owners Water Board CAO
Review compliance with Pacifica’s Administrative Policy on
City City City June 30, 2015
“Standards for Keeping Animals”
Review compliance with Pacifica’s Municipal Code on “Animal
City City City June 30, 2015
Excreta”
Finalize agreement with County for annual horse facility
City City and County City March 15, 2021
compliance review and inspection servicesResponsible Enforcement
Category Implementation Task Location Party Entity Schedule
Annually by June 30
Annual compliance review and inspection City City and County City
beginning in 2015
a) Annual inspection
on-going from FY
2013-14
San Mateo County’s Ordinance for Confined Animals Compliance a), b), and c)
b) Annual review on-
a) Site inspection for zoning compliance by June 30 each year County Planning
going from FY 2013-14
b) Compliance review of current manure, stormwater, and and Building
County County c) Reporting on
drainage management plans by June 30 each year Department,
Ordinance review by
c) Review of County Confined Animal Ordinance by April 20, 2105 d) County Env.
Sept. 15, 2015
d) Site inspection by June 30 each year Health Division
d) Annual inspection
on-going from FY
2013-14
Elevate compliance review of Shamrock Ranch to annual a) Annual inspection
schedule. a) and b) County on-going from FY
Horse a) Site inspection for zoning compliance by June 30 each year Planning and 2013-14
Facilities b) Compliance review of current waste, stormwater, and drainage Building b) Annual review on-
County County
management plans by June 30 each year Department going from FY 2013-14
c) Annual compliance review and inspection by June 30 c) County Env. c) Annual inspection
Health Division on-going from FY
2013-14
Ensure existing and future dog kennel facilities have current a) Annual inspection
operations on file with County. on-going from FY
a), b), and d)
a) Site inspection for zoning compliance by June 30 each year 2013-14
County Planning
b) Compliance review of current manure, stormwater, and b) Annual review on-
and Building
drainage management plans by June 30 each year County County going from FY 2013-14
Department
c) Annual compliance review and inspection by June 30 c) Annual inspection
c) County Env.
d) Update Dog Kennel/Cattery Permit Application on-going from FY
Health Division
2013-14
d) October 31, 2014
C.3 New Development and Redevelopment. The City will continue
MRP to comply with standard C.3 requirements as qualifying projects City City City On-going
occur.Responsible Enforcement
Category Implementation Task Location Party Entity Schedule
C.10 Trash Load Reduction. Required enhanced street sweeping
Being Implemented
and additional full trash capture device installation could provide
MRP City City City Per February 2014
some incidental removal of large solid pieces of dog waste that
Long-Term Trash Plan
reach the side of the road.
Complete Pacifica Dog Park with Engineered Bioretention
Operational March
Treatment Facility and Bioswales and three years of post-project City City City
2012
upstream and downstream monitoring
Install dog waste clean-up sign at Peralta Road and San Pedro
City City City Installed Spring 2014
Terrace Road
Install five additional dog waste clean-up signs along San Pedro Complete by June 30,
City City City
Creek 2015
Install dog waste bag dispensers and trash cans at Peralta and Complete by June 30,
City City City
Pacifica Beach signs 2015
City will coordinate with civic groups to conduct quarterly visual
Complete by June 30,
TMDL- inspections and clean-ups in high dog waste accumulation areas City City City
2015
Specific along San Pedro Creek
BMPs Complete repairs by
City will evaluate and repair fences along Crespi Canal City City N/A
March 15, 2021
City will coordinate with County to develop enhanced pet waste Evaluate feasibility of
public outreach and education efforts. Updated efforts will focus City City City public workgroup by
on attempting to establish new public pet waste support group March 15, 2021
City will add a new page to the City website with information on
the San Pedro Creek TMDL, WQ monitoring, and BMP Complete by June 30,
City City City
implementation. City will provide similar information to local 2015
media sites.
City will continue to participate in local events such as Fog Fest On-going since mid-
City City City
and Earth Day and distribute pet waste management materials 2014
Annually with TMDL
BMP Review all measures and submit BMP Implementation Status
NA City and County -- Monitoring Results
Reporting Report
each March 15Responsible Enforcement
Category Implementation Task Location Party Entity Schedule
Annually with TMDL
Adjust BMPs based on results of Characterization Monitoring NA City and County NA Monitoring Results
each March 15
Monitoring Plan (Section 3.0)
Conduct routine monitoring at compliance stations (Creek Mouth
On-going, weekly,
for E. coli, total coliform and enterococci and Linda Mar #5 for
Compliance year-round sampling
enterococci, fecal coliform, and total coliform). Monitoring Watershed City and County NA
Monitoring began prior to
conducted/coordinated weekly by County Environmental Health
WY2015
Department.
In WY2016, sample 12 characterization stations for E. coli 10 times
Sub-
(Nov, Dec, Jan, Feb, Mar, May, Jun, Jul, Aug, Sep) with a focus on Biennial monitoring to
Characteriz watershed-
storm events during wet weather events (0.1” and following 3 implemented in
ation level City and County NA
days); sample 4 stations for Bacteroidales 4 times (2 wet season, 2 WY2016, WY2018 and
Monitoring investigati
dry season). WY2018 and WY2020 monitoring details based on WY2020.
ons
prior results but WY2016 represents maximum level-of-effort.
Submit on-going compliance and biennial characterization
Annually with BMP
monitoring results with annual BMP Implementation Status
Monitoring Implementation
Report. Review monitoring results for compliance, trends, and NA City and County NA
Reporting Status Report each
source identification. Revise characterization monitoring details
March 15
and BMP Implementation Plan as needed.
MRP Wasteload Allocation AssessmentYou can also read