Sarcopenia may Influence the Prognosis in Advanced Thyroid Cancer Patients Treated With Molecular Targeted Therapy
←
→
Page content transcription
If your browser does not render page correctly, please read the page content below

in vivo 35: 401-410 (2021)
doi:10.21873/invivo.12271

   Sarcopenia may Influence the Prognosis in Advanced Thyroid
    Cancer Patients Treated With Molecular Targeted Therapy
                       AKIHIRO NISHIYAMA1, YUKIKO STAUB2, YUKIO SUGA2, MIKIYA FUJITA2,
                            AZUSA TANIMOTO1, KOUSHIRO OHTSUBO1 and SEIJI YANO1

          1Division   of Medical Oncology, Cancer Research Institute, Kanazawa University, Kanazawa, Japan;
        2Department     of Clinical Pharmacy and Healthcare Sciences, Faculty of Pharmacy, Institute of Medical,
                       Pharmaceutical and Health Sciences, Kanazawa University, Kanazawa, Japan

Abstract. Background/Aim: Reportedly, sarcopenia and               carcinoma (PTC) and follicular thyroid carcinoma (FTC), ii)
nutritional status are associated with prognosis in cancer         medullary thyroid carcinoma (MTC), and iii) anaplastic thyroid
patients. However, data regarding the relationship of these        carcinoma (ATC). Although most patients with DTC
factors with advanced thyroid cancer patients receiving            demonstrate a good prognosis, some present aggressive features
molecular targeted therapy remains scarce. Therefore, we           (2). Recently, two tyrosine kinase inhibitors (TKI), sorafenib and
investigated the relationship between nutritional assessment,      lenvatinib, were approved for radioiodine-refractory DTC by the
as well as sarcopenia, and prognosis in patients with advanced     Food and Drug Administration (FDA), as an add-on to standard
thyroid cancer undergoing molecular targeted therapy. Patients     classical therapy, including surgery, radioactive iodine (RAI),
and Methods: In this retrospective study, sarcopenia and           and thyroid-stimulating hormone (TSH) suppression therapy (3,
several markers of nutritional status were assessed in advanced    4). These two drugs, presenting different adverse effect profiles,
thyroid cancer patients at the Kanazawa University Hospital,       have resulted in prolonged progression-free survival (PFS).
before the introduction of molecular targeted therapy. Results:    Conversely, ATC is one of the most aggressive solid tumors
Advanced thyroid cancer patients with sarcopenia presented a       observed in humans (5), frequently originating in a pre-existing
worse prognosis than those without sarcopenia. Additionally,       thyroid cancer lesion, as proposed by the simultaneous
sarcopenia strongly correlated with several markers of             occurrence of areas DTC and poorly DTC (6). In Japan, based
nutritional status, such as albumin, prognostic nutrition index,   on phase II trial results, lenvatinib has been approved for the
and Glasgow prognostic score. Conclusion: Sarcopenia could         treatment of ATC (7). However, when clinicians encounter RAI
be a prognostic factor in patients with advanced thyroid cancer    refractory DTC or ATC, they must combat advanced thyroid
receiving molecular targeted therapy.                              cancer with limited treatment options.
                                                                      In cancer patients, nutritional management during therapy
The Ministry of Environment of Japan reported that the             remains crucial. As their nutritional status is related to
incidence of thyroid cancer in Japan is growing annually, and      prognosis, clinicians should be aware of nutritional assessment
especially in women, it rose from about 3 per 100,000              methods, and use them carefully in clinical practice (8). Several
individuals in 1975 to more than 13 per 100,000 individuals in     laboratory nutritional markers, including serum albumin (Alb),
2013 (1). Thyroid cancer is categorized into: i) differentiated    C-reactive protein (CRP), and total lymphocyte count, have
thyroid carcinoma (DTC), consisting of papillary thyroid           been frequently used by physicians to assess patients’ nutritional
                                                                   status. Sarcopenia is a severe depletion of skeletal muscle and
                                                                   has been evaluated in cancer patients as it has been linked with
                                                                   the incidence of toxicity and bad prognosis, indicating poor
This article is freely accessible online.                          overall survival or high risk of postoperative complications (9,
                                                                   10). Despite these links, data regarding nutrition assessment and
Correspondence to: Akihiro Nishiyama, Division of Medical          sarcopenia in thyroid cancer remains limited. Here, we
Oncology, Cancer Research Institute, Kanazawa University, 13-1,    speculated that it could be crucial to assess a patients’ nutritional
Takaramachi, Kanazawa, Ishikawa 920-0934, Japan. Tel: +81
                                                                   status before treatment, allowing the safe use of molecular
762652794, Fax: +81 762442454, e-mail: an0510@staff.kanazawa-
u.ac.jp
                                                                   targeted therapy. In this study, we investigated the relationship
                                                                   between nutritional assessment, as well as sarcopenia, and the
Key Words: Sarcopenia, nutritional assessment, advanced thyroid    prognosis of advanced thyroid cancer patients treated with
cancer patient, molecular targeted therapy.                        lenvatinib or sorafenib at the Kanazawa University Hospital.

                                                                                                                                   401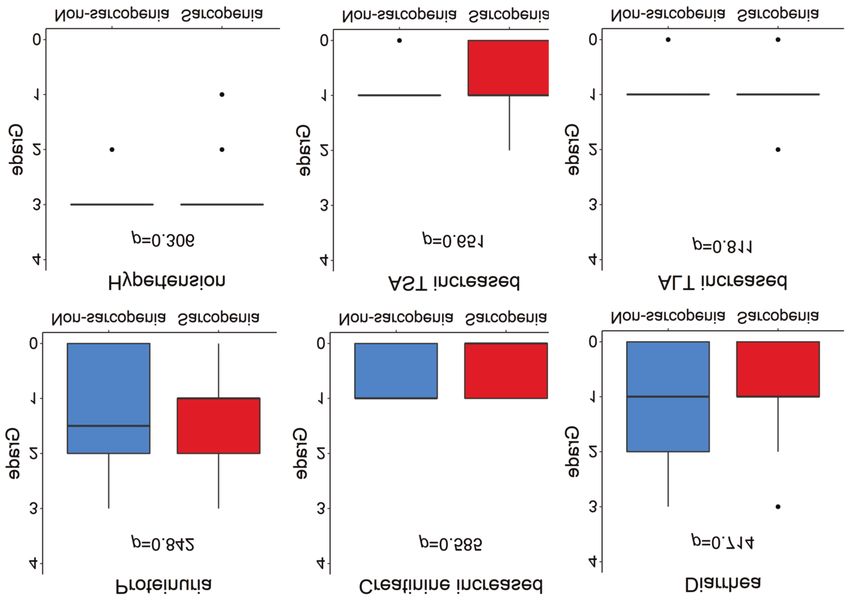
in vivo 35: 401-410 (2021)

Table I. Patients’ basic characteristics.

Characteristics                                                                             Median (range)                                p-Value

                                                                            Sarcopenia                       Non-sarcopenia
                                                                              (n=9)                             (n=14)

Age, years                                                                  67 (49-86)                         67 (45-77)                  0.614h
Gender, n (%)                               Male                             4 (44.4)                            9 (64.3)                  0.417i
                                            Female                           5 (55.6)                            5 (35.7)
Height, cm                                                                158 (145-168)                      163 (147-181)                 0.201h
Body weight, kg                                                          51.9 (29.5-60.9)                   64.3 (44.9-90.6)               0.003h
Body surface area, m2                                                    1.53 (1.11-1.69)                   1.72 (1.41-2.06)               0.009h
Body mass index, kg/m2                                                   20.0 (14.1-24.8)                   23.8 (18.3-37.5)               0.007h
Skeletal mass index, kg/m2                  Male                         34.2 (29.6-38.9)                   50.8 (41.5-56.3)               0.003h
                                            Female                       27.8 (23.1-28.9)                   39.9 (32.0-42.8)               0.008h
ECOG PSa, n (%)                             0                                  0 (0)                             5 (35.7)                  0.010h
                                            1                                5 (55.6)                            8 (57.1)
                                            2                                1 (11.1)                             1 (7.1)
                                            3                                3 (33.3)                              0 (0)
TKI treatmentb, n (%)                       Lenvatinib                       8 (88.9)                          11 (78.6)c                  1.000i
                                            Sorafenib                        1 (11.1)                           6 (42.9)c                  0.176i
Histological type, n (%)                    Papillary                        4 (44.4)                            6 (42.9)                  1.000i
                                            Follicular                       1 (11.1)                            3 (21.4)                  1.000i
                                            Poorly differentiated            1 (11.1)                            3 (21.4)                  1.000i
                                            Anaplastic                       3 (33.3)                            2 (14.3)                  0.343i
Prior treatment, n (%)                      Surgery                          5 (55.6)                           12 (85.7)                  0.343i
                                            Radioiodine                      2 (22.2)                            9 (64.3)                  0.089i
                                            External radiation               4 (44.4)                            5 (35.7)                  1.000i
                                            Cytotoxic agents                 3 (33.3)                              0 (0)                   0.047i
Target lesions, n (%)                       Any                              8 (88.9)                           14 (100)
                                            Lymph node                       5 (55.6)                            8 (57.1)                  1.000i
                                            Lung                             2 (22.2)                            6 (42.9)                  0.400i
                                            Thyroid                          3 (33.3)                            2 (14.3)                  0.343i
                                            Esophagus                        2 (22.2)                              0 (0)                   0.142i
                                            Trachea                            0 (0)                             2 (14.3)                  0.502i
                                            Liver                            1 (11.1)                             1 (7.1)                  1.000i
                                            Bone                             2 (22.2)                             1 (7.1)                  0.538i
                                            Brain                            1 (11.1)                             1 (7.1)                  1.000i
Tumor invasion, n (%)                       Any                              5 (55.6)                            4 (28.6)                  0.383i
                                            Vessel                           4 (44.4)                            3 (21.4)                  0.363i
                                            Esophagus                        2 (22.2)                              0 (0)                   0.142i
                                            Trachea                            0 (0)                              1 (7.1)                  1.000i
                                            Skin                             1 (11.1)                             1 (7.1)                  1.000i
Baseline tumor size, mm                                                 83.2d (40.5-178.1)                  51.0 (11.5-101.8)              0.042h
Baseline thyroglobulin, ng/mL                                          1041.4e (5.3-273,440)               334.4 (2.6-19,837)              0.664h
anti-thyroglobulin antibody                 ≥28.0 IU/ml, n (%)               3 (37.5)e                          4 (33.3)f                  1.000i

aECOG: Eastern Cooperative Oncology Group performance status; bTKI: tyrosine kinase inhibitors; cTwo patients in the non-sarcopenia group
received lenvatinib after sorafenib. The reasons for switching TKI was adverse effects in one patient, and serum thyroglobulin increase in the other
patient. One patient in the non-sarcopenia group received sorafenib after lenvatinib because of adverse effects; dn=8 patients with at least one
measurable lesion; en=8, missing data was excluded; fn=12, missing data was excluded; hMann-Whitney U-test; iFisher’s exact test.

Patients and Methods                                                        Measurement of muscle mass. As described previously, sarcopenia
                                                                            is determined according to the method briefly described below
Patients and study design. In this retrospective study, patients            (11-13). After cross-sectional computed tomography (CT)
treated for advanced thyroid cancer using lenvatinib, sorafenib, or         imaging at the caudal end of the third lumbar vertebra level,
both drugs interchanged, were selected from June 2014 to January            skeletal muscle was measured, and skeletal muscle areas,
2019 at the Kanazawa University Hospital.                                   including the psoas, erector spinae, quadratus lumborum,

402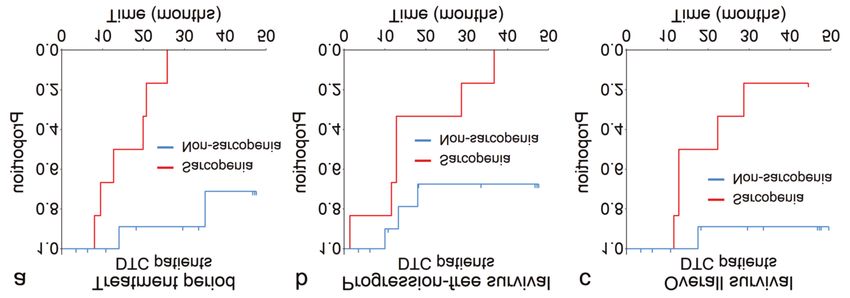
Nishiyama et al: Relationship Between Sarcopenia and Advanced Thyroid Cancer Patients

Figure 1. Overall survival (OS), progression-free survival (PFS), and treatment time (TP) for all patients with advanced thyroid cancer treated with
molecular targeted therapy. The Kaplan-Meier curves estimating OS (a), PFS (b), and TP (c) in 23 patients with advanced thyroid cancer.

Table II. Survival analysis between SG and NSG.

Survival time                                All patients (n=23)                                             DTC patients (n=18)

                         n         Median       95%CI        95%CI        p-Value         n        Median        95%CI       95%CI         p-Value
                                  (months)      Lower        Upper       (log-rank)               (months)       Lower       Upper       (log-rank)

OS
  All                   23          28.7          12.8         NR            -           18          NR           12.8         NR            -
  Sarcopenia             9          12.8           4.9         28.7        0.006          6          17.6         11.6         NR          0.005
  Non-sarcopenia        14          NR            17.5         NR                        12          NR           17.5         NR
PFS
  All                   23          13.3          10.0         NR            -           18          28.7         12.8         NR            -
  Sarcopenia             9          11.6           1.4         28.7        0.003          6          12.8          1.4         NR          0.001
  Non-sarcopenia        14          NR            10.0         NR                        12          NR           10.0         NR
TP
  All                   23          25.8          9.5          NR            -           18          35.1         14.0         NR             -
  Sarcopenia             9          12.7          4.5          20.7        0.001          6          11.1          3.3         NR          1.0 mg/dl) and hypoalbuminemia (Alb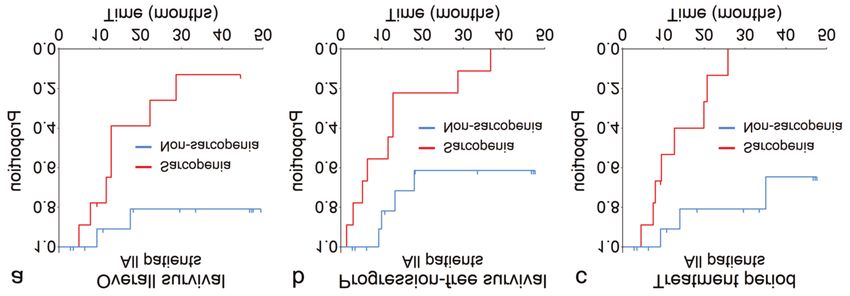
in vivo 35: 401-410 (2021)

Figure 2. Overall survival (OS), progression-free survival (PFS), and treatment time (TP) for differentiated thyroid cancer patients treated with
molecular targeted therapy. The Kaplan-Meier curves estimating OS (a), PFS (b), and TP (c) in 18 differentiated thyroid cancer patients.

Table III. Objective response.

Objective response                           All patients (n=23)                                            DTC patients (n=18)

                         n          RR          p-Value       DCR       p-Value         n          RR           p-Value     DCR        p-Value
                                   n (%)        (Fisher)      n (%)     (Fisher)                  n (%)         (Fisher)    n (%)      (Fisher)

All                      23      13 (56.5)         -        22 (95.7)      -            18      12 (66.7)          -       17 (94.4)      -
Sarcopenia                9       4 (44.4)       0.417       8 (88.9)    0.391           6       3 (50.0)        0.344      5 (83.3)    0.333
Non-sarcopenia           14       9 (64.3)                  14 (100)                    12       9 (75.0)                  12 (100)

DTC: Differentiated thyroid carcinoma; RR: response rate; DCR: disease control rate.

Efficacy of molecular targeted therapy. Using Computed                    cause. PFS was defined as the time from the start of molecular
Tomography imaging, objective tumor responses were assessed               targeted therapy until the date of the first documentation of disease
according to the Response Evaluation Criteria in Solid Tumors             progression or death owing to any cause. Treatment period (TP) was
(RECIST), version 1.1 (19). We analyzed efficacy of molecular             defined as the time from the start of molecular targeted therapy to
targeted therapy in all patients as well as in a subgroup of patients     disease progression, death owing to any cause, or treatment
presenting DTC (DTC patients) alone. Firstly, these patients were         cessation. Survival curves (OS, PFS, and TP) for SG and NSG were
divided into SG and NSG. Secondly, we conducted survival analyses         estimated using the Kaplan-Meier method and compared using the
and assessed the response rate (RR) as well as the disease control        stratified log-rank test. Moreover, the impacts of sarcopenia and
rate (DCR). Lastly, we analyzed survival time based on nutrition          other nutritional markers were evaluated using the Cox proportional
indexes, other than sarcopenia, for all patients and DTC patients.        hazard model. Quantitative and ordinal variables, such as grades of
                                                                          AE between the two groups were non-parametrically analyzed using
Safety. Toxicities were evaluated in accordance with the National         the Mann-Whitney U-test with box whisker plots. The lengths of the
Cancer Institute Common Terminology Criteria for Adverse Events           boxes referred to the interquartile range (IQR), with the middle lines
(CTCAE) version 5.0 (20). For common adverse events (AE), we              representing the median values in each group. The upper whiskers
assessed the grade of AE, while for severe adverse events (SAE),          referred to the largest observations no more than upper
we assessed their frequency.                                              hinges+1.5×IQR, and the lower whiskers referred to the smallest
                                                                          observations no less than lower hinge-1.5×IQR. Outliers in data,
Statistics. Statistical analyses were performed using the R software      beyond the end of the whiskers, were plotted individually. The ratio
version 3.5.1 (the R Foundation for Statistical Computing, Vienna,        difference between groups was analyzed using Fisher’s exact test.
Austria). For survival analyses, the initial date of reckoning was        The correlation between sarcopenia and other nutritional markers
defined as the start day for molecular targeted therapy. If patients      was determined using Spearman’s rank correlation coefficient,
received both lenvatinib and sorafenib, the initial date of reckoning     described graphically in a correlation matrix.
was defined as the first day of either drug, whichever was                   The scatter plot matrix is presented using bivariate scatter plots
administered first. Overall survival (OS) was defined as the time         below the diagonal, histograms on the diagonal, and the Spearman’s
from the start of molecular targeted therapy until death owing to any     rank correlation coefficient above the diagonal. SARC, sarcopenia

404
Nishiyama et al: Relationship Between Sarcopenia and Advanced Thyroid Cancer Patients

Table IV. Hazard ratios of baseline nutritional markers based on Cox proportional hazard model (univariate analyses).

Cox proportional                          All patients (n=23)                                           DTC patients (n=18)
hazard model
                       HR            95%CI           95%CI          p-Value              HR            95%CI             95%CI       p-Value
                                     Lower           Upper                                             Lower             Upper

OS
  Sarcopenia          6.892          1.409           33.710            0.017           11.43            1.317            99.21         0.027
  BMI                 0.954          0.833            1.093            0.496            0.973           0.828             1.143        0.734
  Alb                 0.227          0.068            0.758            0.016            0.075           0.010             0.549        0.011
  PNI                 0.905          0.821            0.998            0.045            0.852           0.743             0.978        0.023
  GPS                 2.342          1.124            4.880            0.023            3.674           1.358             9.939        0.010
  NLR                 1.106          0.925            1.323            0.270            1.180           0.960             1.449        0.115
  PLR                 1.001          0.998            1.004            0.513            1.002           0.998             1.005        0.292
  CAR                 3.604          1.024           12.69             0.046            8.265           1.378            49.56         0.021
PFS
  Sarcopenia          5.084          1.543           16.75             0.008            5.050           1.242            20.53         0.024
  BMI                 0.921          0.820            1.035            0.166            0.954           0.835             1.089        0.482
  Alb                 0.232          0.085            0.634            0.004            0.180           0.050             0.653        0.009
  PNI                 0.910          0.842            0.983            0.017            0.901           0.820             0.990        0.030
  GPS                 2.249          1.186            4.268            0.013            2.527           1.161             5.499        0.019
  NLR                 1.109          0.956            1.285            0.171            1.135           0.954             1.350        0.153
  PLR                 1.001          0.999            1.003            0.378            1.001           0.998             1.004        0.372
  CAR                 3.286          1.151            9.385            0.026            3.332           0.791            14.04         0.101
TP
  Sarcopenia          9.808          2.010           47.870            0.005           17.92            2.087           153.900        0.009
  BMI                 0.945          0.828            1.080            0.406            0.954           0.814             1.118        0.564
  Alb                 0.247          0.080            0.763            0.015            0.1002          0.019             0.522        0.006
  PNI                 0.910          0.832            0.995            0.038            0.868           0.772             0.975        0.017
  GPS                 2.329          1.127            4.814            0.022            3.686           1.374             9.888        0.010
  NLR                 1.139          0.955            1.358            0.149            1.236           1.004             1.523        0.046
  PLR                 1.002          0.999            1.004            0.302            1.003           0.999             1.006        0.123
  CAR                 3.284          0.958           11.26             0.059            8.445           1.396            51.09         0.020

95%CI: 95% Confidence interval; HR: hazard ratio; DTC: differentiated thyroid carcinoma; OS: overall survival; PFS: progression-free survival;
TP: treatment period; BMI: body mass index (kg/m2); Alb: serum albumin (g/dl); PNI: prognostic nutrition index; GPS: Glasgow prognostic score;
NLR: neutrophil-to-lymphocyte ratio; PNR: platelet-to-lymphocyte ratio; CAR: CRP-albumin ratio.

(0, non-sarcopenia; 1, sarcopenia); BMI, body mass index (kg/m2);         Efficacy for all patients. In SG the median OS was 12.8
Alb, serum albumin (g/dl); PNI, prognostic nutrition index (no unit,      months [95% confidence interval (CI)=4.9-28.7] while in NSG
only value); GPS, Glasgow prognostic score (no unit, just number);        OS was not reached (NR) (95%CI=17.5-NR). In SG the
NLR, neutrophil-to-lymphocyte ratio (no unit, only value); PLR,
                                                                          median PFS was 11.6 months (95%CI=1.4-28.7) while in
platelet-to-lymphocyte ratio (no unit, only value); CAR, CRP-
albumin ratio (no unit, only value).                                      NSG PFS was not reached (95%CI=10.0-NR). The median TP
                                                                          in SG was 12.7 months (95%CI=4.5-20.7) while in NSG TP
Ethical consideration. The protocol for this investigation was            was not reached (95%CI=14.0-NR) (Table ΙΙ). Figure 1
approved by the Institutional Review Board of the Kanazawa                demonstrates the Kaplan-Meier curves of OS, PFS, and TP.
University Hospital (2016-22, 2017-312).                                     As for RR and DCR, there were no significant differences
                                                                          were observed between SG and NSG (Table ΙΙΙ). Table IV
Results                                                                   presents the survival analyses based on nutrition indexes.
                                                                          Baseline albumin, PNI, and GPS significantly affected the
Patients’ characteristics. Table I presents details regarding             survival time. Compared to patients presenting a lower PNI,
patients’ background. SG included 9 patients, while NSG                   patients with a higher PNI demonstrated better OS, PFS, and
included 14 patients. Overall, 14 patients were diagnosed                 TP. In contrast, patients with higher GPS scores demonstrated
with radioiodine-refractory DTC, 4 patients were diagnosed                a worse prognosis for OS, PFS, and TP.
with poorly DTC, and 5 patients were diagnosed with ATC.
The body weight, body surface area, and BMI differed                      Efficacy for DTC patients. In SG the median OS was 17.6
significantly between SG and NSG.                                         months (95%CI=11.6-NR), while in NSG this was not

                                                                                                                                         405
in vivo 35: 401-410 (2021)

Figure 3. The correlation value of sarcopenia and several nutrition indexes. SARC: Sarcopenia; BMI: body mass index; Alb: albumin; PNI:
prognostic nutrition index; GPS: Glasgow prognostic score; NLR: neutrophil-to-lymphocyte ratio; PLR: platelet-to-lymphocyte ratio; CAR: CRP-
albumin ratio; *p
Nishiyama et al: Relationship Between Sarcopenia and Advanced Thyroid Cancer Patients
Figure 4. The adverse effects unique to the sarcopenia and non-sarcopenia groups.
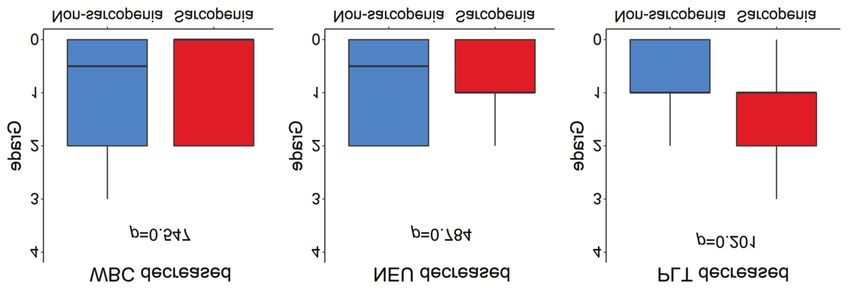
Figure 5. The hematological toxicities do not significantly differ between the sarcopenia group and non-sarcopenia groups. WBC: White blood cell;
NEU: neutrophil; PLT: platelet.
anemia, and that of popular non-hematologic toxicities Discussion
related to lenvatinib or sorafenib, such as proteinuria and
hypertension, had no significant difference between SG and In the field of digestive cancer, nutrition assessment as a
NSG. Moreover, the incidence of complications related to prognostic factor has been extensively reported. Recently, NLR,
anti-angiogenesis agent, such as fistula, had no difference one strategy for nutrition assessment, has been reported as a
between SG and NSG (Figures 5 to 7). prognostic factor in DTC patients undergoing molecular
407in vivo 35: 401-410 (2021) Figure 6. The non-hematological toxicities do not significantly differ between the sarcopenia and non-sarcopenia groups. AST: Aspirate aminotransferase; ALT: alanine aminotransferase. targeted therapy (21). Moreover, patients with poorly DTC or agents in all patients with advanced thyroid cancer. Second, ATC have demonstrated significantly higher NLR than DTC sarcopenia strongly correlated with albumin, PNI, and GPS, patients, and NLR could be used as a new diagnostic criterion which could be additional prognostic factors. Third, DTC to discriminate against aggressive thyroid cancers (22). patients demonstrated the same trend as all other patients. Moreover, reports concerning thyroid cancer and nutrition In the case of patients who develop RAI refractory assessment have been gaining momentum. As patients with differentiated cancer, it is important to decide when to advanced thyroid cancer can use fewer molecular targeted introduce molecularly targeted agents in clinical settings. agents, it is crucial to determine the best time for drug Based on the findings of this study, muscle mass and introduction, ensuring both safety and effectiveness. nutritional status before therapy could be associated with Furthermore, in various digestive disorders including cancers, patient prognosis. According to the above results, as well as sarcopenia is reportedly associated with postoperative mortality, the report stating that nutritional intervention can improve recurrence, and the development of adverse effects and the prognosis in patients with cancer (25, 26), patients should complications (23, 24). Based on these reports, we investigated carefully monitor their muscle mass regularly, modulating how sarcopenia, as well as the nutritional status before the their nutritional status from a medical perspective. initiation of molecular targeted therapy, may influence the Interestingly, for molecularly targeted agents, profiles of AE prognosis and toxicity of molecularly targeted agents in patients differ depending on the presence or absence of sarcopenia. SG with advanced thyroid cancer. demonstrated a higher grade of anemia, infection, and nausea In this study, we obtained the following results. First, than NSG; conversely, NSG presented a higher grade of HFS sarcopenia could be used as a prognostic and predictive factor than SG. As disease conditions in SG were worse compared for assessing the therapeutic effects of molecularly targeted to what was observed in NSG, it was considered that SG 408
Nishiyama et al: Relationship Between Sarcopenia and Advanced Thyroid Cancer Patients

Figure 7. Complications related to molecular targeted therapy do not significantly differ between the sarcopenia and non-sarcopenia groups.

experienced anemia owing to exhaustion produced by                        Authors’ Contributions
advanced thyroid cancer. Furthermore, some reports suggest
that sarcopenia possesses the risk to induce infection (27-30).           YS and SY were involved with concept and design of this study and
                                                                          manuscript. YS, MF, AT and KO were involved with collecting data.
Regarding the relationship between sarcopenia and nausea, we
                                                                          YS and SY proofread the manuscript. All Authors have read and
speculated that nausea induced a decline in food intake,                  approved the final version of the edited manuscript.
resulting in malnutrition and sarcopenia.
   NSG possessed sufficient muscle mass for active                        References
performance, consequently developing HFS easily. To
understand this phenomenon from another standpoint, as SG                 1 Incidence rate of thyroid cancer in Japan. Available at:
demonstrated less muscle mass, muscle weakness, and low                     https://www.env.go.jp/chemi/rhm/h29kisoshiryo/h29kiso-03-07-
levels of physical activity, the palms and soles experienced                19.html [Last accessed 31th March 2017]
less load, and hence, less HFS.                                           2 Prete A, de Souza PB, Censi S, Muzza M, Nucchi N and
                                                                            Sponziello M: Update on fundamental mechanisms of thyroid
   Additionally, no significant difference was observed between
                                                                            cancer. Front Endocrinol (Lausanne) 11: 102, 2020. PMID:
tumor responses in SG and NSG. Based on reports from the                    32231639. DOI: 10.3389/fendo.2020.00102
World Congress on Thyroid Cancer 3.5, in the SELECT trial                 3 Brose MS, Nutting CM, Jarzab B, Elisei R, Siena S, Bastholt L,
(4), post hoc analysis on NLR presented no significant                      de la Fouchardiere C, Pacini F, Paschke R, Shong YK, Sherman
difference in RR between NLR≤3 and NLR>3, indicating that                   SI, Smith JWA, Chung J, Kappeler C, Peña C, Molnár I,
this result is consistent with the findings of the current study.           Schlumberger MJ and DECISION Investigators: Sorafenib in
                                                                            radioactive iodine-refractory, locally advanced or metastatic
   Some limitations related to this study include its
                                                                            differentiated thyroid cancer: a randomised, double-blind, phase
retrospective nature, the small sample size, and the fact that              3 trial. Lancet 384(9940): 319-328, 2014. PMID: 24768112.
sarcopenia is not common in clinical oncology. To resolve                   DOI: 10.1016/S0140-6736(14)60421-9
these limitations, we plan to conduct a prospective                       4 Schlumberger M, Tahara M, Wirth LJ, Robinson B, Brose MS,
multicenter trial investigating the impact of sarcopenia on                 Elisei R, Habra MA, Newbold K, Shah MH, Hoff AO,
patient prognosis, as well as the adverse effect profile of                 Gianoukakis AG, Kiyota N, Taylor MH, Kim SB, Krzyzanowska
molecular targeted therapy when introduced by physicians in                 MK, Dutcus CE, de las Heras B, Zhu J and Sherman SI:
                                                                            Lenvatinib versus placebo in radioiodine-refractory thyroid cancer.
patients with advanced thyroid cancer.                                      N Engl J Med 372(7): 621-630, 2015. PMID: 25671254. DOI:
   In conclusion, sarcopenia could be a prognostic factor in                10.1056/NEJMoa1406470
patients with advanced thyroid cancer receiving molecular                 5 Davis L and Welth HG: Increasing incidence of thyroid
targeted therapy. Therefore, routine evaluation of muscle mass              cancer in the United States, 1973-2002. JAMA 295(18):
and nutritional status may be beneficial in patients with                   2164-2167, 2006. PMID: 16684987. DOI: 10.1001/jama.
advanced thyroid cancer undergoing molecular targeted therapy.              295.18.2164
                                                                          6 Nikiforova MN and Nikiforov YE: Molecular diagnostic and
                                                                            predictors in thyroid cancer. Thyroid 19(12): 1351-1361, 2009.
Conflicts of Interest                                                       PMID: 19895341. DOI: 10.1089/thy.2009.0240
                                                                          7 Tahara M, Kiyota N, Yamazaki T, Chayahara N, Nakano K Inagaki
SY obtained a research grant from Eisai Inc. Other Authors have no          L, Toda K, Enokida T, Minami H, Imamura Y, Sasaki T, Suzuki T,
potential conflicts of interest.                                            Fujino K, Dutcus CE and Takahashi S: Lenvatinib for anaplastic

                                                                                                                                              409
in vivo 35: 401-410 (2021)
thyroid cancer. Front Oncol 7: 25, 2017. PMID: 28299283. DOI: 20 Common Terminology Criteria for Adverse Events (CTCAE) v5.0.
10.3389/fonc.2017.00025 Available at: https://ctep.cancer.gov/protocolDevelopment/electronic_
8 McMillan DC: The systemic inflammation-based Glasgow applications/ctc.htm#ctc_50 [Last accessed 4th October 2020]
Prognostic Score: a decade of experience in patients with cancer. 21 Ozmen S, Timur O, Calik I, Altinkaynak K, Simsek E, Gozcu H,
Cancer Treat Rev 39(5): 534-540, 2013. PMID: 22995477. DOI: Arslan A and Carliglu A: Neutrophil-lymphocyte ratio (NLR) and
10.1016/j.ctrv.2012.08.003 platelet-lymphocyte ratio (PLR) may be superior to C-reactive
9 Huang DD, Zhou CJ, Wang SL, Mao ST, Zhou XY, Lou N, Zhang protein (CRP) for predicting the occurrence of differentiated
Z, Yu Z, Shen X and Zhuang C: Impact of different sarcopenia thyroid cancer. Endocr Regul 51(3): 131-136, 2017. PMID:
stages on the postoperative outcomes after radical gastrectomy for 28858848. DOI: 10.1515/enr-2017-0013
gastric cancer. Surgery 161(3): 680-693, 2017. PMID: 27712873. 22 Cho JS, Park MH, Ryu YJ, Yoon JH: The neutrophil to lymphocyte
DOI: 10.1016/j.surg.2016.08.030 ratio can discriminate anaplastic thyroid cancer against poorly or
10 Deng HY, Zha P, Peng L, Hou L, Huang KL and Li XY: well differentiated cancer. Ann Surg Treat Res 88(4): 187-192,
Preoperative sarcopenia is a predictor of poor prognosis of 2015. PMID: 25844352. DOI: 10.4174/astr.2015.88.4.187
esophageal cancer after esophagectomy: a comprehensive 23 Nishikawa H, Yoh K, Enomoto H, Iwata Y, Sakai Y, Kishino K,
systematic review and mata-analysis. Dis Esophagus 32(3): Shimono Y, Ikeda N, Takashima T, Aizawa N, Takata R, Hasegawa
doy115, 2019. PMID: 30496385. DOI: 10.1093/dote/doy115 K, Koriyama T, Yuri Yukihisa, Nishimura T, Nishiguchi S and
11 Hamaguchi Y, Kaido T, Okumura S, Kobayashi A, Shirai H, Yagi Iijima H: Sarcopenia and frailty in chronic liver damage: common
S, Kamo N, Okajima H and Uemoto S: Impact of skeletal muscle and different points. In Vivo 34(5): 2549-2559, 2020. PMID:
index, intramuscular adipose tissue content, and visceral to 32871784. DOI: 10.21873/invivo.12072
subcutaneous adipose tissue area ratio on early mortality of living 24 Hsueh SW, Liu KH, Hung CY, Tsai CY, Hsu JT, Tsang NM, Hsueh
donor liver transplantation. Transplantation 101(3): 565-574, 2017. WH, Yang C and Chou WC: Predicting postoperative events in
PMID: 27926595. DOI: 10.1097/TP.0000000000001587 patients with gastric cancer: a comparison of five nutrition
12 Vledder MGv, Levolger S, Ayez N, Verhoef C, Tran TCK and assessment tools. In Vivo 34(5): 2803-2809, 2020. PMID:
Ijzermans JNM: Body composition and outcome in patients 32871818. DOI: 10.21873/invivo.12106
undergoing resection of colorectal liver metastases. Br J Surg 25 Qiu Y, You J, Wang K, Cao Y, Hu Y, Zhang H, Fu R, Sun Y, Chen
99(4): 550-557, 2012. PMID: 22246799. DOI: 10.1002/bjs.7823 H, Yuan L and Lyu Q: Effect of whole-course nutrition management
13 Yoshizumi T, Shirabe K, Nakagawa H, Ikegami T, Harimoto N, on patients with esophageal cancer undergoing concurrent
Toshima T, Yamashita Y, Ikeda T, Soejima Y and Mehara Y: chemoradiotherapy: A randomized control trial. Nutrition 69:
Skeletal muscle area correlates with body surface area in healthy 110558, 2020. PMID: 31526964. DOI: 10.1016/j.nut.2019.110558
adults. Hepatol Res 44(3): 313-318, 2014. PMID: 23607375. DOI: 26 Van Blarigan EL, Fuchs CS, Niedzwiecki D, Zhang S, Saltz LB,
10.1111/hepr.1211 Mayer RJ, Mowat RB, Whittom R, Hantel A, Benson A, Atienza
14 Forrest LM, McMillan DC, McArdle CS, Angerson WJ and D, Messino M, Kindler H, Venook A, Ogino S, Giovannucci EL,
Dunlop DJ: Evaluation of cumulative prognostic scores based on Ng K and Meyerhardt JA: Association of survival with adherence
the systemic inflammatory response in patients with inoperable to the American Cancer Society nutrition and physical activity
nonsmall-cell lung cancer. Br J Cancer 89(6): 1028-1030, 2003. guidelines for cancer survivors after colon cancer diagnosis: The
PMID: 12966420. DOI: 10.1038/sj.bjc.6601242 CALGB 89803/Alliance trial. JAMA Oncol 4(6): 783-790, 2018.
15 Kanda M, Fujii T, Kodera Y, Nagai S, Takeda S and Nakao A: PMID: 29710284. DOI: 10.1001/jamaoncol.2018.0126
Nutritional predictors of postoperative outcome in pancreatic 27 Babu JM, Kalagara S, Durand W, Antoci V, Deren ME and Cohen
cancer. Br J Surg 98(2): 268-274, 2011. PMID: 20960457. DOI: E: Sarcopenia as a risk factor for prosthetic infection after total hip
10.1002/bjs.7305 or knee arthroplasty. J Arthroplasty 34(1): 116-122, 2019. PMID:
16 Chiang SF, Hung HY, Tang R, Changchien CR, Chen JS, You YT, 30337254. DOI: 10.1016/j.arth.2018.09.037
Chiang JM and Lin JR: Can neutrophil-tolymphocyte ratio predict 28 Takagi K, Yoshida R, Yagi T, Umeda Y, Nobuoka D, Kuise T and
the survival of colorectal cancer patients who have received Fujiwara T: Radiographic sarcopenia predicts postoperative infectious
curative surgery electively? Int J Colorectal Dis 27(10): 1347-1357, complications in patients undergoing pancreaticoduodenectomy.
2012. PMID: 22460305. DOI: 10.1007/s00384-012-1459-x BMC Surg 17(1): 64, 2017. PMID: 28549466. DOI: 10.1186/s12893-
17 Wu Y, Li C, Zhao J, Yang L, Liu F, Zheng H, Wang Z and Xu Y: 017-0261-7
Neutrophil-to-lymphocyte and platelet-to-lymphocyte ratios predict 29 Fujikawa H, Araki T, Okita Y, Kondo S, Kawamura M, Hiro J,
chemotherapy outcomes and prognosis in patients with colorectal Toiyama Y, Kobayashi M, Tanaka K, Inoue Y, Mohri Y, Uchida K
cancer and synchronous liver metastasis. World J Surg Oncol 14(1): and Kusunoki M: Impact of sarcopenia on surgical site infection
289, 2016. PMID: 27852294. DOI: 10.1186/s12957-016-1044-9 after restorative proctocolectomy for ulcerative colitis. Surg Today
18 Ishizuka M, Nagata H, Takagi K, Iwasaki Y, Ghibuya N and 47(1): 92-98, 2017. PMID: 27255541. DOI: 10.1007/s00595-016-
Kubota K: Clinical significance of the C-reactive protein to 1357-x
albumin ratio for survival after surgery for colorectal cancer. Ann 30 Lieffers JR, Bathe OF, Fassbender K, Winget M and Baracos VE:
Surg Oncol 23(3): 900-907, 2016. PMID: 26530445. DOI: Sarcopenia is associated with postoperative infection and delayed
10.1245/s10434-015-4948-7 recovery from colorectal cancer resection surgery. Br J Cancer 107(6):
19 Eisenhauer EA, Therasse P, Bogaerts J, Schwartz LH, Sargent D, 931-936, 2012. PMID: 22871883. DOI: 10.1038/bjc.2012.350
Ford R, Dancey J, Arbuck S, Gwyther S, Mooney M, Rubinstein
L, Shankar L, Dodd L, Kaplan R, Lacombe D and Verweij J: New
response evaluation criteria in solid tumours: revised RECIST Received August 29, 2020
guideline (version 1.1). Eur J Cancer 45(2): 228-247, 2009. PMID: Revised October 10, 2020
19097774. DOI: 10.1016/j.ejca.2008.10.026 Accepted October 16, 2020
410You can also read