SCREENING LEVEL ASSESSMENT OF AMBIENT LEAD CONCENTRATIONS AROUND THE MIDDLETON WISCONSIN MUNICIPAL AIRPORT - Town of Middleton
←
→
Page content transcription
If your browser does not render page correctly, please read the page content below

SCREENING LEVEL ASSESSMENT OF
 AMBIENT LEAD CONCENTRATIONS
AROUND THE MIDDLETON WISCONSIN
 MUNICIPAL AIRPORT

 Prepared By:

 Jeremias Szust
 Jim Lyons

 TRINITY CONSULTANTS
 7919 Folsom Blvd
 Suite 320
 Sacramento, CA 95826

 Jeremy Heiken
 Oak Leaf Environmental, Inc.
 8141 Mast Road
 Dexter, MI 48130

 March 18, 2022
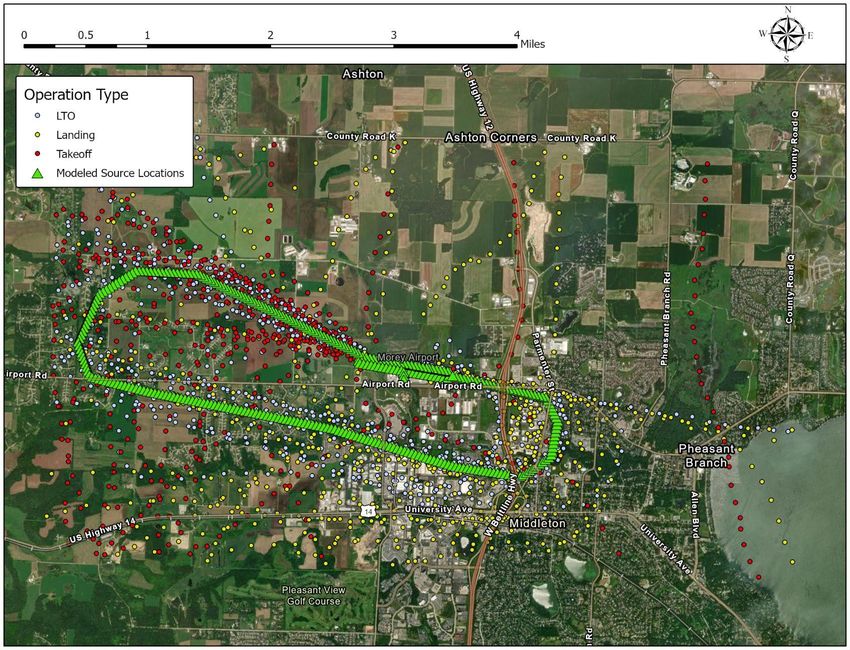
TABLE OF CONTENTS

1. PROJECT INFORMATION 1-1
 1.1 Project Description ................................................................................................... 1-1
 1.2 Site Description......................................................................................................... 1-1

2. DEVELOPMENT OF AIRCRAFT LEAD EMISSIONS DATA 2-1
 2.1 Annual Operations and Temporal Allocation ............................................................. 2-1
 2.2 Operation Modes and Time in Mode .......................................................................... 2-3
 2.3 Aircraft Data and Fuel Flow Rates ............................................................................. 2-4
 2.4 Airport Inventory Results.......................................................................................... 2-5
 2.5 Inventory Comparison and Other Sources of Lead Emissions .................................... 2-7
 2.6 Spatial Allocation ...................................................................................................... 2-8

3. AIR DISPERSION MODELING INPUTS 3-1
 3.1 Model Selection ......................................................................................................... 3-1
 3.2 Meteorological Data .................................................................................................. 3-1
 3.3 Urban versus Rural Determination ............................................................................ 3-1
 3.4 Receptor Grid ............................................................................................................ 3-4
 3.5 Terrain Data .............................................................................................................. 3-4
 3.6 Modeling Parameters ................................................................................................ 3-4
 3.7 Emission Source Parameters ..................................................................................... 3-4

4. AIR DISPERSION MODELING RESULTS 4-1

 i

LIST OF FIGURES

Figure 1-1. C29 Airport 1-1

Figure 2-1. 2021 Monthly Lead (Pb) Emissions and Piston Operations 2-6

Figure 2-2. Spatial Allocation of On-the-Ground Emissions 2-9

Figure 3-1. Airport Land-Use Imagery 3-3

Figure 3-2. July 30, 2017, Flight Track Data 3-5

Figure 3-3. Modeled Source Locations Reference 3-7

Figure 3-4. Modeled Source by Operations Type 3-8

Figure 4-1. Max Monthly Impacts 4-2

Figure 4-2. Annual Impacts 4-3

Figure 4-3. Maximum Monthly Impact Season 4-4

 ii
LIST OF TABLES

Table 2-1. Estimated 2021 Piston Aircraft Operations at C29 2-2

Table 2-2. Percent Operations by Month, MSN (2013-2019) 2-2

Table 2-3. Day-of-Week Factors, MSN (2013-2019) 2-3

Table 2-4. Apportionment of Daily Operations by Time Period, C29 2-3

Table 2-5. Operation Modes and Time in Mode 2-4

Table 2-6. Estimated Fuel Flow Rates (lb./hr.) by Operation Mode at C29 2-5

Table 2-7. Estimated 2021 Lead Inventory and Piston Operations for C29 2-6

Table 2-8. 2021 Lead Inventory Comparison to EPA’s 2017 NEI 2-7

Table 2-9. Other Lead Sources within 10 miles of C29, EPA’s 2017 NEI 2-8

Table 3-1. Airport Land-Use Analysis 3-1

Table 4-1. Points of Interest and Impacts from Nearest Receptors 4-1

 iii

1. PROJECT INFORMATION

 1.1 Project Description
Trinity Consultants and Oak Leaf Environmental were asked by the Town of Middleton, Wisconsin to conduct
a screening-level analysis to evaluate ambient concentrations of lead in the air around the Middleton
Municipal Airport (C29). This effort involved two main components: 1) the development of spatially resolved
estimates of lead emissions from the operation of piston-powered aircraft (which use lead aviation gasoline)
at and around the airport and 2) dispersion modeling required to translate the lead emissions estimates into
estimates of ambient lead concentrations. This report summarizes the results of the C29 airport analysis.

 1.2 Site Description
C29 is located in the City of Middleton, WI. The Universal Transverse Mercator (UTM) coordinates for the
center of the airport, in 1983 North American Datum (NAD83), are as follows:

 ► 293,918.5 meters (m) Easting;
 ► 4,776,533.4 m Northing;
 ► Zone: 16.

Figure 1-1 below shows the general layout and location of the airport

 Figure 1-1. C29 Airport

Town of Middleton/City of Middleton Municipal Airport – Morey Field C29 Lead Modeling Report
Trinity Consultants 1-1
2. DEVELOPMENT OF AIRCRAFT LEAD EMISSIONS DATA

In this section, the development of the spatially and temporally resolved lead emissions inventory used in
the C29 screening analysis is described. The emission inventory estimating procedures followed published
guidelines of the US Environmental Protection Agency (EPA)1 and Transportation Research Board’s Airport
Cooperative Research Program (ACRP).2 The procedures are considered screening-level in that four
simplifying assumptions were employed.

 1. All operations are modeled as standard takeoffs and landings.
 2. The lead content of aviation gasoline is the maximum allowable (2.12 g/gal).
 3. All operations are assigned to Runway 10(east)/28(west) with takeoffs occurring to the west on runway
 28.
 4. All operations are assigned to a single flight track assumption circling back to the airport
 characteristic of flight school operations

The discussion of the calendar year 2021 lead inventory is presented in the following topics.

 • Annual Operations and Temporal Allocation
 • Operation Modes and Time in Mode
 • Aircraft Data and Fuel Flow Rates
 • Airport Inventory Results
 • Inventory Comparison and Other Sources of Lead Emissions
 • Spatial Allocation

 2.1 Annual Operations and Temporal Allocation
The 2021 annual operations for piston-aircraft operating at C29 were derived from the Master Plan.3 The
base year of the Master Plan is 2019. Estimates for calendar year 2021 were developed by interpolation of
estimates for calendar years 2019 and 2024 presented in Table 2-23 of the Master Plan. Operations for
2021 were approximately 1 percent higher than in 2019. The annual operations were assigned to aircraft by
engine type (i.e., piston and jet), fleet type, and trip type (i.e., local and itinerant) using the data presented
in Table 2-14 and Appendix A of the Master Plan. The C29-based aircraft are distinguished by flight- school,
other airport-based fixed-wing (FW), and rotorcraft fleets. The resulting annual operations for piston aircraft
are presented in Table 2.1. The 2021 inventory analysis is based on 40,253 piston aircraft operations.
Temporal activity profiles were developed to allocate the estimated annual operations to individual months,
days, and hours.

1 https://www.epa.gov/regulations-emissions-vehicles-and-engines/epas-data-and-analysis-piston-engine-aircraft-emissions
2 ACRP projects 02-34 and 02-57 include the development of “best practices” guidance for estimating Pb emission from
aircraft intended to supplement EPA inventory modeling procedures:
https://apps.trb.org/cmsfeed/TRBNetProjectDisplay.asp?ProjectID=3035 and
https://apps.trb.org/cmsfeed/TRBNetProjectDisplay.asp?ProjectID=3703.
3 Airport Master Plan | Middleton, WI - Official Website (cityofmiddleton.us)

Town of Middleton/City of Middleton Municipal Airport – Morey Field C29 Lead Modeling Report
Trinity Consultants 2-1
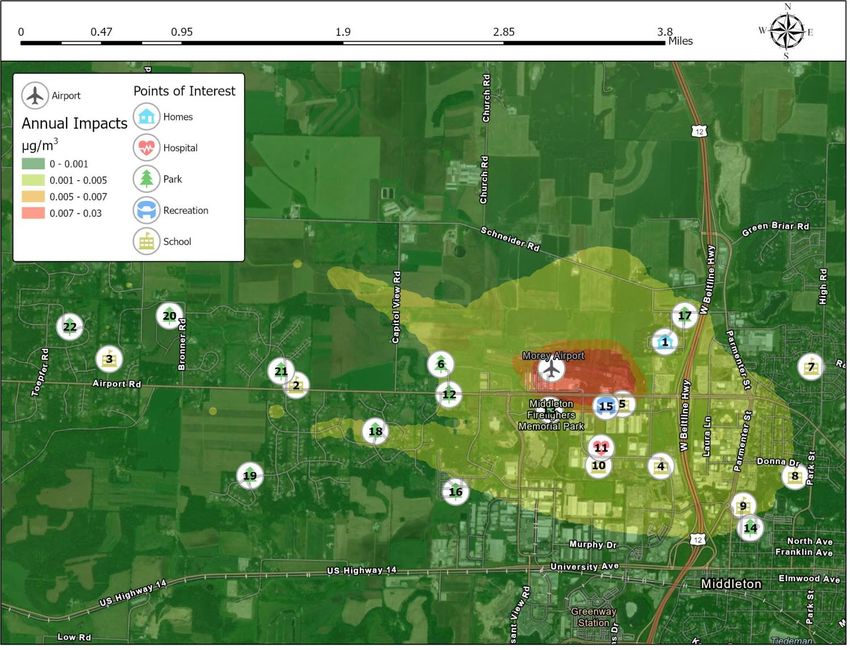
Table 2-1. Estimated 2021 Piston Aircraft Operations at C29
 Fleet Itinerant Local Total
 Flight School, Piston 4,366 25,593 29,959
 Other Airport-Based FW, Piston 9,252 0 9,252
 Rotorcraft, Piston 0 271 271
 Charter / Air Taxi, Piston* 26 0 26
 Other Non-Based FW, Piston† 745 0 745
 Total Piston Operations‡ 14,389 25,864 40,253
 * In the absence of local data, the piston share of charter and air taxi operations (22
 percent) was taken from ACRP (see Footnote 2).
 † In the absence of local data, the piston share of other non-based FW aircraft operations
 was assumed to equal that observed for the airport-based FW aircraft operations (91
 percent).
 ‡ No piston-engine aircraft were assumed for military and freight operations.

Monthly and day-of-week profiles were based on daily general aviation operations data recorded at Dane
County Regional Airport (MSN) given that suitable data are not available for C29. C29 and MSN both serve
the Madison area and are equidistant to both the University of Wisconsin and downtown Madison making
MSN the preferred surrogate of local general aviation activity patterns. Recorded FAA operations data at
MSN, available through the Operations Network (OPSNET)4, over a 7-year period were utilized to estimate
monthly and day-of-week profiles shown in Tables 2-2 and 2-3, respectively. The monthly factorsof Table
2-2 represent the fraction of annual operations occurring within a given month. The day-of-week factors of
Table 2-3 represent multiplicative factors that convert average day operations to estimated operations for
each day of the week. For example, the local day-of-week factor of 1.129 on Tuesdays signifies that local
operations are 12.9 percent higher on Tuesdays versus the week on average.

 Table 2-2. Percent Operations by Month, MSN (2013-2019)
 General Aviation
 Month Itinerant Local
 January 5.7% 6.3%
 February 5.8% 6.8%
 March 7.9% 8.5%
 April 8.0% 8.1%
 May 9.1% 8.8%
 June 8.9% 9.6%
 July 11.4% 9.8%
 August 9.8% 9.3%
 September 9.4% 8.6%
 October 9.5% 8.3%
 November 8.1% 9.1%
 December 6.3% 7.0%

4 https://aspm.faa.gov/opsnet/sys/Main.asp.

Town of Middleton/City of Middleton Municipal Airport – Morey Field C29 Lead Modeling Report
Trinity Consultants 2-2

Table 2-3. Day-of-Week Factors, MSN (2013-2019)
 General Aviation
 Month Itinerant Local
 Sunday 1.014 1.022
 Monday 0.865 0.967
 Tuesday 0.972 1.129
 Wednesday 1.075 1.103
 Thursday 1.079 0.988
 Friday 1.035 0.836
 Saturday 0.960 0.954

The hourly operations profile was derived from Table 4-3 of the Master Plan, which apportioned operations
between daytime (7 am to 10 pm) and nighttime (10 pm to 7 am). These data are summarized in Table 2-
4. Without additional hourly information, it was assumed that operations were apportioned equally to each
hour in the daytime and nighttime periods. It should be noted however that for purposes of dispersion
modeling emissions were only modeled during daytime hours which were assumed to be between 8 am
and 8 pm.

 Table 2-4. Apportionment of Daily Operations by Time Period, C29
 Daytime Operation Nighttime Operation
 (7 am – 10 pm) (10 pm – 7 am)
 Itinerant 90.3% 9.7%
 Local 95.5% 4.5%

 2.2 Operation Modes and Time in Mode
Each aircraft operation is divided into individual operation modes and an estimated time spent in each
mode. Fuel flow rates, and thereby lead emission rates, will vary by operation mode. As noted above, all
operations were assumed to be standard, standalone takeoffs and landings. This assumption is consistent
with standard EPA lead inventory procedures.5 Accordingly, C29 operations are equally apportioned to
takeoffs (50 percent) and landings (50 percent). The operation modes associated with each are presented
in Table 2-5 along with the estimated time spent in each mode.

5A refinement of this assumption would be to evaluate additional operation types associated with flight school training such
as touch-and-go and taxi-back-to-takeoff operations.
Town of Middleton/City of Middleton Municipal Airport – Morey Field C29 Lead Modeling Report
Trinity Consultants 2-3
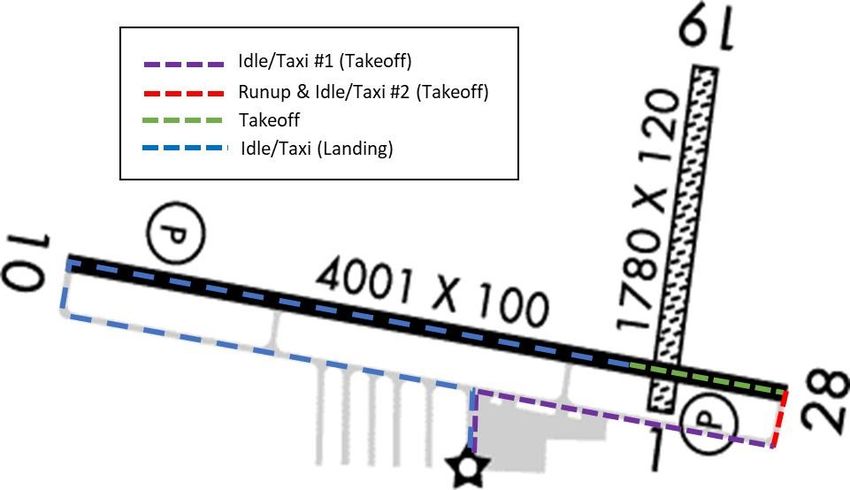
Table 2-5. Operation Modes and Time in Mode
 Time In Mode
 Operation Type Operation Mode (Minutes)
 Taxi & Idle #1 (hangar to runup area) 6.70*
 Taxi & Idle #2 (runup area to top of runway) 5.30*
 Takeoff Runup (magneto test) 0.96†
 Takeoff 0.30‡
 Climb Out (0 – 1,000 ft. AGL) 1.67‡
 Approach (1,000 – 0 ft. AGL) 2.00‡
 Landing
 Taxi & Idle (wheels down to hangar) 4.08†
 * Total taxi/idle time (#1 and #2 combined) of 12 minutes per takeoff taken from EPA (see Footnote
 1); portion of taxi/idle time spent (#2) in runup area taken from ACRP (see Footnote 2).
 † Time in mode estimates taken from ACRP (see Footnote 2).
 ‡ Time in mode estimates taken from EPA (see Footnote 1).

There were no airport-specific estimates of the time-in-mode for C29.6 Time estimates assigned in Table 2-
5 were largely the recommended defaults that the EPA uses in modeling general aviation emissions. The
EPA defaults for climb out and approach modes for fixed-wing piston aircraft, however, were truncated to
1,000 feet above ground level (AGL) traffic pattern altitude (TPA) of C29.7 ACRP was used for the time
spent for the magneto test and the assignment of taxi & idle time spent to the runup area. ACRP was also
used for the elapsed time between wheels down and parking as the EPA time estimate for this mode is a
bit short relative to on-the-ground observations of the ACRP projects.

 2.3 Aircraft Data and Fuel Flow Rates

Appendix A of the Master Plan provides annual operations data and statistics for 100 airport-based aircraft
including N-number, make and model. Engine characteristics (manufacturer, model, and power rating)
were identified and assigned based on the aircraft statistics. The engine data were combined with brake-
specific fuel consumption rates (BSFCs) by engine and EPA assumed engine load points (by operation mode)
to estimate operations-weighted aircraft fuel flow rates. Those rates are presented in Table 2-6. The C29-
based aircraft are distinguished by flight-school, other airport-based fixed-wing (FW) and rotorcraft fleets.
Non-based fleets (air taxi and other non-based) were assigned the same fuel flow rates as other airport-
based FW aircraft in the absence of aircraft or engine specifications on these operations.

6While time-in-mode estimates are not commonly collected, a refinement of this approach would be to measure the average time
spent in each mode at C29.
7EPA estimates of time in climb out and approach modes assumes an altitude of 3,000 ft. AGL for all aircraft – from large
commercial jets to single-engine piston aircraft. 3,000 ft. AGL is a poor assumption for modeling general aviation as these
aircraft operate at a TPA of 1,000 to 1,200 ft. AGL. Also, 1,000 feet AGL equals an elevation of 1,928 feet as the airport
elevation is 928 feet.
Town of Middleton/City of Middleton Municipal Airport – Morey Field C29 Lead Modeling Report
Trinity Consultants 2-4
Table 2-6. Estimated Fuel Flow Rates (lb./hr.) by Operation Mode at C29
 Fleet Takeoff Climb Out Approach Taxi/Idle Runup
 Flight School, Piston 99.17 78.77 47.75 12.08 51.57
 Other Airport-Based FW, Piston 142.35 114.69 63.40 21.35 66.88
 Rotorcraft, Piston n/a 99.38 53.21 14.39 60.42
 Charter / Air Taxi, Piston 142.35 114.69 63.40 21.35 66.88
 Other Non-Based FW, Piston 142.35 114.69 63.40 21.35 66.88

 2.4 Airport Inventory Results
Lead (Pb) emissions were estimated for each fleet, flight type (e.g., local and itinerant) and operation mode
combination. The emission inventory (in the units of grams) was calculated in accordance with the standard
approach common to both EPA and ACRP methods.

 Pb Content
 Emissions = Operations × Time-in-Mode × Fuel Rate × × (1 − Pb Retention Rate)
 Density

Within this equation, the daily C29 inventory was calculated using the following data:
 • Operations counts of Table 2-1 along with temporal allocation of Tables 2-2 and 2-3;
 • Time-in-mode estimates of Table 2-5;
 • Fuel flow rates of Table 2-6;
 • Lead (Pb) content of aviation gasoline (100LL) of 2.12 grams per gallon;8
 • Aviation gasoline density of 6 lb./gal.; and
 • Lead (Pb) retention rate with the aircraft fuel/engine system of 5 percent.9

The estimated lead inventory aggregated by month is reported in Table 2-7 and Figure 2-1 along with the
monthly total operations. The 2021 total airport lead emissions are estimated to equal 77,055 grams (170
lbs.) based on 40,253 piston operations.

82.12 g/gal represents the maximum lead allowable in 100LL aviation gasoline. This is the value commonly employed in
emission inventory development including EPA estimates. While not commonly completed, a refinement of this approach
would be to collect and analyze gasoline samples at C29 to assess the lead content of gasoline sold.
9EPA defined assumption (see Footnote 1).
Town of Middleton/City of Middleton Municipal Airport – Morey Field C29 Lead Modeling Report
Trinity Consultants 2-5
Table 2-7. Estimated 2021 Lead Inventory and Piston Operations for C29
 Month Piston Operations Pb Emissions (Grams)
 January 2,429 4,649
 February 2,591 4,960
 March 3,340 6,393
 April 3,226 6,176
 May 3,572 6,838
 June 3,781 7,237
 July 4,154 7,953
 August 3,815 7,303
 September 3,591 6,874
 October 3,508 6,716
 November 3,525 6,747
 December 2,721 5,208
 Total 40,253 77,055

 Figure 2-1. 2021 Monthly Lead (Pb) Emissions and Piston Operations

Town of Middleton/City of Middleton Municipal Airport – Morey Field C29 Lead Modeling Report
Trinity Consultants 2-6
2.5 Inventory Comparison and Other Sources of Lead Emissions
EPA inventory data were compared against this project’s estimates for C29 and to identify any other local
sources of lead (Pb) emissions. EPA prepares national emission inventories, incorporating local and state
input, of air emissions of key criteria and toxic pollutants – including lead (Pb). These triennially reported
inventory efforts are the EPA’s National Emission Inventory (NEI). The current version of the NEI
represents calendar year 2017.10

In the 2017 NEI for Dane County, the county-wide Pb emissions were estimated to equal 671 lbs. Of that
total, 96 percent of the county’s Pb emissions are estimated to originate from aviation sources. Notably, 32
percent of the county’s Pb emissions were estimated to originate from C29 operation (217 lbs.) –
representing the second-highest Pb source in the county. Dane County Regional Airport (MSN) was the top
Pb source in the county in 2017, estimated at 260 lbs. The third highest is Pb source is estimated to be
Waunakee Airport (95 lbs.). Nationally, the 2017 NEI estimated 450 tons of lead emissions in the United
States in 2017 of which 63 percent came from general aviation operations. The NEI methods for estimating
lead from aircraft are those of Footnote 1.

Table 2-8 compares this project’s 2021 lead inventory and operations statistics with those of the 2017 NEI.
The 2021 inventory of 170 lbs. (77,055 grams) is below that of the EPA. Both the on-the-ground and aloft
emissions of 98 and 72 lbs. are below the EPA estimates of 130 and 88 lbs., respectively. While the total
airport operations are close in magnitude, the EPA’s estimate of the piston-engine share of those operations,
based on national average statistics, does not match the C29 aircraft operations as documented in the
Master Plan. Other key differences between the two inventory estimates are as follows.

 • As described in Section 2.2, the maximum altitude of the climb out and approach operation modes
 equals the 1,000 ft. AGL traffic pattern altitude for the 2021 inventory; the EPA inventory assumes
 3,000 ft. AGL.

 • The 2021 inventory includes the runup mode (i.e., magneto test); EPA omits this operation.

 • As described in Section 2.3, the 2021 inventory relies on an operations-weighted fuel flow rate
 analysis (based on 100 resident aircraft) and mapping of aircraft engines to 27 unique engines with
 fuel rates measurements compiled by ACRP (see Footnote 2). The EPA fuel flow rates are the
 simple average over 6 unique engines; EPA fuel flow rates are biased high.

 Table 2-8. 2021 Lead Inventory Comparison to EPA’s 2017 NEI
 Parameter 2021 Inventory, C29 EPA 2017 NEI, C29
 Total Inventory (lbs.) 170 217
 On-the-Ground Inventory (lbs.) 98 130
 Aloft Inventory (lbs.) 72 88
 Total Airport Operations 41,761 40,510
 Piston-Engine Operations 40,253 29,187

For purposes of comparison, Table 2-9 summarizes all the sources of lead emissions within a 10-mile radius
of C29, as reported in the 2017 NEI. Eleven sources of lead emissions were identified in this radius – six of
which are airports. The 2017 NEI reports 44 sources of lead emissions in Dane County, WI.

10 https://www.epa.gov/air-emissions-inventories/2017-national-emissions-inventory-nei-data.

Town of Middleton/City of Middleton Municipal Airport – Morey Field C29 Lead Modeling Report
Trinity Consultants 2-7
Table 2-9. Other Lead Sources within 10 miles of C29, EPA’s 2017 NEI
 Distance Lead
 from C29 Emissions
 (Miles) Site Name Sector City/Town (Lbs.)
 1.1 Springs Window Fashions Manufacturing Middleton 0.9
 5.6 UW Hospital Medical Madison 0.3
 6.0 Waunakee Airport Waunakee 94.5
 7.0 UW Madison Heating Plant Madison 2.1
 7.3 Meriter/Park Airport Madison 0.3
 7.5 St. Mary's Hospital Medical Madison 0.3
 8.1 Dane Airport Dane 1.6
 9.1 Verona Airport Verona 5.5
 9.6 Dane County Regional Airport Madison 259.5
 9.6 Madison-Kipp Corp Manufacturing Madison 1.9
 9.6 Army Guard Airport Madison 0.3

 2.6 Spatial Allocation
The spatial allocation assigns the C29 emissions by operation mode within the air quality modeling domain
for the purposes of pollutant concentration modeling. The spatial allocation of the on-the-ground emissions
and emissions aloft applied different assumptions.

For the on-the-ground operation modes of taxi/idle, runup and takeoff, the emissions were spatially
allocated under the simplifying assumption of 100 percent of operations occurring on Runway
10(east)/28(west) with takeoffs to the west. This is the predominate runway usage; the Master Plan
assigns about 70 percent of operations to this runway. Moreover, a separate spatial allocation of
rotorcraft operations was not completed as these operations were estimated to represent less than 1
percent of the airport emissions.11 The spatial resolution of on-the-ground emissions is presented in
Figure 2.2.

11A refinement to this approach would be to assign fixed-wing operations to a frequency distribution between the runways
and develop separate spatial allocation rotorcraft operations.
Town of Middleton/City of Middleton Municipal Airport – Morey Field C29 Lead Modeling Report
Trinity Consultants 2-8
Figure 2-2. Spatial Allocation of On-the-Ground Emissions

For the two aloft operation modes of climb out and approach, we reviewed available flight track data and
other resources. We were provided with a data capture of representative aircraft tracking data (i.e.,
latitude, longitude, and altitude) on a 4 or 5-second frequency with separate databases by aircraft operating
under visual flight rules (VFR) and instrumented flight rules (IFR). We were provided with five years’ IFR
data and 17 months’ VFR data. The data were not specific to C29. The use of IFR for operations at C29 is
sporadic and infrequent, which was expected. Therefore, the VFR data are preferable for identifying flight
patterns aloft at C29. The climb out and approach for July 30, 2017, was selected as the representative
date for modeling the spatial allocation of aloft modes at C29. This date included 83 operations identified
and nearly 100 percent use of Runway 10(east)/28(west). These data are presented in Section 3.7 of this
report.12

12There were no automated procedures identified for isolating individual C29 operations within the larger VFR data files,
which were organized by date. A handful of dates were examined. Criteria were applied to isolate the operation in the airport
environs, eliminating flyovers, and to approximate when a landing or takeoff had occurred at C29 (as the tracking did not
include on-the-ground movements). Within the original VFR data capture supplied for July 30, 2017, only 0.4% of the flight
track records were specific to climb out and approach operations occurring at C29.
Town of Middleton/City of Middleton Municipal Airport – Morey Field C29 Lead Modeling Report
Trinity Consultants 2-9
3. AIR DISPERSION MODELING INPUTS

The following sections describe the procedures and methods for conducting the air quality modeling
analysis. Dispersion modeling techniques applied in this analysis are in accordance with 40 CFR Part 51
Appendix W, also known as the Environmental Protection Agency’s (EPA’s) Guideline on Air Quality Models.

 3.1 Model Selection
Air dispersion modeling was performed using version 21112 of the AERMOD modeling system which is the
latest version of AERMOD.

AERMOD is composed of three modular components: AERMAP, the terrain preprocessor that characterizes
the terrain and generates source and receptor elevations; AERMET, the meteorological preprocessor that
processes raw surface and upper air meteorological observations for use by AERMOD; and AERMOD, the
control module and modeling processor.

 3.2 Meteorological Data
Meteorological data used in the dispersion modeling analysis was obtained from the Wisconsin Department
of Natural Resources (WDNR) Site-Specific Meteorological Data table13. Data were processed by WDNR
usingthe meteorological preprocessors AERMET (21112) and AERMINUTE (15272). Data consists of five
years (2016 through 2020) of National Weather Service (NWS) surface data collected at the Madison, WI
airport. Concurrent upper-air observations used in AERMET were obtained from the Green Bay, WI airport.
The data underwent quality assurance and was selected as the most representative data due to its
proximityto the site and consistent terrain characteristics with the site location. Additionally, while the
Airport does have a meteorological station onsite, it does not meet EPA quality assurance requirements and
would not represent high-quality meteorological data for an air dispersion modeling analysis.

 3.3 Urban versus Rural Determination
40 CFR Part 51 Appendix W Section 7.2.1.1 provides guidelines on selecting rural or urban dispersion
coefficients. This is used in determining the planetary boundary layer characteristics that affect the model’s
prediction of downwind concentrations.

Table X below shows the percentage of land that can be categorized as urban vs non-urban, indicating that
Value Description Count Urban? %
 31 Barren Land 338 N 0.95%
 41 Deciduous Forest 1321 N 3.71%
 42 Evergreen Forest 28 N 0.08%
 43 Mixed Forest 1013 N 2.84%
 52 Shrub/Scrub 66 N 0.19%
 71 Herbaceuous 34 N 0.10%
 81 Hay/Pasture 3646 N 10.23%
 82 Cultivated Crops 13179 N 36.99%
 90 Woody Wetlands 85 N 0.24%
 95 Emergent Herbaceuous Wetlands 242 N 0.68%

Figure 3-1 depicts the land-use types surrounding the Airport. Only the areas shaded deep-red can be
considered urban areas for the purposes of determining whether the use of urban dispersion coefficients is
appropriate.

Given that less than 50% of the surrounding land-use type in a three-kilometer radius can be described as
urban, urban dispersion coefficients were not utilized in this modeling analysis.

Town of Middleton/City of Middleton Municipal Airport – Morey Field C29 Lead Modeling Report
Trinity Consultants 3-2
Figure 3-1. Airport Land-Use Imagery

Town of Middleton/City of Middleton Municipal Airport – Morey Field C29 Lead Modeling Report
Trinity Consultants 3-3
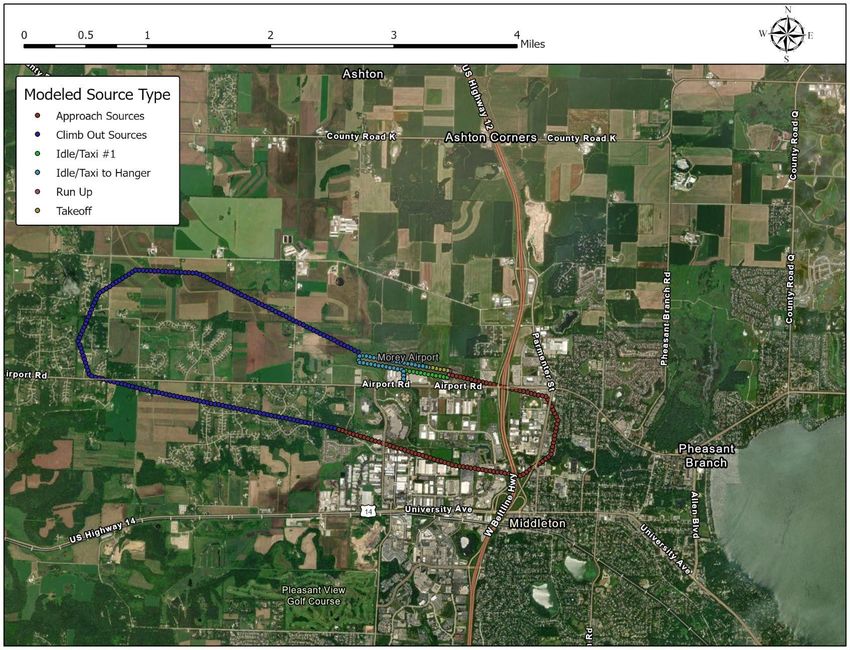
3.4 Receptor Grid
A modeling domain was developed for the air dispersion analyses to encompass the location of nearby areas
with points of interest. Discrete receptor locations in AERMOD were based on UTM coordinates in the
WGS84 datum.

The receptor grid was developed to ensure that the maximum pollutant concentrations and points of
interest were captured by the model. The grid consisted of 1,343 receptors with the following spacing:

 ► 100-meter spacing for receptors extending from the center of the Airport to 2,000 meters;
 ► 250-meter spacing for receptors extending from the course receptor grid to 8,000 meters.

 3.5 Terrain Data
Receptor terrain and source elevations were derived from 1/3 arc-second National Elevation Dataset (NED)
data obtained from the U.S. Geological Survey. AERMAP version 18081 was used to determine elevations for
all receptors and emission sources, with the exception of elevated sources which are discussed in Section
3.7.

 3.6 Modeling Parameters
All sources modeled were represented as volume sources which are unaffected by building downwash (wake
effects from buildings) in the AERMOD model, therefore buildings were not included in the modeling
analysis.

 3.7 Emission Source Parameters
The modeling analysis included six types of airport operations, which can be described as follows:

 • Idle/Taxi #1 (Idle/Taxi to Run-Up)
 • Run-Up prior to takeoff and Idle/Taxi #2
 • Takeoff
 • Climb-Out
 • Approach
 • Idle/Taxi to Hangar

The location of these sources is based on information obtained from the Airport Master Plan, for movement
within the airport, as well as a single day of VFR Flight Tracks data from July 30, 2017, for movement of
aircraft once they are airborne.

Figure 3-2 below shows a geospatial representation of the flight tracks for July 30, 2017, along with the
purpose of each operation.

Town of Middleton/City of Middleton Municipal Airport – Morey Field C29 Lead Modeling Report Trinity
Consultants 3-4
Figure 3-2. July 30, 2017, Flight Track Data

Town of Middleton/City of Middleton Municipal Airport – Morey Field C29 Lead Modeling Report
Trinity Consultants 3-5
In an effort to reduce model processing time and represent a “worst-case” scenario, climb-out and approach
sources were represented as the average location of Landing and Take-off (LTO) operations, therefore
combining all itinerant flight emissions with LTO emissions.

Figure 3-3 shows the locations of modeled sources with respect to the July 30, 2017, flight track
information. Figure 3-4 shows the locations of modeled sources along with the type of operation for each
source.

Town of Middleton / Middleton Airport Lead Modeling Report
Trinity Consultants 3-6
Figure 3-3. Modeled Source Locations Reference

Town of Middleton/City of Middleton Municipal Airport – Morey Field C29 Lead Modeling Report
Trinity Consultants 3-7
Figure 3-4. Modeled Source by Operations Type

Town of Middleton/City of Middleton Municipal Airport – Morey Field C29 Lead Modeling Report
Trinity Consultants 3-8
Operations of each source type were then broken down further by Season and Hour-of-Day by utilizing the
AERMOD “SEASHR” keyword, which allowed AERMOD to apply variable emission rates to each source. This
was applied to account for operations only occurring between 8 AM and 8 PM and the seasonality of
emissions. Figure 2- shows how lead emissions vary by month.

The seasons were defined as follows:

 • Winter – December, January, and February
 • Spring – March, April, and May
 • Summer – June, July, and August
 • Autumn – September, October, and November

These seasons align closely to the magnitude of monthly lead emissions profiles shown in Figure 3-5.

The modeling analysis was conducted assuming all emissions were from fixed-wing aircraft. Initial horizontal
dispersion () was calculated as suggested in AERMOD documentation (U.S. EPA 2004, Table 3-1) as the
source separation distance divided by 2.15. Initial vertical dispersion () was calculated using the mixing zone
residence time as defined in the CALINE3 model:

 Equation 3-1. Initial Vertical Dispersion Calculation
 2 60 0.2
 = �(1.8 + 0.11) ∗ � �� ∗ �
 30
 �
where
 SZI = initial vertical dispersion (m);

 W2 = half-width of the runway or taxiway (m); and
 U = average wind speed over the modeling period (m/s).

The values for the initial vertical dimension parameters are as follows:

 W2 = 16 meters
 U = 4.044 m/s average between 8 AM and 8 PM
 SZI = 8.68 meters

Additionally, the source separation distance (the center-to-center distance of adjacent volume sources) was
taken as 50 meters, following the ICF report (ICF International and T&B Systems 2010). This means the
initial later dimension utilized was 23.3 m (50/2.15).

The initial release point for all sources is calculated as the center-line of the initial vertical dispersion
coefficient, i.e. the height of the plume divided by two (8.68*2.15/2 = 9.33 meters).

These source characterizations were utilized for all sources and did not account for wake turbulence effects
from climb-out and approach sources, which would require additional surveying to determine the takeoff
and landing angles. Additionally, wingspan wake, horizontal momentum, and propeller turbulence wake
were not utilized in the preparation of run-up source characterization.

Town of Middleton/City of Middleton Municipal Airport – Morey Field C29 Lead Modeling Report
Trinity Consultants 3-9
Lastly, the elevations for climb-out and approach sources were assumed to be 500 feet (152.4 meters)
above ground level elevations (GLE). In order to determine these values, AERMAP was utilized to calculate
the GLE for each climb-out and approach source, and 152.4 meters were added to the calculated value.

Town of Middleton/City of Middleton Municipal Airport – Morey Field C29 Lead Modeling Report
Trinity Consultants 3-10
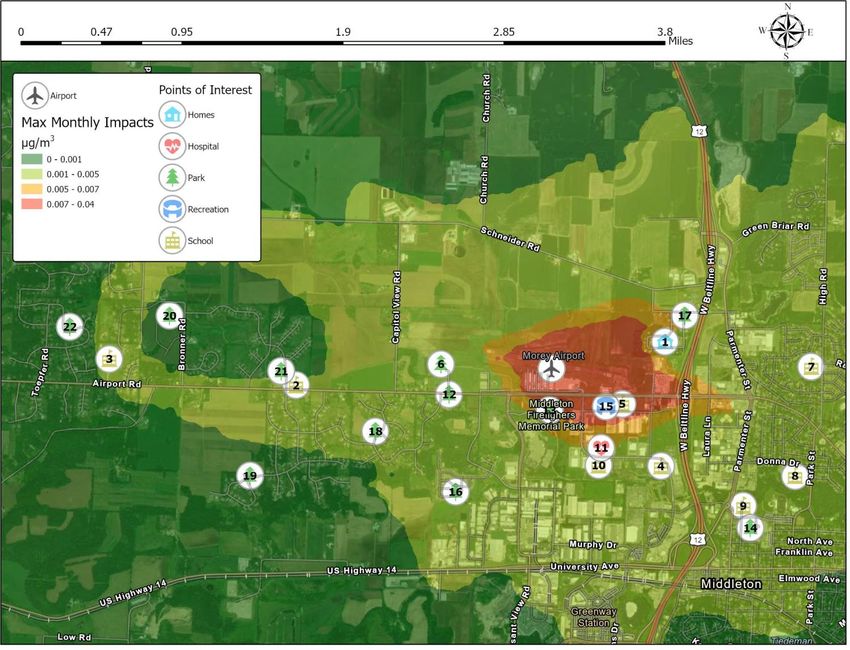
4. AIR DISPERSION MODELING RESULTS

Modeling results are included in this section in Figure 3-1 and Figure 3-2. Figure 3-3 indicates during which
season maximum monthly impacts occur. Points of interest are included in each figure and labeled with
unique IDs. Table 3-1 includes a description for each point of interest along with maximum monthly and
annual impacts as estimated by the AERMOD model for the receptor closest to each location. Even though
the spring and summer months have higher emission rates, most receptors have highest impacts in the
autumn and winter months due to calmer winds and weaker convective forces during those months.

 Table 4-1. Points of Interest and Impacts from Nearest Receptors

 Max µg/m3
 ID Description Type Season Monthly Annual
 1 Highwood Circle Estates Homes Autumn 0.0047 0.0017
 2 Madison Montessori School Autumn 0.0011 0.0006
 3 Sunset Ridge Elementary School Autumn 0.0014 0.0009
 4 Primrose School of Middleton School Winter 0.0035 0.0015
 5 Middleton Gymnastics Academy Recreation Winter 0.0121 0.0067
 6 Ed Tallard Park Park Autumn 0.0019 0.0012
 7 Northside Elementary School School Winter 0.0016 0.0006
 8 Kromrey Middle School School Winter 0.0021 0.0010
 9 Clark Street Community School School Winter 0.0028 0.0016
 10 Clubhouse For Kids II School Autumn 0.0044 0.0018
 11 Miramont Behavioral Health Hospital Autumn 0.0054 0.0024
 12 Penni Klein Park Park Autumn 0.0024 0.0012
 Middleton Firefighters Memorial
 13 Park Park Autumn 0.0077 0.0040
 14 Firemen's Park Park Winter 0.0019 0.0009
 15 Keva Sports Center Recreation Autumn 0.0144 0.0082
 16 Hinrichs Family Farm Park Park Winter 0.0017 0.0008
 17 Murphy Park Park Autumn 0.0047 0.0013
 18 Hickory Woods Park Park Autumn 0.0021 0.0012
 19 Summit Ridge Park Park Winter 0.0006 0.0003
 20 Vosen Memorial Park Park Autumn 0.0009 0.0005
 21 Settler's Prairie Park Park Autumn 0.0009 0.0005
 22 Enchanted Valley Park Park Autumn 0.0004 0.0003

Town of Middleton/City of Middleton Municipal Airport – Morey Field C29 Lead Modeling Report
Trinity Consultants 4-1
Figure 4-1. Max Monthly Impacts

Town of Middleton/City of Middleton Municipal Airport – Morey Field C29 Lead Modeling Report
Trinity Consultants 4-2
Figure 4-2. Annual Impacts

Town of Middleton/City of Middleton Municipal Airport – Morey Field C29 Lead Modeling Report
Trinity Consultants 4-3
Figure 4-3. Maximum Monthly Impact Season
You can also read