SDG6+5 Review of Routine Monitoring for WASH- A Case Study from South Africa - UNICEF
←
→
Page content transcription
If your browser does not render page correctly, please read the page content below
SDG6+5 Review of Routine Monitoring
for WASH– A Case Study from South
Africa
 SUMMARY
 Five years after the introduction of the Sustainable Development Goals (SDGs), and with the SDG
 midterm review approaching in 2022/23 marks a critical point for the WASH sector in Eastern and
 Southern Africa, with many countries not on-track to achieve the SDG6 targets. UNICEF, as the lead
 agency of a multi-partner approach across 21 member states in Eastern and Southern Africa identified
 that this point represents a moment for the WASH sector to take stock of progress towards SDG6,
 understand the gaps in our current knowledge on levels of access, and take corrective actions to ensure
 that SDG6 is met in the remaining 10 years to 2030 vision.
 As part of this broader SDG6+5 review, UNICEF commissioned ITAD to explore and document the
 current state of SDG6 monitoring across all countries in Eastern and Southern Africa Region. The
 methodology included: A rapid assessment summarising the status of WASH monitoring systems in all
 countries; document five case studies (of which this is a part) to provide a deeper analysis of the
 monitoring frameworks and systems, identify the enablers and barriers to strong monitoring systems, and
 to capture key learnings for the sector and region.

 South Africa was selected because it is unique in the region having a routine monitoring system that is
 primarily based on annual national household surveys and complemented by utility reporting; as
 compared to most countries which are pursuing water and sanitation national Information Management
 System (IMS) databases. This approach raises several interesting areas of inquiry for further actions.

1 Background and                                          department of water and sanitation; as compared
                                                          to most countries which are pursuing water and
Country Selection                                         sanitation national information management
South Africa was selected as one of the countries         system (IMS) databases.
for documenting the SDG6 monitoring practices
                                                          Following the rapid assessment of routine WASH
because it is unique in the region for having a
                                                          monitoring systems in 2020, the following areas
routine monitoring system that is primarily based
                                                          were identified for further investigation through
on annual national household surveys and
                                                          this case study.
complemented by utility reporting to the

                            WASH FACT SHEET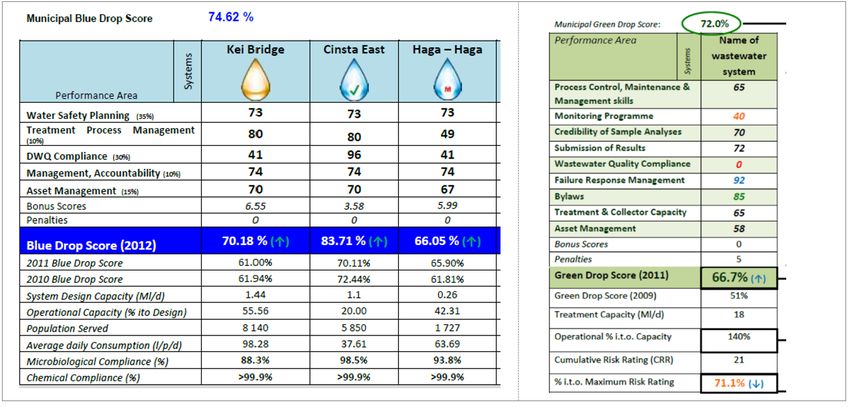
1. Quick Wins for Joint Monitoring Programme
(JMP) Alignment: What would it take for the          countries in the region, there is not a central
                                                     WASH infrastructure information
General Household Survey (GHS) and BlueDrop          management system (IMS). Water service
systems to align with JMP definitions and how        providers (WSP), which are responsible for all
could this change happen?                            geographic areas, have varying forms of
                                                     localised and non-standard infrastructure
2. Data Gaps; Urban WASH, WASH in schools,           databases. Previously, WSPs were
                                                     independently inspected annually against a
WASH in health care facilities and water quality:    range of service and quality criteria through
To what extent are the systems in place and          the highly regarded Blue and Green drop
functioning? How is the data brought together and    performance management systems. While
analysed to inform planning?                         both systems were stopped in 2015 (likely for
                                                     political reasons), the master plan commits to
                                                     recommence both systems in the coming
3. Institutional Arrangements: What systems
                                                     years. Water and wastewater quality has
are in place to bring together the various WASH      continued to be reported as a regulatory
departments and stakeholders to review SDG6          requirement through the IRIS system, but is
progress and plans? How is the routine               largely lacking for rural areas where there is
monitoring data from GHS, Integrated Regulatory      less funding and access to laboratories.
Information System (IRIS) and BlueDrop used to       While the routine monitoring data enables
inform planning?                                     DWS to see general trends and progress,
                                                     major planning exercises carried out centrally
                                                     have required more granular data. This has
4. Operation and Maintenance (O&M) systems:
                                                     been estimated by scaling up the 2011
How are functionality and O&M managed and            census using a population growth model.
responded to given that the surveys only provide
                                                     As WSPs are responsible for the operation
an annual snapshot and there is no national          and maintenance of systems in their
infrastructure inventory.                            geographic areas, decentralised infrastructure
                                                     databases has worked as they are
                                                     responsible for both the data and the
  KEY FINDINGS                                       response to that data. A central infrastructure
                                                     WASH IMS, with routine data on service
  South Africa, through the initiative of the        coverage and levels, would therefore mainly
  Department of Water and Sanitation (DWS),          benefit centralised granular planning
  has established strong institutional               exercises. The DWS has long-term ambitions
  arrangements and systems for working               to create a national infrastructure WASH IMS.
  towards achieving the full extent of SDG6.
                                                     The GHS enables reporting to the JMP up to
  Through a dedicated structure of SDG6 ‘task
                                                     a basic level of service, in some cases
  teams’, available routine monitoring data is
                                                     requiring proxies. There are several ‘quick-
  reviewed annually with identified gaps
                                                     wins’ where current GHS questions could be
  targeted for action through the annual revision
                                                     tweaked to directly align and to add the
  of the water and sanitation master plan. The
                                                     additional questions needed for the
  DWS have taken strong ownership of their
                                                     household component of reporting against
  responsibility to lead on monitoring SDG6,
                                                     ‘safely managed’ services. There is
  including the current process of establishing
                                                     widespread willingness within both the DWS
  linkages with Education and Health to begin
                                                     and Stats SA to adapt current tools to align
  routine gathering of data on WASH in
                                                     with international SDG/JMP reporting, and an
  institutions.
                                                     annual process for review.
  South Africa’s routine WASH data comes
                                                     Currently the water and wastewater quality
  primarily from the annual general household
                                                     data is not joined-up with the GHS data, but
  survey, managed by Statistics South Africa
                                                     could be; although rural water quality would
  (Stats SA), which is statistically relevant down
                                                     remain a gap. The reintroduction of the Blue
  to the provincial level. Unlike most other
                                                     and Green drop systems provides an

WASH FACT SHEET FS/11/2021                                                                Page 2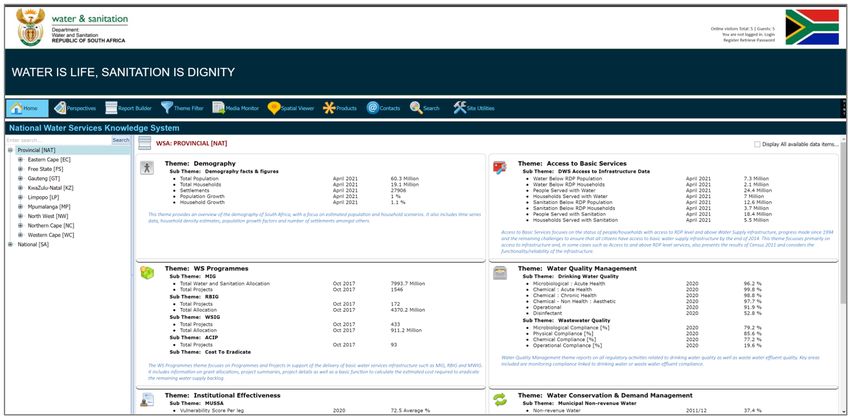
opportunity to gather the service provider data   considered during the June to September
 needed for safely managed service reporting       review period for inclusion in the 2022 GHS.
 (continuity of water services and level of
                                                   Connecting service provider data to report
 wastewater treatment) and to match this up
                                                   on safely managed sanitation: The
 with the GHS and water quality data for
                                                   reintroduction of the Blue and Green drop
 reporting against the safely managed criteria.
                                                   systems will provide an opportunity to fully
 The DWS have recently established an ‘inter-      report on safely managed water and
 linkage task team’ to reach out to other          sanitation, if data on quality and treatment
 department to compile data on WASH in             can be connected with data from the GHS,
 institutions. There is currently no system for    census or community survey.
 collecting reliable data on WASH in Schools.
                                                   Exploring an infrastructure IMS: The
 The Department of Basic education (DBE)
                                                   reintroduction of the Blue and Green drop
 NEIMS database is only updated after
                                                   systems also provides an opportunity to
 improvement works are carried out rather
                                                   explore creating a standardised infrastructure
 than routinely and indicators only align for
                                                   database that can be utilised by water service
 JMP basic water.
                                                   providers and enable a central database of
 It may take several years for WASH indicators     coverage and service levels.
 to be included into the national DHIS2 based
                                                   Making the most of existing water quality
 HMIS. The current Ideal Clinic and Ideal
                                                   data: Breaking down existing water quality
 Hospital initiatives collect sufficient WASH
                                                   data between urban and rural could enable
 data to enable some level of analysis of JMP
                                                   the data to be used for reporting to the safely
 progress and could enable the first data
                                                   managed level in urban area.
 report to the JMP. The WASH FIT tool is
 planned as an interim tool to collect WASH in     Rural Water Quality data gap: The lack of
 health care facility data. Indicator alignment    rural water quality testing leaves a gap in both
 will be an area for the inter-linkage task team   routine monitoring and reporting to the JMP
 to explore further with both the DoH and DBE.     and means that the extent of safely managed
                                                   water services in rural areas is unknown. The
                                                   DWS could consider running a one-off rural
                                                   rapid assessment of drinking water quality
                                                   (RADWQ) to act as a baseline.
                                                   Explore options for schools: How can
                                                   schools self-report their WASH status at least
 KEY OPPORTUNITIES                                 annually? To date, South Africa has not been
                                                   able to report to the JMP on the status of
 FOR IMPROVED DATA                                 WASH in schools. Can the NEIMS database
 Annual ‘Gap Reports’: To bring more               form the foundation for a routine monitoring
 attention to data gaps and alignment, task        system or will routine monitoring of WASH in
 teams could be mandated to ensure that both       schools need to be built into a different or new
 are also considered within the annual             system? This is a question for the inter-
 coverage gap reports developed by the SDG6        linkage task team to explore with the DBE
 task teams. Alternatively, this role could be     IMS team.
 delegated to a cross-cutting task team.           Utilise existing WASH in Health Care
 Creating GHS Indicator Alignment: Annex           Facility data: While not complete, the ideal
 6 shows the specific changes that would be        clinic and hospital programs contain WASH
 needed to each question in the GHS in order       data that could be aligned to JMP indicators
 to align responses with JMP definitions. In       to enable South Africa to partially report for
 most cases only small changes to question         the first time to the JMP. The inter-linkage
 wording or response options would be              task team could lead on gathering and
 needed, as well as two new questions to           aligning the data.
 cover household safely managed sanitation         Further alignment from the Ideal Clinic
 practises. These changes could be                 system: While waiting for the HMIS to

WASH FACT SHEET FS/11/2021                                                               Page 3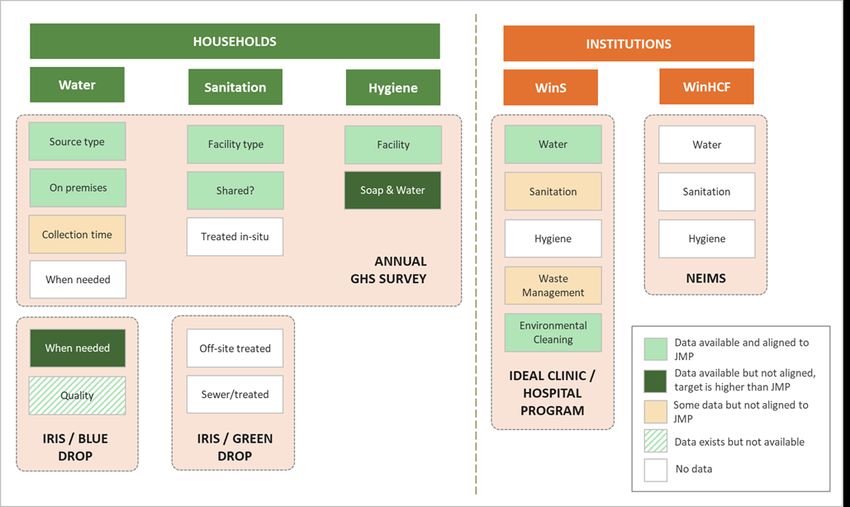
2.3     Limitations
    incorporate WASH indicators, and regardless
    of whether an interim WASH FIT can go             Interviews with representatives from the
    ahead, the ideal clinic data framework could      Department of Health (DoH) or Department of
    be revised through mainly minor changes to        Basic Education (DBE) could not be conducted
    improve JMP data alignment. More broadly,         but were able to gather some information through
    the inter-linkage task team can push for all
                                                      messages and email exchange. It is possible that
    systems that are collecting data on WASH to
    be aligned with national and SDG/JMP              there are ongoing or planned initiatives from the
    indicators.                                       DBE that the study team and DWS may not be
                                                      aware of.

                                                      In terms of the landscape of WASH monitoring in
                                                      South Africa – all interviews were held at the
2        Methods and data                             national level. As such, there remains an
                                                      information gap around how individual water
2.1      Methods                                      service providers and authorities manage their
Five case studies build on a rapid assessment of      infrastructure including the extent of decentralised
monitoring systems for SDG6 undertaken in 21          and localised infrastructure or service databases.
countries across Eastern and Southern Africa in
late 2020. From these 21 countries, five case         2.4 Institutional Arrangements for
studies were selected based on the lessons they       WASH monitoring
provide on monitoring for The SDG6.                   The national statistics office, Statistics South
                                                      Africa, holds overall responsibility for collecting
Based on the findings of the rapid assessment,        data and reporting on the sustainable
priority topics for further enquiry were mapped out   development goals (SDGs). Responsibility for
against three broad areas of the monitoring           monitoring SDG 6 (SDG6) related to water and
system: i) the strength of the enabling               sanitation, is held by the department of Water and
environment for WASH monitoring; ii) the              Sanitation (DWS), who have established a
availability of data for monitoring WASH and the      structure of task teams to lead on each of the
alignment with SDG6 indicators; and iii) the          SDG6 sub-goals as shown in Figure 1. There is
details on how WASH monitoring systems are            currently no formal involvement of the Department
structured and managed at the country level.          of Health (DoH) or the Department of Basic
These areas of enquiry were validated with            Education (DBE) in the SDG6 structure and
WASH specialists in the UNICEF Country Office.        hence a lack of data for WASH in both institutions.

2.2      Data Used
An extensive desk review of publicly available
WASH data and information was conducted, most
systems investigated are available online to some
extent and in at least summary format. Six key
informant interviews were conducted with several
different teams within the Department for Water
and Sanitation (DWS) and Statistics South Africa.
Findings based on this data were validated in a
meeting with UNICEF and key stakeholders and
synthesised in this report.

WASH FACT SHEET FS/11/2021                                                                    Page 4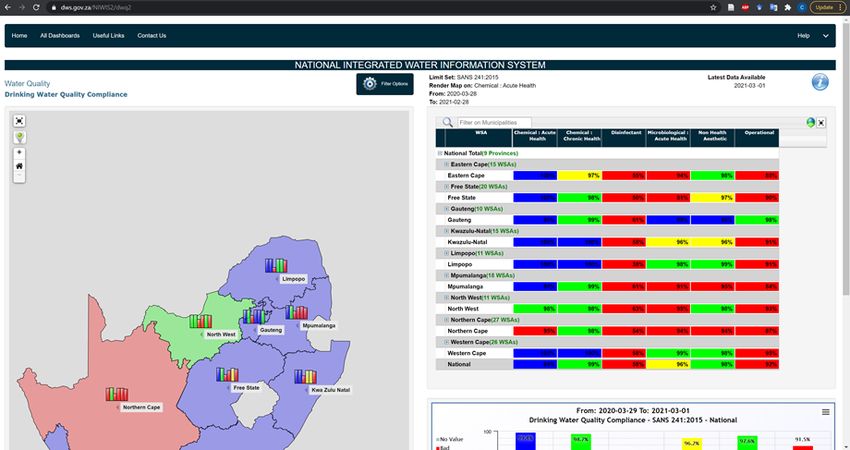
Statistics South Africa (Stats SA)                  databases as the basis for estimating baseline
                                                    service level and collecting data from different
Stats SA is the national statistics office, with    departments. However, for Covid-19 the DoH was
overall responsibility for reporting against SDG    appointed to establish and manage the overall
progress. SDG progress updates are intended to      response monitoring.
be produced and published every three years with
the last report published in 2019 and next due in   Department of Water and Sanitation (DWS)
2022. An online ‘SDG Goal Tracker’ portal is
available to present the data compiled by Stats     The DWS holds responsibility for monitoring and
SA.                                                 reporting to Stats SA on progress towards all
                                                    aspects of SDG6.
Related to WASH, the Stats SAis responsible for
coordinating, funding and implementing large        Municipalities are responsible for monitoring the
scale surveys including the census, community       provision of water and sanitation services within
survey and annual GHS; with the supplementary       their service areas and have an obligation to
data required for SDG6 that cannot be measured      report into DWS managed national monitoring
through household surveys coming from the           systems. South Africa is split into municipalities
DWS.                                                (Figure 3) which cover both urban and rural areas,
                                                    although often through different water service
Normally, Stats SA would be responsible for         providers and systems.
coordinating the monitoring and reporting of
humanitarian emergencies, using existing survey

Figure 1: DWS led SDG6 coordination and reporting structure

Source: DWS

WASH FACT SHEET FS/11/2021                                                                Page 5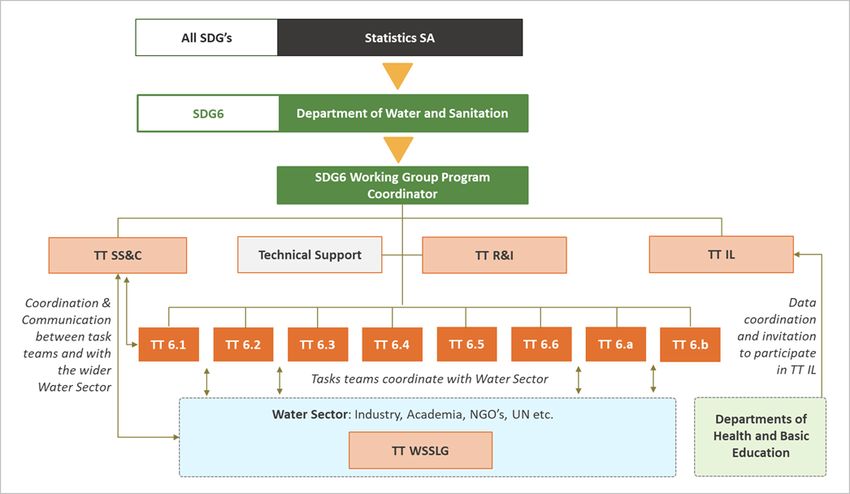
The DWS also acts as a non-independent                   Sector Support and Coordination (TT SS&C):
regulator for the water and sanitation sector,           Aims to communicate progress and information
regulating the public water service authorities          between task teams and coordinate general
(WSA), which oversee the Water service                   guidance and capacity building initiatives.
providers (WSPs), which can be public or private.
Water boards, a separate group of legal entities,        Research and Innovation (TT R&I): Led by the
provide bulk water to WSAs.                              Water Research Council (WRC) to support other
                                                         task-teams in identifying innovative solutions to
WASH in Institutions                                     help reach targets.

Responsibility for monitoring WASH in schools            Water and Sanitation Sector Leadership Group
falls within the remit of the Department of Basic        (TT WSSLG): is the highest non-statutory
Education and Higher Education (DBE), and for            strategic sector partnership forum for the national
health care facilities within the remit of the DoH.      water sector. It is the overall sector leadership
There is currently no mechanism or system for            group that brings together stakeholders across
bringing any such WASH data into either the              the sector, including NGOs, civil society, private
DWS or Stats SA SDG6 reporting systems.                  sector, academia, donors, bank, the UN and other
                                                         relevant departments of government. While
Structure for monitoring SDG6                            providing sector oversight, the group is also
                                                         expected to compile overall sector progress and
The DWS established an SDG working group                 provide the linkage between the DWS led
(SDGWG), with an overall SDG6 coordinator,               programmes and processes and the wider WASH
within the branch of planning and information to         sector.
coordinate the implementation and monitoring of
SDG6.                                                    Inter-Linkage (TT IL): Is currently being
                                                         established and expected to be operational by the
The SDGWG established 12 task teams (TTs),               end of 2021. It will have the responsibility to reach
eight related to the specific SDG6 sub-goals (6.1,       out to other government departments to
6.2, etc.) with the other four acting in cross-cutting   coordinate monitoring systems and data related to
areas (Figure 1). Each task team has specific            SDG6. Currently there is no formal system for
terms of reference, an overall leader and around         DWS to provide input into Health and School
10 to 20 sector experts from within and outside of       monitoring systems and data is usually shared
the DWS. Overall, there are more than 100                with DWS in PowerPoint formats on an ad-hoc
people involved in this SDG6 structure. The              basis upon request. As such the DWS does not
overall strategic direction and coordination is          currently have a clear picture of how WASH is
provided by the SDGWG.                                   monitored in schools and health facilities, or the
                                                         level of service currently being provided. While
Each sub-goal task team is required to monitor
                                                         DWS considers that this role should be carried out
the progress towards the SDG target and lead on
                                                         by Stats SA, this task team has been established
completing indicator reports for national and
                                                         to overcome this gap. The funding for this
international reporting, including to the JMP for
                                                         additional task team, around US$1 million, has
SDG6.1 and SDG6.2. They are expected to meet
                                                         been provided by the Water Research Council
frequently.
                                                         (WRC).
The cross-cutting task teams, as shown in Figure
                                                         At the sub-national level through the nine DWS
1, are:
                                                         regional offices, the director of planning,
                                                         monitoring and evaluation is expected to be the

WASH FACT SHEET FS/11/2021                                                                        Page 6
SDG6 focal point which the working group and             Task teams are required to collect and report on
task teams can coordinate with and are expected          their SDG goals and indicators, following an
to seek input from. In addition, they meet with the      annual process established by the SDG working
SDG WG programme coordinator on a quarterly              group. Every three years this data will also be
basis.                                                   used for the SDG reporting cycle process led by
                                                         Stats SA. The process, which is described in
Funding: The above dedicated structure and               more detail in the table below, uses the
ways of working for SDG6 comes from the routine          monitoring data to inform suggested priority
budget of the DWS, rather than a separate                actions, which are then incorporated into the
specific project budget.                                 annual revision of the National Water and
                                                         Sanitation Master Plan (NW&SMP) to enable
Structure for SDG Monitoring, Reporting and              budget allocations and project planning. The
Use of Data                                              NW&SMP was launched in September 2019.

                                                         March annual revision is due in 2021.

Table 1: SDG Monitoring, Reporting and Data Use Process
 November                                             Task teams gather data relating to their goal and
                                                      indicators.
                                                      Data reports are submitted to Stats SA and used for
                                                      international reporting, including the JMP, when
                                                      needed.

 December                                             Task team leaders submit a ‘Target Gap Report’ to the
                                                      working group Program Coordinator that brings together the
                                                      available data to highlight progress and specifically the
                                                      remaining gaps to reach SDG goal targets.
                                                      Task teams start work on identifying priority actions to
                                                      address the gaps.

 January                                              Task team leaders submit a ‘Target Actions Report’ which
                                                      identifies the priority areas, strategies and actions proposed
                                                      to address the current gaps. Propose actions will align
                                                      under one of the headings of the NW&SMP volume 3
                                                      actions.

 February                                             The proposed targeted actions of the eight SDG sub-goal
                                                      task teams are consolidated by the Program Coordinator
                                                      and submitted to the Service Delivery Unit of the NW&SMP.

 March                                                The SDG6 Working Group and the NW&SMP teams come
                                                      together to discuss the priority interventions and confirm the
                                                      ‘Target Actions’ that will be included in the annual revision
                                                      on the NW&SMP.

 April to November                                    The NW&SMP team will monitor the progress of the specific
                                                      projects and actions within the master plan. There is not a
                                                      specific M&E plan.
                                                      The task team continue to meet and monitor overall sector
                                                      wide progress.

WASH FACT SHEET FS/11/2021                                                                            Page 7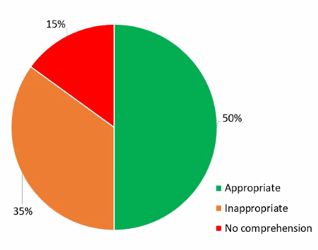
The inter-linkage task team will be exploring how   actions and targets with the NDP. Volume three of
the WASH needs of health care facilities and        the NW&SMP lays out the schedule of action, the
schools can also be incorporated into this          specific projects that are needed. Currently there
process, given that the NW&SMP does not have a      are around 2,800 projects in the master plan
remit for WASH in institutions; the annual target   which will be revised on an annual basis.
gap and actions reports could still be useful
processes and tools.                                The DWS has an obligation to report nationally
                                                    against the NW&SMP and MTSF, and
2.5  Policies, Strategies and Key                   internationally to the JMP, UN-WATER GLAAS
Documents                                           and the African Ministers' Council on Water
South Africa released the SDG Baseline report       (AMCOW) Ngor commitments.
in 2017 and a SDG Country Report in 2019. Both
documents were produced by Stats SA using data
                                                    2.6  Routine monitoring systems for
compiled from the various departments.
                                                    WASH
                                                    Figure 2 shows the WASH-related routine
The National Development Plan (NDP) 2030            monitoring systems that are currently in place in
lays out the key development targets, including     South Africa with an overview of their status.
safe and reliable water in the household and        Further information on each individual system
sanitation for all by 2030. The Medium-Term         follows.
Strategic Framework (MTSF) 2019-2024 sets
the high-level approaches and targets that are      The annual GHS forms the basis of routine
needed to reach the NDP.                            monitoring data for WASH. Unlike many other
                                                    countries in the region, there is no infrastructure
Specifically for water and sanitation, the main     database. Performance data from Water Service
strategy and planning document is the National      Authorities (WSAs), including water and
Water and Sanitation Master Plan (NW&SMP),          wastewater quality and treatment levels, is
launched in 2019. The master plan aims to           intended to be captured in the Blue and Green
identify the priority actions needed to reach the   Drop systems, which are not currently operational;
NDP and SDG6 targets by 2030 and aligns its         although obligatory water and wastewater quality

Figure 2: Key routine monitoring systems

WASH FACT SHEET FS/11/2021                                                                 Page 8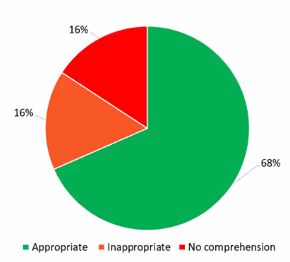
data continues to be provided through the IRIS.            key development areas, including water,
There is no national infrastructure database,              sanitation and hygiene. The household survey
although individual municipalities should have             includes a section on WASH which captures
some form of asset register.                               information on the state of the households’ water
                                                           supply, sanitation and hygiene arrangements.
The Health IMS system does not include any
WASH indicators, but some data is available                The GHS samples nearly 20,000 households over
through the routine monitoring of the ideal clinic         the full 12-month period (Figure 4), through a
and ideal hospital programmes. The DBE                     team of more than 300 people working through
operates a database (National Education                    various questions; currently there are a total of
Infrastructure Management System – NEIMS)                  193 questions.
which captures basic information on water and
sanitation but is not routinely updated.

Details of each Routine Monitoring Systems

The General Household Survey (GHS), led by
Stats SA, has been conducted annually since
2002 and is designed to track the progress of
national and sub-national development across all

Table 2: Annual General Household Survey (GHS)

  Summary:                                           Household survey collecting information on household
                                                     water, sanitation and hygiene, as part of a larger survey
                                                     to monitor basic needs of households in the country

  Frequency:                                         Annual

  Statistical Relevance:                             Representative to the provincial/municipal level

  Lead:                                              Department of Water and Sanitation

Figure 3: Administrative structure of South Africa

WASH FACT SHEET FS/11/2021                                                                              Page 9
Figure 4: 2021 GHS timeline
The data provides estimates that are statistically The Blue and Green drop certification
relevant at both the national and typically the programmes were created to drive improvement
provincial/metro level, as compared to the non- of water and sanitation service providers and
routine mid-census community survey which is reward strong performance. In operation from
representative down to the lower local 2009 to 2015, the system used dedicated
municipality level as shown in Figure 3. independent and DWS inspectors to score water
services authorities, and their individual water
While key indicators are included each year, service providers and individual water and
some are one-off or bi-annual in order to balance wastewater systems, against a standardised
the overall respondent time burden and scorecard and provide a risk rating and overall
competing requests from various development score. Data was collected on a wide range of
sectors. Therefore, as a general rule, new performance areas, including the presence of an
questions can only be added if others are asset register, water and wastewater quality
removed. results and the level of treatment provided;
metrics which are needed to be able to report to
Core WASH questions are included to align with the JMP level of safely managed for both
the census questions, although the wording and household water and sanitation. Provider’s ratings
format is slightly different. and reports were to be made public and WSAs
were recognised through annual awards
Figure 4 shows the annual timeline for the GHS,
ceremonies, creating competition and driving
with an annual modification period for the
continuous improvement.
following year between June and October. The
DWS coordinate with Stats SA when changes to Following the introduction of the Blue and Green
the WASH questions are needed. drop systems in 2009, there was a significant
increase in the amount of water and wastewater
Table 3: Blue Drop and Green Drop Certification Programmes
Summary: Water service provider independent performance
tracking system covering various aspect of utility
performance including water and wastewater quality
and the level of wastewater treatment
Frequency: Annual, inactive since 2015, plans to re-start
Coverage: Intended National, reported at a water and wastewater
system level
Lead: Department of Water and Sanitation
WASH FACT SHEET FS/11/2021 Page 10quality tests conducted and a significant increase The MuSSA is an annual self-assessment carried
in the overall performance of WSAs. The system out by each of the Water Service Authorities. It
was highly regarded within DWS and by the wider includes 18 pillars ranging from customer care to
WASH sector. However, bringing transparency to management skills and water service quality.
failings within municipal service provision can be Approximate data is reported on water quality and
politically unpopular and likely contributed to interruption of services, through it is not
initially reports no longer being made public and sufficiently quantitative to be used for technical
then subsequently stopped altogether. reporting that would align with the JMP.
The 2018 National Water and Sanitation Master Integrated Regulatory Information System
Plan and 2019-2024 MTSF show that there is (IRIS)
commitment to re-establish both the Blue and
Green drop performance management systems. Water Service Authorities have a regulatory
requirement to test and report on their water and
The Municipal Strategic Self-Assessment wastewater quality. Larger water boards and
(MuSSA) (below) fills some of the gaps left by the WSAs typically have their own laboratories and
suspension of the Blue and Green drop ability to test. Although rural areas still fall under
performance management systems but lacks the the responsibility of a WSA and WSPs, there is
same rigour, is self-assessed and does not have less ability to test, and significant data gaps exist.
the wider eco-system of competition and reward. Existing data in the system is primarily for urban
areas, although currently data is not analysed or
While the Blue and Green drop performance presented in a way that differentiates urban from
management systems are no longer active, water rural area results.
service providers and WSAs continue to be
obligated by legislation to report on both water Water and wastewater quality was and will also
and wastewater quality. This information is be captured through the Blue and Green drop
publicly available in the IRIS. systems as one of the indicators used for water
service providers. IRIS only captures the
Municipal Strategic Self-Assessment (MuSSA) minimum regulatory requirement for water and
Figure 5: Sample summary scorecards from the Blue and Green drop systems
WASH FACT SHEET FS/11/2021 Page 11Table 4: Integrated Regulatory Information System
Summary: Database for water and wastewater quality data
submitted by water service authorities as part of core
regulatory requirements
Frequency: Quarterly
Coverage: Nationwide, gaps in rural areas
Lead: Department of Water and Sanitation
Table 5: Ideal Clinic and Ideal Hospital programmes
Summary: Self-reported assessment of clinic and hospital service
and performance tracking, including metrics for water,
sanitation, hygiene, waste management and cleaning
Frequency: At least annually
Coverage: 55% of facilities reporting
Lead: Department of Health
wastewater quality reporting. The same water and
wastewater quality data can also be found in the
National Integrated Water Information System
(NIWIS) portal.
WASH FACT SHEET FS/11/2021 Page 12(both at health facilities and at the household
level). The process for reviewing and changing
the National Indicator Sets (NIDS) used in
DHIS2/HMIS system can take several years, with
the next bi-annual review scheduled for 2022. It is
expected that WASH in health care facility
indicators will be added during this review, with
Figure 6: NIWIS online platform, displaying data from IRIS
No Drop data starting to be collected in 2023 or 2024.
The no drop system was developed by the DWS The ideal clinic programme was started in 2013
to bring attention to and reduce the amount of and has been operating in all provinces since
non-revenue water (NRW). Full roll-out began in 2015. Current data is based on assessment
2014/15 to all municipalities, with reporting framework version 18, with version 19 being
continuing annually and data (up to 2017) is released in May 2021. All clinics are expected to
available online. report at least annually. In 2018/19, 55 per cent
(1,920 of 3,467) facilities submitted data. The
Department of Health (DoH) HMIS ideal hospital programme is a more recent
initiative and the extent of its current roll-out was
South Africa uses DHIS2 as the technology not able to be established. For WASH-related
platform for the National Health Management indicators the framework is similar but slightly
Information System (NHMIS). Currently there are different to the indicators used for clinics.
no indicators, and thus no data, within the system
for water, sanitation or hygiene infrastructure
WASH FACT SHEET FS/11/2021 Page 13According to regulations on the norms and investment but is not able to identify if existing
standards for health establishments, created in facilities become non-functional.
2018 under the National Health act of 2003, all
facilities must have water supply, sewerage All schools are recorded as having an improved
disposal, handwashing facilities in every service water supply, which is categorised by on-site
area, and appropriate waste management. (borehole, municipal tap, rainwater harvesting) or
off-site (mobile tanks and communal municipal
WASH FIT tap). A quarter of schools are recorded as having
an ‘unreliable’ water source, although it is now
As an interim measure to fill the WASH in health clear how this information was submitted.
care facility data gap, the DoH is currently
planning to roll-out the Water and Sanitation for Likewise, all schools are reported as having some
Health Facility Improvement Tool (WASH-FIT), form of improved sanitation facility. Data is not
which is a free tool that runs on the mWater recorded for single-sex facilities, although national
system. Designed by WHO and UNICEF, the tool standards do specify single-sex facilities and the
fully aligns with JMP reporting requirements. The minimum number of facilities based on the
assessment would be implemented by number of students. Around 9 per cent of sites are
Environmental Health Practitioners (EHP’s). recoded as having only a normal pit latrine, which
does not meet the South Africa minimum standard
National Education Infrastructure Management of a ‘Ventilated Improved Pit’ (VIP) latrine, but
System (NEIMS) which does meet the JMP criteria for an improved
sanitation facility.
The NEIMS is used by the DBE as the database
to capture the status of school infrastructure There are no specific national standards for
including electricity, water, and sanitation. Data on handwashing facilities in schools.
handwashing facilities is not collected. Schools do
not report into the system directly, instead the There is a willingness from the DBE IMS team to
system is updated after improvement works are engage with DWS to explore how to align WASH
made to the school by contractors or service data collection and indicators with SDG JMP
providers. The baseline set of data for all schools definitions and requirements.
was collected between 2009 and 2011. Provincial
offices should verify the information received Non-Routine Monitoring Systems
before sending on to the DBE. During the past 12-
months, the data was updated for 400 of the Decennial Census
23,276 sites in the system. The system can be
The national census is conducted every 10 years,
used to target schools without facilities for
with the most recent data being from 2011. A pilot
Table 6: National Education Infrastructure Management System (NEIMS)
Summary: Infrastructure database of schools including water and
sanitation, but not updated routinely
Frequency: Ad-hoc
Coverage: All schools in the database, < 2% updated last year
Lead: Department of Basic Education
WASH FACT SHEET FS/11/2021 Page 14of the 2021 questionnaire is currently ongoing the GHS or community surveys. Data compiled by
with the full 2021 census to follow later this year. the task-teams during annual planning is not
captured within the DWS data portals including
Inter-Census Community Survey the NWSKS.
Midway between each census a large-scale SDG6 Goal Tracker Portal
community survey is conducted, surveying around
1.3 million people. Statistically relevant data for The SDG Goal Tracker Portal uses GHS data
WASH is available down to the local municipality provided by Stats SA to provide data for SDG6.1
level. The most recent community survey was and SDG6.2 up to 2017. It is not clear how the
carried out in 2016 and led by Stats SA. system is able to report on safely managed water
services given that water quality testing is not a
Data Presentation and Navigation part of the GHS.
In addition to the above-mentioned data collection 2.7 Localisation and alignment of
systems, there are additional online portals where national WASH targets and data with
the above information is stored and presented. JMP indicators
Water Services Information Management System
(WSIMS) and National Integrated Water Targets
Information System (NIWIS)
South Africa has committed to reaching SDG6.1
There are plans within the master plan (NWSMP) and SDG6.2 targets of universal coverage by
to create a new central IMS system that can pull 2030. The National Development Plan (NDP)
data from all the above sources into a single states that “Before 2030, all South Africans will
online public database. This is planned for the have affordable, reliable access to sufficient safe
2021/22 financial year. In addition, the SDG6.1 water and sanitation”.
task team identified the lack of an SDG6
dashboard as a key gap to be addressed in the The national medium term strategic framework
most recent gap analysis. (MTSF) 2019-2024 sets out some specific targets
to be reached by 2024:
Currently, the NIWIS platform, run by DWS,
brings together data from various sources into a • Eradicate inadequate sanitation in Schools;
central portal including service levels (from • Increase the percentage of people with access
NWSKS, below) and water and wastewater to adequate sanitation and hygiene from 83 per
quality data (from IRIS) among others. cent (baseline) to 90 per cent;
• Increase the reliability of water services from 70
National Water Services Knowledge System per cent (baseline) to 95 per cent;
(NWSKS) • 100 per cent of wastewater treatment works to
be operational and functioning.
Currently, the primary location for DWS water and
sanitation service coverage data is the NWSKS.
The system pulls data from the 2011 census
along with water and wastewater quality from
IRIS. The data is adapted bi-annually by the
macro-planning team in DWS based on the
statistical population update estimates provided
by Stats SA. The system does not currently utilise
WASH FACT SHEET FS/11/2021 Page 15Figure 7: National Water Services Knowledge System (NWSKS)
The DWS National Water & Sanitation Master • Above RDP Sanitation: Access to a flush toilet,
Plan incorporates the NDP target: chemical toilet, or ventilated pit latrine. Note that
a normal non-ventilated pit latrine does not meet
• (1.3.8) Deliver services to achieve (100 per RDP standards.
cent) universal water services provision
(Municipal Water Supply Projects);
• (1.3.7) Deliver services to achieve (100 per
cent) universal sanitation coverage (Municipal
Sanitation Projects).
NWSKS Alignment with JMP indicators
Currently the primary DWS database uses census
data to report on the number of households that
have water and sanitation services below or
above a ‘reconstruction and development plan’
(RDP) level. Developed as part of the 1994 RDP,
and prior to the use of JMP definitions for the
Millennium Development Goals, basic ‘RDP’ level
definitions were created to define the minimum
requirement for a basic water and sanitation
service:
• Above RDP Water: A piped municipal supply
within 200 metres of the dwelling providing at
least 25 litres per person per day;
WASH FACT SHEET FS/11/2021 Page 16GHS Alignment with JMP indicators Legend for tables 7 to 11 Water: While the GHS data can be used to report against up to basic level, there are several areas where the data cannot be fully reported as detailed in Table 7. Unimproved water sources may be slightly over-reported as the GHS does not separate improved and unimproved wells and springs; so all wells and springs are reported as unimproved even if protected (which JMP considers improved). It is also possible that limited access is over-reported and basic under- reported because 200 metres is used as the proxy for a less than 30-minute round trip. To report against safely managed, the available when needed questions would need to be expanded to include all water supplies, not only piped water. Finally, water quality data would be needed but requires a separate system to collect that data. Figure 8: Key routine monitoring systems and current ability to report against JMP indicators WASH FACT SHEET FS/11/2021 Page 17
Table 7: Annual GHS Water alignment with JMP
   SAFELY MANAGED                    ●   Located on Premises Can be reported based on responses to GHS WAT1 that
                                                             include ‘in dwelling/house’ or ‘in yard’.
   Drinking water from an
   improved water source which is
   located on premises, available ◐
                                         Available when        WAT9, WAT10, WAT11 and WAT12 gather responses on
                                         needed                availability but only for water from municipal supplies. The
   when needed and free from
   faecal and priority chemical                                question text would need to refer to all types of water
   contamination                                               sources.
                                                               Ways to report against this indicator vary, GHS uses ‘less
                                                               than 15 days interruptions over past 12 months’.

                                     -   Free from             Not applicable to a quantitative HH survey. Required data
                                         contamination         for urban and rural from IRIS. Currently data for urban
                                                               exists, rural is not collected. The WSAs that report into
                                                               IRIS are mainly from urban areas. Rural water quality
                                                               remains a gap (a one-off rural water quality assessment
                                                               survey could provide a JMP baseline while Blue Drop
                                                               reporting is improved over time).

   BASIC                             ◐   Improved source       Is almost fully reported. WAT1 includes improved water
                                                               sources. Wells and Springs that are protected could be
   Drinking water from an
                                                               included as improved if these are included as reporting
   improved source, provided
                                                               options (see Unimproved row below).
   collection time is not more than
   30 minutes for a round trip
   including queuing                ○    Less than 30 minute WAT2: Distance of less than 200m is currently used as a
                                         round trip          proxy for less than 30 minutes. As this does not capture
                                                             the total time including queuing JMP does not include this
   LIMITED
                                                             data in their estimate, instead taking a reference point
   Drinking water from an                                    from the latest DHS survey (2016).
   improved source for which
                                                               JMP suggest that “How long does it take to go there, get
   collection time exceeds 30
                                                               water, and come back?” is asked and the answer is
   minutes for a round trip
                                                               recorded in minutes. This would need to be included as a
   including queuing
                                                               new question in GHS.

   UNIMPROVED                        ○   Unprotected source Can be partially reported. Likely to be over-reporting the
                                                            extent of Unimproved coverage. Currently assumes that
   Drinking water from an
                                                            all of WAT1 (12) well, (13) spring, and (14) other, are
   unprotected dug well or
                                                            unimproved. Current figure is 2%. nationally.
   unprotected spring
                                                               Question WAT1 would need to split the response options
                                                               to include protected or unprotected wells or springs.*

   SURFACE WATER                     ●   Surface water source Can be fully reported. WAT1 includes (10) flowing
                                         type                 water/stream/river and (11) stagnant water/dam/pool.
   Drinking water directly from a
   river, dam, lake, pond, stream,
   canal or irrigation canal

* South Africa has a higher standard for what is considered an appropriate water source, with all wells and
springs not meeting the standard, as compared to JMP which considers protected wells and springs
acceptable. This is therefore relatively little to gain from segregating the data, when anyway the aim of the
country is to move beyond these sources regardless. The only impact is that as a result international reporting
to the JMP will be slightly over-reporting the amount of unimproved sources and slightly under-reporting limited
and/or basic sources.

WASH FACT SHEET FS/11/2021                                                                               Page 18
Sanitation: below minimum national standards. To be able to
report to safely managed new questions would be
While the GHS data can be used to report up to needed to address how waste stored temporarily
Basic level, there are several areas where the or treated in-situ is dealt with. For toilets
data cannot be fully reported as detailed in Table connected to a sewer additional data would be
8. Unimproved would currently be over-reported needed from the Green Drop system to confirm if
as DWS classifies all pit latrines not ventilated as there is at least primary treatment.
Table 8: Annual GHS Sanitation alignment with JMP
SAFELY MANAGED ○ Treated and This is not currently included in the GHS. New questions
disposed in situ would need to be added. The JMP suggested core
Use of improved facilities
questions that would need to be added are: (i) Has your
which are not shared with other
(toilet type) ever been emptied? (ii) The last time it was
households and where excreta
emptied, where were the contents emptied to?
are safely disposed in situ or
transported and treated off-site
◐ Stored temporarily SAN1 includes toilet types that require storage and
and then emptied emptying. Whether pits/tanks/buckets are actually emptied
and transported to and where it goes would require two new questions to be
treatment off-site added to the GHS as detailed above.
● Transported SAN1 includes if the toilet is connected to a sewer.
through a sewer Whether it is then treated offsite requires data from Green
with wastewater and Drop. If all sewers connect to at least basic treatment it can
then treated off-site be assumed that all sewer connections are safely
managed.
BASIC ◐ Improved SAN1 includes options for improved latrines. It is likely that
a significant proportion of non-VIP latrines meet the JMP
Use of improved facilities
criteria for ‘improved’. Response options would need to be
which are not shared with other
expanded to include without VIP which either with slab or
households
without slab/open pit. (see unimproved row below).
● Shared Can be fully reported. SAN3 asks if the toilet facility is
shared with other households.
LIMITED
Use of improved facilities
shared between two or more
households
UNIMPROVED ○ Unimproved pit SAN1 splits pit latrines by with or without VIP. DWS
latrine considers all non-VIP latrines as unimproved; currently
Use of pit latrines without a
15% nationally. It is likely that a significant proportion of
slab or platform, hanging
these would meet the JMP criteria for ‘improved’.
latrines or bucket latrines
Response options would need to be expanded to include
without VIP which either with slab or without slab/open pit.
OPEN DEFECATION ● Open defecation Can be fully reported. SAN1 includes an option for (10)
open defecation
Disposal of human faeces in
fields, forests, bushes, open
bodies of water, beaches and
other open spaces or with solid
waste
WASH FACT SHEET FS/11/2021 Page 19Table 9: Annual GHS Hygiene alignment with JMP
BASIC ◐ Soap SAN7 asks if household members clean their hands with water and
observation soap after using the toilet. This is a higher standard, although self-
Availability of a handwashing
reported. JMP collects data on the observation of water and soap.
facility on premises with soap
◐ Water GHS surveyors would need to ask to observe the presence of
and water
observation water and soap to be able to report against JMP indicators.
LIMITED ◐ Handwashing SAN6 asks if there is a facility (self-reported). This is used by
facility DWS. JMP does not use this data, possibly because it is self-
Availability of a handwashing
observation reported rather than from observation, therefore JMP used DHS
facility on premises without
2016 instead as the latest available data. GHS surveyors would
soap and water
need to ask to observe a handwashing facility to be able to report
against JMP indicators.
NO FACILITY
No handwashing facility on
premises
Hygiene: As detailed in Table 9 there is currently
Census Access to Piped Water question: only
limited alignment between the GHS and JMP
50 per cent of people were found to correctly
indicators. Currently the GHS uses self-reporting report their situation. Inappropriate answers
rather than observation as suggested by JMP. were highest in informal and rural areas; the
Additional observational questions for a facility, most unserved areas. It was found that
soap and water would be needed for GHS to be technical language such as ‘household’,
‘dwelling’ and ‘household use’ were not
able to be used to report against the JMP
understood by at least 80 per cent of people
indicators. in the study. For example, the ‘main source’
of water could be reported as ‘river/stream’ for
A recent study in South Africa (Box 1) brings a tap on premises because this is the original
attention to the importance of not only aligning ‘main source’ of the water.
indicators but also on ensuring that questions are
worded and framed in a way that solicits correct
and accurate responses.
BOX 1.
SOUTH AFRICA SURVEY
QUESTION REVIEW
IDENTIFIES KEY DATA
ISSUES
GHS Sanitation question: For the main
The Water Research Council (WRC) was sanitation question in the GHS the incorrect
commissioned by the DWS to explore to what reporting rate was 32 per cent, with the
extent households survey responses are primary reason due to incorrect classification
accurately representing their situation. A total of facility type. More than half of respondents
of 102 in-depth qualitative interviews took did not understand what the type ‘with/without
place across three rural areas. Some notable vent pipe’ meant. There was also a low
highlights include: correct understanding of the term ‘chemical
WASH FACT SHEET FS/11/2021 Page 20Blue and Green Drop Alignment with JMP
toilet’; a toilet cleaned with chemicals, all indicators
modern toilets, toilets that clean germs, etc.
Water service authorities and providers are
expected to keep records of the number of
households receiving their services, including
whether direct to the household or through a
communal tap. When operational, BlueDrop will
collect data on water service disruptions that can
be used to determine if water is available when
needed.
Water quality data continues to be collected and
reported as part of regulatory requirements. This
data could be combined with data from surveys to
To test and identify how correct reporting
provide estimates for safely managed services. A
could be improved, cognitive action research
was employed through a series of iterative key barrier at present is that the Blue drop (and
steps where the original questions and currently IRIS) do not separate service metrics
response options were revised while keeping and water quality data by urban and rural, as they
the underlying indicators the same. As a are instead presented per WSA or water system.
result, The WRC have proposed several
options for improving the GHS and census
questions and put forwards options for studies When in operation, Green drop collected
that could potentially lead to changing past information on the type of treatment. This data
data estimates based on the identified rates could be combined with households’ survey data
of incorrect reporting. to provide an estimate for safely managed
This study raises important questions for sanitation for households with a sewer
other countries. connection.
Table 10: Blue drop alignment with JMP
SAFELY MANAGED ◐ Located on Premises Should be included as part of the water service provider
database.
Drinking water from an
improved water source which
is located on premises, ◐ Available when Service continuity metrics were a part of the Blue drop
available when needed and needed system.
free from faecal and priority
chemical contamination ◐ Free from Water quality data continues to be reported but primarily
contamination for WSAs serving urban area. No or limited data for rural
areas.
BASIC ◐ Improved source Service providers should include the number of
households served by their piped systems.
Drinking water from an
improved source, provided
collection time is not more
than 30 minutes for a round
trip including queuing
WASH FACT SHEET FS/11/2021 Page 21Table 11: Green drop alignment with JMP
SAFELY MANAGED ◐ Transported through The type, level, functionality and performance of
a sewer with wastewater treatment sites was collected by the Green
Use of improved facilities which
wastewater and then drop system
are not shared with other
treated off-site
households and where excreta
are safely disposed in situ or
transported and treated off-site
Data indicators within the NEIMS align with JMP
Basic for water and JMP limited for sanitation,
Ideal Clinic/Hospital Alignment with JMP while there are no indicators for hygiene facilities.
indicators
However, as the system is only updated after
The ideal clinic data could enable reporting on improvements are made the data set cannot be
water in health care facilities up to the basic level used to report against JMP indicators.
and sanitation to a limited level. Some new
questions would need to be added to the Ideal
clinic assessment tool to enable reporting on
sanitation to a basic level (Table 13). No data is
currently asked related to the JMP hygiene
indicator, and environmental cleaning could be
reported to basic level. The waste management
questions would need to be slightly adapted to
enable reporting to basic level and would currently
be limited to reporting up to the limited level.
National Education Infrastructure Management
System alignment with JMP indicators
Table 12: WASH in Schools
Indicator Alignment Usable Data? Data Source and
Comments
WATER JMP Basic No Existing data from the
NEIMS could be aligned with
Basic: Drinking water from
JMP definitions to report up
an improved source is
to JMP Basic level. However,
available at the school
the data is not updated
frequently and would not
meet the requirements for
JMP reporting.
SANITATION JMP Limited No The presence of an improved
facility is know, but there is
Basic: Improved facilities,
no data on whether the
which are single-sex and
facilities are sex-segregated.
usable at the school
HYGIENE No Data No NEMIS has no data for
hygiene facilities.
Basic: Handwashing
facilities, which have water
and soap available
WASH FACT SHEET FS/11/2021 Page 22Table 13: WASH in Health Care Facilities based on the ideal clinic and hospital tools
Indicator Data Source and Comments
Alignment
WATER JMP Basic Could report to basic level based on the existing survey question
Water is available from an improved
source on the premises
SANITATION JMP Limited Could possibly report to limited level. By reporting that sanitary
facilities are available and all toilets are functional, there must be
Improved sanitation facilities are
at least 1 latrine. SA only permits improved toilets, so it could be
usable with at least one toilet
assumed that all are improved. To be clear the survey would
dedicated for staff, at least one sex-
need to ask:
separated toilet with menstrual
hygiene facilities, and at least one # of facilities
toilet accessible for people with
Type of facilities (improved/unimproved)
limited mobility.
In order to report to basic, new questions would need to be added
to the survey:
At least one dedicated toilet for staff
At least one sex-separated toilet with menstrual hygiene facilities
at least one toilet accessible for people with limited mobility.
HYGIENE No Data Questions needed to reported to limited level:
Functional hand hygiene facilities water available at handwashing facilities
(with water and soap and/or
soap available at handwashing facilities
alcohol-based hand rub) are
available at points of care, and To report to basic level additional questions needed:
within 5 metres of toilets.
Handwashing facilities are available at the points of care
Handwashing facilities are available within 5-meters of toilets
WASTE MANAGEMENT JMP Limited Sharps disposed of appropriately suggests separately and health
care waste is managed appropriately suggested also separated,
Waste is safely segregated into at or not able
therefore suggesting three bin segregation. To reach basic these
least three bins, and sharps and to report
questions would need to be clarified:
infectious waste are treated and
disposed of safely. Sharps are disposed of appropriately ‘including in a separate bin’
Healthcare waste is managed appropriately ‘including in a
separate bin’
And a further question added:
Infectious waste is treated and disposed of safely
ENVIRONMENTAL CLEANING JMP All cleaners have been trained on cleaning procedures should be
sufficient to report to basic level and it covers both training and
Basic protocols for cleaning are Basic
the presence of procedures (basic protocols). It could be made
available, and staff with cleaning
more explicit by adding a further question:
responsibilities have all received
training. Basic protocols for cleaning are available
WASH FACT SHEET FS/11/2021 Page 23Aligning the level of data needed with the level
of data collected
3 Key Findings As above, granular local level planning requires
granular local level data and there is a
Strong institutional arrangements and misalignment between what is available from the
commitment to achieve and report against GHS and the type of information needed for
SDG6 detailed planning, resulting in ‘old’ non-routine
data being used. A functional infrastructure IMS
South Africa, through the initiative of the DWS,
would bring alignment and provide the level of
has established strong institutional arrangements
granular data that has been needed.
and systems for working towards achieving
SDG6, realised through the DWS SDG6 structure The lack of a typical national infrastructure
of task teams. This ongoing structure and IMS system mainly affects national planning
incorporated annual reporting and planning will
continue to drive attention to SDG6 data, gaps The DWS has long-term ambitions to create a
and priority areas. The DWS have taken strong national infrastructure asset database IMS. Water
ownership of their responsibility to lead on service authorities and providers are responsible
monitoring SDG6, including the current process of for the operation and maintenance of systems in
establishing linkages with DBE and DoH to start their geographic areas and to varying degrees
to routinely gather data on WASH in institutions. maintain their own non-standardised systems for
managing operations and responding to non-
The annual task team gap reports have some functionality. The main impact of a lack of national
gaps IMS has therefore not been on functionality but
the lack of recent granular level data that can be
The current annual gap reports developed by the
used by DWS for granular level planning.
task teams focus on gaps in services required to
reach the SDG6 targets. Only the SDG6.1 water Blue/Green drop could bring in actionable
task team also considers routine monitoring and routine monitoring data
data gaps, calling for a dedicated SDG6 data
portal, highlighting the rural water quality data The reintroduction of the Blue and Green drop
gap, and the need to formalise other departments’ performance management systems brings an
data collection for WASH in institutions. opportunity to explore creating a national IMS, as
all systems and areas fall under the responsibility
Routine data has not been widely used of a water service authority. While individual
households will not be surveyed, using the right
While the routine monitoring data provided by the
indicators could enable estimates for service
GHS enables DWS to see general trends and
levels and coverage to be compiled nationally,
progress, to date all major planning exercises
providing a more routine and up-to-date data
carried out centrally by DWS have required the
source than the census.
more granular data that currently only the census
can provide. This is due to the planning process There is widespread willingness to adapt
requiring specific local identification of where current tools to align with SDG/JMP
service gaps are to enable specific project-based
budgeting. As a result, the most recent national Stats SA consider SDG/JMP as international
planning exercises have been using 2011 data reporting and therefore questions relating to these
adapted based on population projections only. indicators fall within ‘category A’, prioritising them
WASH FACT SHEET FS/11/2021 Page 24You can also read