Sentinel 1A for monitoring land subsidence of coastal city of Pakistan using Persistent Scatterers In SAR technique
←
→
Page content transcription
If your browser does not render page correctly, please read the page content below
www.nature.com/scientificreports
OPEN Sentinel‑1A for monitoring
land subsidence of coastal city
of Pakistan using Persistent
Scatterers In‑SAR technique
Muhammad Afaq Hussain1, Zhanlong Chen1*, Muhammad Shoaib2, Safeer Ullah Shah3,
Junaid Khan4 & Zheng Ying1
Karachi is located in the southern part of Pakistan along the Arabian Sea coast. Relevant institutions
are concerned about the possibility of ground subsidence in the city, contributing to the comparative
sea-level rise. So yet, no direct measurement of the subsidence rate and its relation to city
submergence danger has been made. SAR (Synthetic Aperture Radar) interferometry is a powerful
method for obtaining millimeter-accurate surface displacement measurements. The Sentinel-1
satellite data provide extensive geographical coverage, regular acquisitions, and open access. This
research used the persistent scatterer interferometry synthetic aperture radar (PS-InSAR) technology
with Sentinel-1 SAR images to monitor ground subsidence in Karachi, Pakistan. The SARPROZ
software was used to analyze a series of Sentinel-1A images taken from November 2019 to December
2020 along ascending and descending orbit paths to assess land subsidence in Karachi. The cumulative
deformation in Line of Sight (LOS) ranged from − 68.91 to 76.06 mm/year, whereas the vertical
deformation in LOS ranged from − 67.66 to 74.68 mm/year. The data reveal a considerable rise in
subsidence from 2019 to 2020. The general pattern of subsidence indicated very high values in the
city center, whereas locations outside the city center saw minimal subsidence. Overall, the proposed
technique effectively maps, identifies, and monitors land areas susceptible to subsidence. This will
allow for more efficient planning, construction of surface infrastructure, and control of subsidence-
induced risks.
Analyzing and monitoring subsidence in large cities allows meaningful insights for mitigating the probable loss
of property and life due to increasing development rates in many regions around the g lobe1. A range of variables
that could produce urban subsidence includes human and natural reasons such as building loads2–4, lithology2,5–7,
groundwater consumption3,8,9, tectonic a ctivity3,10, dewatering11, seasonal effects12, mining activities13. Each of
these variables might have a unique impact on surface deformation. Worldwide, migration of people from villages
to cities regions in search of better employment access and opportunities to the standard of living amenities. Nat-
ural resources are being harmed due to unplanned and unregulated expansion in an area. The need for daily water
extraction is rising, and consequently, excessive groundwater extraction is producing surface l iquefaction14–17.
Land subsidence (LS) associated with variables such as seismic activity and groundwater extraction may influ-
ence human life, the environment, and urban infrastructure. The Indo-Gangetic plains are prone to subsidence18.
The main reason behind this is high population density leading to over-extraction of groundwater. Numerous
modern researchers have investigated the volume of global groundwater extraction in order to investigate the
role of reduced continental water storage to sea-level rise19–21. Groundwater extraction increases the expense
of pumping or causes wells to dry up, influencing u sers22; reduces groundwater flow to streams, wetlands, and
springs, harming ecosystems; and causes land s ubsidence23, diminishing storage irrevocably and possibly destroy-
ing infrastructures24. However, the extent of the harm is not usually understood until it is too late. Pakistan
is not immune to Land S ubsidence25–27. However, no complete information on the features of LS is currently
accessible and valuable in mitigation efforts and planning, which is primarily hampered by the lack of accurate
1
School of Geography and Information Engineering, China University of Geosciences (Wuhan), Wuhan 430074,
China. 2State Key Laboratory of Hydraulic Engineering Simulation and Safety, School of Civil Engineering, Tianjin
University, Tianjin, China. 3Ministry of Climate Change, Government of Pakistan, Islamabad, Pakistan. 4School of
Engineering, China University of Geosciences (Wuhan), Wuhan 430074, China. *email: chenzl@cug.edu.cn
Scientific Reports | (2022) 12:5294 | https://doi.org/10.1038/s41598-022-09359-7 1
Vol.:(0123456789)
www.nature.com/scientificreports/
chronological data. The land subsidence in coastal regions can accelerate the pace of relative Sea Level Rise
(SLR) and increase the frequency and severity of coastal fl oods28. Since the previous decade, studies have raised
concerns regarding flooding, coastal land subsidence, erosion caused by coastal development, and natural risks
such as SLR29. Due to a lack of awareness about the severity of the problem and a scarcity of up-to-date informa-
tion regarding human-induced LS, no scientific research has been conducted to measure the LS rate. Because the
variables that cause LS vary by area, this model was developed to adapt subsidence inputs based on the specific
features of a studied region. The reason for subsidence and the interaction, connections, and integration between
these causative variables must be thoroughly investigated to achieve this aim.
In the last two decades, Remote Sensing (RS) technology such as synthetic aperture radar interferometry
(In-SAR) has proved their significant potential in various fields, including but are not constrained to studying
groundwater extraction30, deltaic LS31,32 and landslide deformation33,34. Because of its capacity to acquire data reg-
ularly and repeatedly, it makes historical data archives available. Several sophisticated approaches, such as Small
Baselines Subset A pproach35, Parallel Small BAseline Subset (P‐SBAS)36, Permanent Scatterers-InSAR37, Spatio-
Temporal Unwrapping N etwork38, and the Interferometric Point Target Analysis39, have now been developed.
Differential Interferometry Synthetic Aperture Radar (D-InSAR) is a method that uses space to collect large-
scale surface micro-deformation i nformation40. The D-InSAR approach results from quantitative advancements
in RS, particularly microwave RS. However, as research has progressed, various drawbacks of classic D-InSAR
have gradually been revealed, limiting its applications. Such as atmospheric interference, spatial decorrela-
tion, and temporal decorrelation41,42. To address these issues, researchers suggested PS-InSAR41. As dozens of
acquisitions may be utilized to produce multiple pairs, this technique eliminates the impact of decorrelation
and atmospheric effects in standard D-InSAR. It assures that the approach may be employed even when the
critical baseline is exceeded by the baselines of numerous pairs of acquisitions. Compared to GPS and leveling
technologies, PS-InSAR can get a ten-year sequence of surface deformation data from hundreds of scenes. PS
point density is significantly higher than data point density produced by GPS and standard leveling measuring
techniques. This technique not only saves money, but also ensures sufficient precision for ground deformation
monitoring, as confirmed by GPS and leveling t echnology42. As a result, in recent decades, PS-InSAR has been
extensively used in a variety of applications, including bridge detection, building deformation monitoring, and
surface subsidence43–45.
Many cities have used InSAR to monitor LS lead by human proceedings such as groundwater extraction
and development8,46–50. The generation of time-series of subsidence observation with high temporal precision
primarily depends on sophisticated multi-temporal interferometry approaches, including persistent scatter
interferometry (PSI)51–53. PSI has been shown to accurately characterize linear deformation (very slow-moving
or slow) in locations with a high density of “permanent scatters” (e.g., buildings)8,54,55. Combining these two
approaches is preferred for characterizing the complicated deformation process over large-scale land develop-
ment areas and fast urbanization when radar targets are neither steady nor restricted. Precise ground velocity
calculations can help to minimize ambiguity in liquefaction models. Microwave remote sensing data allows for
accurate measurement of surface movements. To identify subsidence in the research region, our model relies
on the PS-InSAR t echnique37. PS-InSAR is a SAR-based deformation observation approach that identifies and
exploits stable targets as persistent scatterers in a temporal sequence of interferograms to solve the temporal and
geometrical decorrelation issues of differential interferometric SAR (D-InSAR). This method can detect surface
deformation over a large region with millimeter-level a ccuracy56.
Pakistan’s coastline is densely i nhabited57, and land deformation has been recorded in recent y ears58,59. Kara-
chi, Pakistan’s largest metropolitan region, suffers from unsustainable and unregulated urban growth. Some of
its beachfront lands have recently been recovered for tourist spots, commercial, and residential—coastal erosion,
waterlogging and uncontrolled land reclamation increase the likelihood of LS in Karachi57,60,61. Consequently,
measuring and monitoring LS in a dense urban coastal metropolis (Karachi) is critical for sustainable urban
expansion. As a result, this work aims to estimate land deformation in Karachi on a multi-temporal scale to
identify regions sensitive to land deformation.
Ground subsidence is a significant problem in several Pakistani cities, including Karachi62, with about 16.5
million (Census report 2017), and is home to many educational institutions, including military, medical and
engineering colleges. The local administration has developed various water supply projects collaborating with
the Japan International Cooperation Agency (JIPC 2008) to support urban expansion62. Some investigators have
monitored LS rates in Karachi city using InSAR techniques during the last decade. Nevertheless, most of those
studies relied on incorrect data, introducing uncertainty into the resulting subsidence rates. These studies used
an insufficient number of ascending data sets and Envisat data set. In this regard, in the recent study compared
to the earlier studies on Karachi city, we: (1) used PSI technique and concentrated primarily on urban areas, (2)
used both descending and ascending track, (3) used Sentinel-1 SAR data, (4) estimated the subsidence rate in
current years, and (5) computed LOS and vertical deformation.
This research was carried out to monitor ground subsidence in Karachi, Southern Pakistan, from 23 Novem-
ber 2019 to 23 December 2020 and 20 December 2019–26 December 2020, with both ascending and descending
tracks. Because the satellite can see the same target area from different positions, with incidence angles ranging
from vertical (~ 23°) to horizontal (~ 45°)63 in the East–West direction, descending and ascending track images
are used to improve visualization and truly comprehend deformation from different directions64. In addition, our
work assesses the capacity of applying the PS-InSAR technology for LS investigations along coastal r egions65–67.
Scientific Reports | (2022) 12:5294 | https://doi.org/10.1038/s41598-022-09359-7 2
Vol:.(1234567890)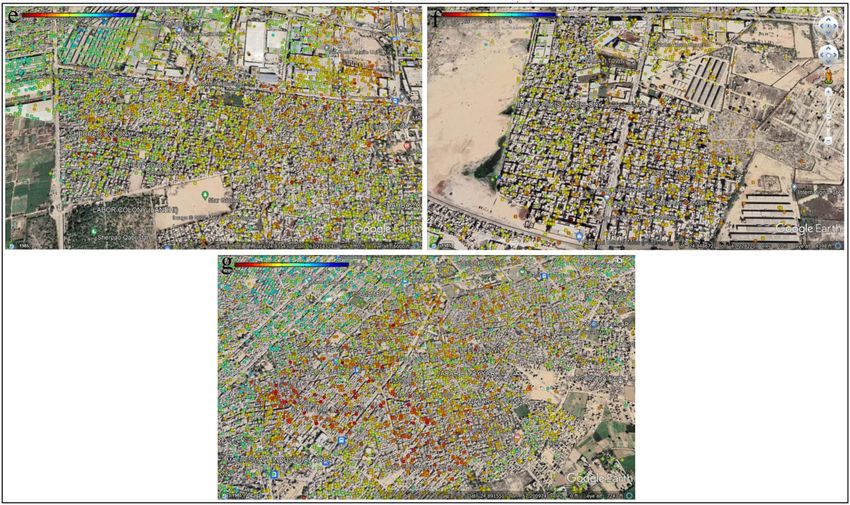
www.nature.com/scientificreports/
Figure 1. The geographical location of the study area.
Study area
Geographically, the extent of the study area is marked by latitudes from 24° 43′ N to 24° 57′ N and longitudes
from 66° 53′ E to 67° 20′ E (Figs. 1 and 2), covering an area of about 737 km2. Karachi is an industrial hub of
Pakistan with a population of 16.05 million. It is the largest urban city of Pakistan, divided into six districts
(Table 1). It is located approximately 128 km from the mouth of river Indus while its southern and south-western
part is along the Arabian Sea. The topography is flat as slopes range between 0° and 4° except for hilly areas in
the northwestern parts where slopes range up to 64°. The length of the coastline from Karachi Port Trust (KPT)
to Korangi is ~ 25 km.
The research area is located in the world’s northern tropical zone. This tropical zone encompasses most of
the world’s desert belts, with significant mountain belts oriented north–south on the west. The study region has
a moderate climate, little precipitation, and extremely scorching summers. However, due to their proximity to
the sea, these locations maintain a high degree of humidity. Based on the previous 50 years of data, the average
annual rainfall in Karachi is around 200 mm, and winter temperatures range between 24 and 28 °C, while sum-
mer temperature ranges between 34 and 38 °C (Pakistan Metrological Department)68.
Scientific Reports | (2022) 12:5294 | https://doi.org/10.1038/s41598-022-09359-7 3
Vol.:(0123456789)
www.nature.com/scientificreports/

                                           Figure 2.  Research area (red color) with a footprint of the master area and reference points.

                                           Geological setting of the area.         Karachi city lies on the southern side of the Indus basin. The research
                                           area is mainly composed of two formations: the Gaj Formation (Miocene age), the Manchar Formation (Plio-
                                           Pleistocene age), and the Quaternary deposits (Fig. 3). According to the Geological Survey of Pakistan, the
                                           research area is composed of the following lithology.

                                           Gaj formation. Gaj formation Composed of gravel, Sandstone, Limestone, and Clay. The gravels are depos-
                                           ited over various degraded bedrocks, such as shales, sandstones, and limestones. Areas of silty or worn gravely

          Scientific Reports |   (2022) 12:5294 |               https://doi.org/10.1038/s41598-022-09359-7                                              4

Vol:.(1234567890)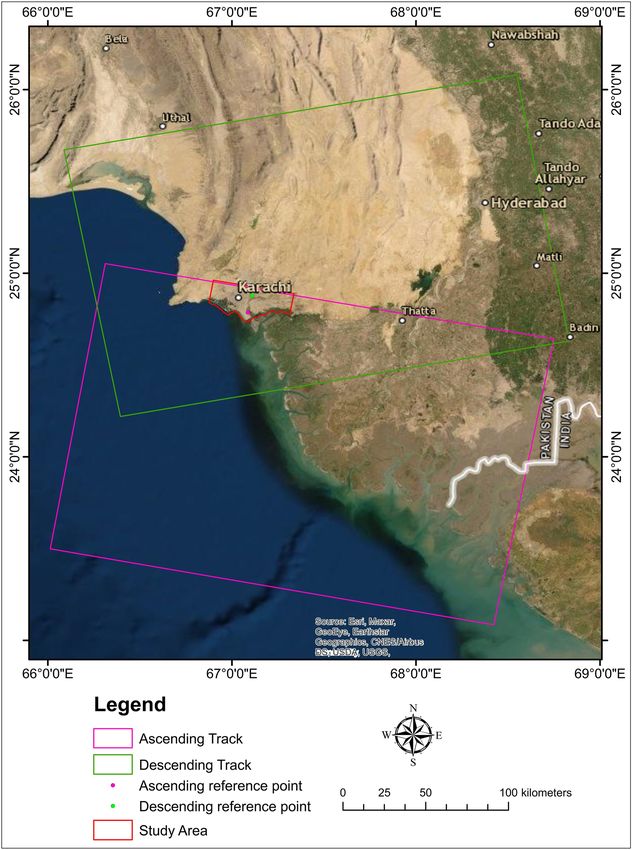
www.nature.com/scientificreports/
Districts No of hh Person per house Population
Karachi south district 327,518 5.47 1,791,751
Malir district 338,257 5.94 2,008,901
Korangi district 421,618 5.83 2,457,019
Karachi east district 509,647 5.71 2,909,921
Karachi central district 539,127 5.51 2,972,639
Karachi west district 634,459 6.17 3,914,757
Total 2,770,626 5.80 16,054,988
Table 1. Overview of the district-wise number of Households (hh), Persons per house, and population in
Karachi (Census, 2017).
Figure 3. Geological map of the research area.
soil cover the inter-mound patches. The gravel deposits appear to be the lateral planted depositional surface
formed across the eroded bedrocks by a free-flowing and ever-shifting river system. There is more than one level
of these gravels, which might be the terrace remains created by the consecutive change of base level of erosion.
Limestone in Gaj formation is light brown to a golden brown, and sandstone is grey and brown. The color of Clay
is grey-brown and yellow in Gaj formation.
Manchar formation. Manchar Formation comprises sand, sandstone, silt, conglomerates, and gravel
patches. The surface has formed on the eroded margins of crumbly sandstone and shales from the Plio-Pleisto-
cene Manchar formation. The warping in the Manchar Formation is relatively mild. Pleistocene conglomerates
exist unconformably on the Manchar Formation eruptive surface. The color of sandstone in the Manchar Forma-
tion is grey and greenish-grey.
Quaternary sediments. Quaternary sediments or Recent Alluvium are mainly composed of sand, silty
sand, sandy silt, deltaic, coastal, and eruptive mud deposits of recent age with minor clay components, most
likely as a result of coastal geographic control and domination of aeolian deposits from the s hore69. It is tectoni-
cally stable. It creates the platform cover in the Indus basin, and the valley fills in the intermountain basin.
Scientific Reports | (2022) 12:5294 | https://doi.org/10.1038/s41598-022-09359-7 5
Vol.:(0123456789)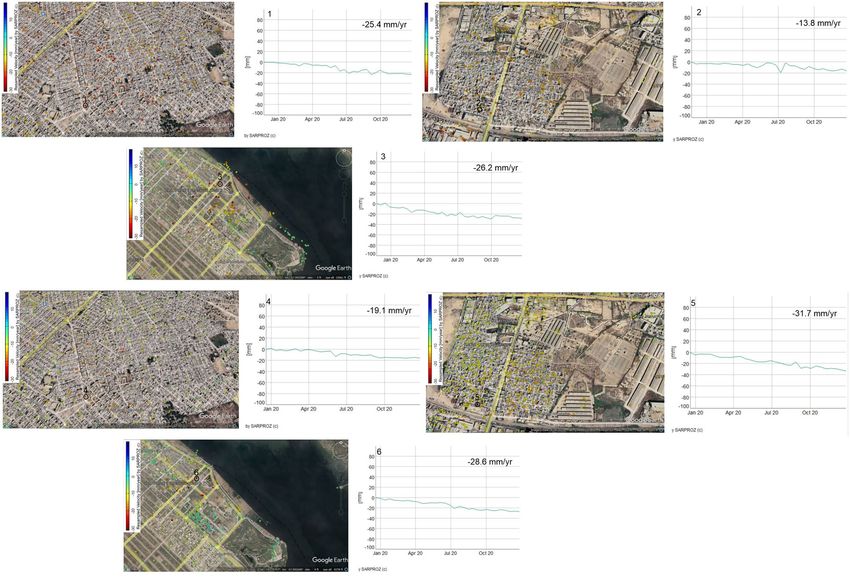
www.nature.com/scientificreports/
Figure 4. Flowchart of the research.
Methodology
Data processing. In this investigation, we employed Sentinel-1 C-band SAR pictures recorded along both
ascending and descending orbit tracks (Alaska Satellite Facility: https://asf.alaska.edu/about-asf/). To complete
the analysis in C-band data, the PSI70 requires at least 20 SAR pictures71. The PSI monitors surface subsidence
over months or years, accounting for signal noise, atmospheric, and topographic impacts. This sensor has a
ground resolution of around 20 m in the azimuth direction and 5 m in the range direction72,73. This sensor has
several acquisition modes, including interferometric wide (IW), wave (Wave), extra-wide swath (EW), and strip
map (SM). When comparing the IW mode to other acquisition modes, it was discovered that the IW mode
requires more data processing for co-registration of images with a high precision of up to 0.001 pixels74. The 34
images from the ascending track (23 November 2019–23 December 2020) and 32 images from the descending
track (20 December 2019–26 December 2020) were collected for this study.
The IW acquisition mode was used to acquire all of the images. Sentinel-1, IW mode covers a single scene with
a coverage area of 250 km2. The Terrain Observation by Progressive Scan (TOPS) mode divides the single scene
into three sub-swaths. Because SAR imagery has a high temporal and spatial resolution and a short returning
time, it may be used to study subsidence events from satellites75. SARPROZ software (https://www.sarproz.com/
sarproz-faq) was utilized for this research, which is highly beneficial for InSAR data studies and commercial
software74. SARPROZ has been successfully used, for example, by Qin et al.76 to create a liquefication map of
Hong Kong demonstrating the PSI’s precision to the millimeter level. It employs the concepts of the PS-InSAR
method as detailed by41,77. The PS-InSAR process involved the preparation of data, data analysis, APS Estimation,
and Multi-image Processing. The methodology followed in the research is shown in Fig. 4.
Importing SLC data with accurate orbits is one of the processing steps in data preparation. Imagery with
the same rotations, both descending and ascending, was chosen for this study. However, both descending and
ascending images cannot be analyzed simultaneously. Following that, the polarization of images was determined
based on orbit information, and master and slave images were chosen. The master images covering the study
region were retrieved first, followed by slave images covering the same common area as the master image. In
this case, a star graph was generated between the slave image and the master image (Fig. 5). A specified region
was evaluated and co-registered during the co-registration p hase74.
Atmospheric phase screen (APS), orbital inaccuracies, and other factors were calculated and removed. Fol-
lowing that, the phase stability was evaluated. Absolute amplitude levels were primarily indifferent to generat-
ing processing d isruptions78. As a result, it was predicted that the pixels would have identical amplitudes and
reduced phase dispersions for all of these acquisitions. PS is chosen in the SARPROZ software process based on
the amplitude stability index (ASI). Various atmospheric phase delays impact SAR pictures during acquisitions,
and signal interruptions, such as radar signals being affected by aerosol particles, often happen74. Multiple spa-
tial–temporal filtrations are employed to compute the Atmospheric phase screen to prevent these disruptions in
dataset79. At this point, Atmospheric phase screen findings are discarded, whereas linear deformation velocities
and topographic height effects are calculated from the advanced s tages74.
Ss37.
For this objective, an acceptable threshold, ASI > 0.75, is proposed as a reference for selecting the initial P
In our research, ASI > 0.6 was used to choose PSs. This restrictive parameter estimation fulfills by allowing just
Scientific Reports | (2022) 12:5294 | https://doi.org/10.1038/s41598-022-09359-7 6
Vol:.(1234567890)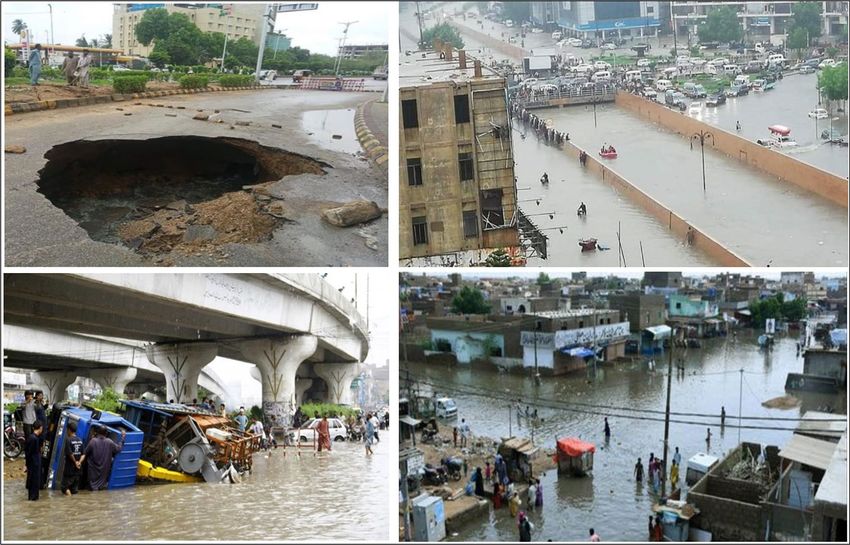
www.nature.com/scientificreports/
Figure 5. Star graphs depict the perpendicular/temporal baseline distribution of data pairs.
Figure 6. The graphs between the temporal coherence and connections for Ascending path on the left side and
Descending path data on the right side.
a limited number of PS points, which is essential for calculating the proper APS. Following the selection of the
first PS, it is necessary to build a reference network by connecting PSs using Delaunay triangulation at this point.
This is continued by removing the calculated linear model (residual height and linear displacement velocities)
and estimating APS from the phase residual using an inverse network. It is also critical to establish one point
of reference and determine its velocity here. Following graph inverting and APS elimination, temporal coher-
ence evaluation of PSs was performed to assess APS integrity, yielding an acceptable outcome with a coherence
greater than 0.7 (Fig. 6).
The second-order PS points were chosen in the Multi-Image Sparse Point Processing stage. At this point,
ASI > 0.6 criteria were used to obtain denser PS p oints78. To the removal of APS, the same parameters and refer-
ence points were utilized while processing the APS estimate. Ultimately, all PS points were geocoded and overlaid
on Google Earth, and only PS points with coherence 0.70 or higher were chosen for the resulting subsidence
map78.
Finally, the identified deformation regions were converted into an external reference framework, i.e., geo-
graphical coordinates. The resulting ground displacement map and geology map overlay and loaded into Geo-
graphic Information System (GIS) for further investigation. The GIS study included combining PS-InSAR find-
ings with a geological and groundwater extraction62 to evaluate and confirm the observed subsidence regions,
which were then assessed in the geological setting of Karachi. The results of the preceding stages were then
integrated with various information layers in ArcGIS. These layers were utilized to evaluate the research region’s
geological formations and Groundwater extraction and their connection with PS-InSAR-estimated subsidence.
Scientific Reports | (2022) 12:5294 | https://doi.org/10.1038/s41598-022-09359-7 7
Vol.:(0123456789)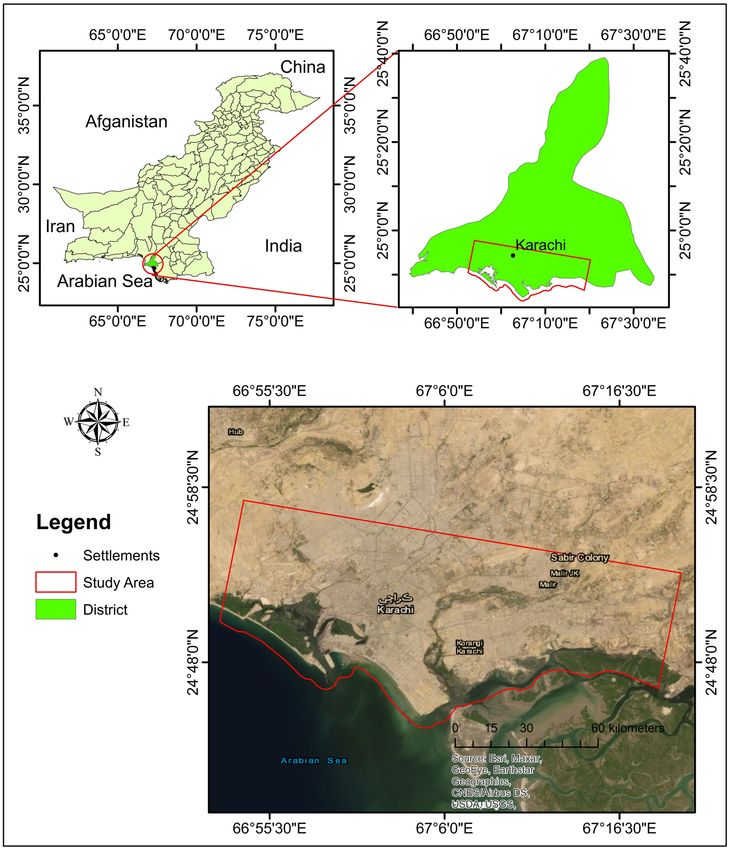
www.nature.com/scientificreports/
Figure 7. The scatter plots of Sentinel-1 data ascending and descending path on the lift to the right side
(2019–2020).
Results and discussion
We employed PS-InSAR, as explained above, implemented in SARPROZ for deformation monitoring in this
region, which allowed us to discover deformation zones in Karachi City. The green color represents the stable
spots determined by a stability threshold range (from − 10 to 10 mm/year). PS-InSAR uses a reference point
to calculate and identify movements in the region; therefore, a stable point is chosen as a reference point to
compare with the motions of other points in the area. While using this method, temporal coherence must be
sufficient for further evaluation. PS points with temporal coherence > 0.7 were regarded as reliable, with a lower
likelihood of mistake74.
When measuring motion along the LOS with PS points, it was discovered that the movement in the opposite
direction of the sensor was negative, as shown in red. Other stable spots within the research region that reflect
practically minimal movement are depicted in Fig. 6 (blue to light blue). In contrast, sites that showed compa-
rably significant movement relative to the blue dots but lesser movement relative to the red dots are designated
as yellow to dark yellow and orange. Subsidence in Karachi was measured to be between − 20 and − 30 mm/year
(Fig. 7). The scatter plot data indicate that there was significant subsidence in Karachi City.
During the analysis period, the subsidence map derived from both ascending (path number 42) and descend-
ing (path number 78) paths revealed a significant number of PS locations in the studied region (Fig. 8). The
rectangular portion of scatter plots from ascending and descending is placed onto Google Earth in the research
region. Figure 8 shows a thick points cloud in the research region; the findings in both the descending and
ascending paths demonstrate that most of the area is stable (marked in blue), mainly upland. While the main
habitation sites along the main road are shown in red, the comparatively high subsidence region is not. The
color ramp represents movement and the relative stability of the PS points (red = high, blue = steady, yellow/
light green = low).
Six PS locations (1, 2, 3, 4, 5, and 6) from the subsidence region were chosen from the descending and
ascending findings in the research area (Fig. 9). The PS points, in this case, illustrate the relative movement and
stability (red = high, blue = stable, yellow/light green = low) in comparison to the surrounding. Figure 9 depicts
subsidence analyses along with these six PS locations.
Red dots show the subsidence area in Fig. 8. The acquired data illustrate differences in ground subsidence
from point to point across the research periods. Figure 9 depicts the subsidence along with these sites, ascend-
ing points (1, 2, 3) and descending points (4, 5, 6). Points 1 and 4 are located in the northernmost part of the
study area, where subsidence reached − 25.4 mm/year and − 19.4 mm/year, respectively. While points 2 and 5
are located in the central parts of the research area, where subsidence reached − 13.8 mm/year and − 31.7 mm/
year, respectively, during the study analyzed period. PS sites 3 and 6 are located in the southern portion of the
research region and had subsidence rates of − 26.2 mm/year and − 28.6 mm/year, accordingly, during the study
period. The data show that subsidence was significantly higher in the city’s center, whereas it reduced in the
northern and southern areas of the city.
The subsidence along these six PS locations was investigated, and the results demonstrate fluctuations in
subsidence from 2019 to 2020. Figure 9 depicts the visual representations of these six points. The graphs clearly
illustrate those points 2 and 5 have considerable subsidence and are positioned in the center of the research
region, whereas points 1, 3, 4, and 6 have minor subsidence over the study period.
Vertical velocity of Karachi. Figure 10 depicts the vertical deformation map composed of descend-
ing and ascending Line of Sight (LOS) geometries; positive value shows steady to gentle uplifting movement,
while a negative value shows liquefication/subsidence. The vertical deformation in LOS ranged from − 67.66 to
74.68 mm/year. The surface of Karachi is stable in the western part. The research area has the highest evaluated
subsidence value of − 67.66 mm/year. The high subsidence areas are divided mainly Malir Colony, Radio Paki-
stan Colony, Sherpao Colony, Sector 7-A, and Sector 28, and parts of southern DHA Karachi Phase 4, and DHA
Karachi Phase VIII Zone area. Subsidence in Karachi takes place mainly in the newly urbanized areas.
Scientific Reports | (2022) 12:5294 | https://doi.org/10.1038/s41598-022-09359-7 8
Vol:.(1234567890)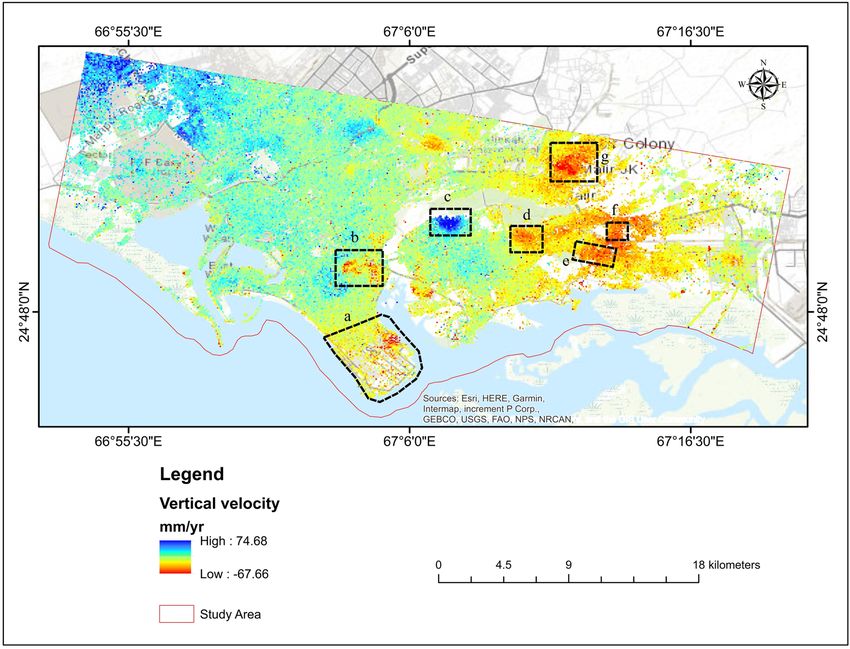
www.nature.com/scientificreports/
Figure 8. Land subsidence in the research area from the Ascending path (a, b, c, d) and Descending path (a, b,
c, d).
This research indicates that some variables influence and are accountable for ground subsidence in mega-
city Karachi, Pakistan. Groundwater extraction to meet human demands, natural consolidation of quaternary
alluvium, soil loss during wet seasons, infrastructure load, and unplanned building development are contribut-
ing causes.
The study area was divided into zones to understand better Karachi’s land deformation (Figs. 11 and 12). The
highest displacement observed is − 28.6 mm/year in DHA Karachi Phase VIII Zone B and − 27.7 mm/year in
DHA Karachi Phase 4. In the nearby river Malir on the west, which is composed of gravel used for construction
intents, the DHA Phase-VIII has bottom gravels whose concretion procedure is prolonged. As a result of the
compaction and consolidation of sediments deposited for urban development, the land begins to deform over
time. According to Khan et al.80, a columnar portion of depth up to 152.4 m in Karachi’s coastal region revealed
subsurface rocks constituted of clay and silty sand layers. Thus, the burden of large metropolitan constructions,
for instance, those in DHA-VIII, may place additional stress on the subsoil layers, resulting in increased defor-
mation and compaction of the surface along the coast. Sector 7-A is more stable than the rest of the study area,
with no subsidence. Sector 7-A is stable because there are no heavy construction activities. Sector 7-A has a
displacement of 25.3 mm/year. While Sector 28 remained stable, some points were deformed. During the study
period, sector 28 experienced the highest displacement of − 18.9 mm/year.
Due to large-scale water extraction, there was significant subsidence in Sherpao Colony, Radio Pakistan
Colony, and the Milar area (Fig. 12). Sherpao Colony, Radio Pakistan Colony, and Milar areas have displacement
rates of − 27.0 mm/year, − 31.7 mm/year, and − 30.9 mm/year, accordingly. One of the likely causes of subsidence
in the study area is groundwater extraction for domestic purposes. The highest displacement in the Sherpao
colony may result from industrial activities and heavy construction. These areas are home to the majority of the
population. Fast population growth has been observed in these areas in recent years due to educational institu-
tions such as military, medical, and engineering colleges.
Groundwater extraction. The authors consider water extraction the primary cause of subsidence, as stated
in9,12,81–83, with this phenomenon connected with soft clay soils in9,82,83. Seasonal impacts are identified in83,84,
possibly related to hydrogeological factors and variations in groundwater level. Extraction of Groundwater for
commercial and domestic purposes is one of the probable causes of subsidence in the study region62,85. Previous
Scientific Reports | (2022) 12:5294 | https://doi.org/10.1038/s41598-022-09359-7 9
Vol.:(0123456789)
www.nature.com/scientificreports/
Figure 9. PS points are selected in Ascending path (P1, P2, P3) and descending path (P4, P5, P6).
research has found that excessive groundwater causes ground liquefaction27,46,86–91. There is a water problem in
Pakistan, and bore-wells and tube-wells are the primary sources of daily water consumption for people92. Water
consumption has grown due to unplanned settlement expansion in major cities, and most households have built
a bore-well to meet their demands. In addition, numerous enterprises operated by private and public entities,
such as the agricultural and chemical sectors, are located in this city. These sectors, in instance, have significant
groundwater consumption requirements.
For the past three decades, Karachi has been plagued by a water supply and sanitation crisis. Dam and river
water, which the Karachi Water and Supply Board regulate, are the primary water supply sources for both the
industrial and domestic domains (KWSB). According to Khan et al.80, the gap between water demand and avail-
ability is growing by the day due to mismanagement, urban migration, and fast population growth in the research
region (Tables 2, 3). As a result, individuals prefer to extract groundwater on a big scale. This is causing a drop
in Karachi’s annual groundwater table, falling from 9 to 152 m93. Likewise, the level of water boreholes along the
margins of the Malir River was around 6–8 m between 1960 and 1980, but it has since grown to 12–18 m94. It is
concerning that, as time passes, every new well or bore must be drilled to a greater depth to extract groundwater
because the water table has been declining at a pace of 22.6 m/year since 1980 (Fig. 13)95.
Similar to prior r esearch80, this was seen during field visits for this investigation. As a result, we might claim
that large-scale groundwater abstraction in both industrial and residential zones has grown, which could be
one of the causes of land deformation in Karachi. This has resulted in a few incidences of building collapse in
the region (https://www.dawn.com/news/1539325), as illustrated in Fig. 14, where a whole street has begun to
slump owing to groundwater abstraction in a residential district of Liaquatabad known as Azizabad (Fig. 14c).
The mathematical model can quantify land subsidence that occurred due to groundwater depletion. Bear
et al.96 used the mathematical model for regional land subsidence due to pumping groundwater. Agarwal et al.97
depict the comparative study of groundwater-induced subsidence for London and Delhi Using PS-InSAR, which
is based on the mathematical model. Khorrmi et al.1 used the Piezometric data and found the extreme subsid-
ence in a populated city (Mashhad) detected by PS-InSAR considering groundwater withdrawal and geotechni-
cal properties. Despite the lack of GPS-based in-situ data for land subsidence in the study area, field research
and SAR-based assessment imply that land deformation in Karachi could be related to excessive groundwater
abstraction combined with seawater intrusion. The findings of this study are consistent with other studies under-
taken in various urban areas throughout the world to assess the association between groundwater and land
subsidence27,46,89–91,98.
Scientific Reports | (2022) 12:5294 | https://doi.org/10.1038/s41598-022-09359-7 10
Vol:.(1234567890)www.nature.com/scientificreports/
Figure 10. Vertical deformation (subsidence) in Karachi City presented on the google earth image.
Figure 11. Vertical displacement in Karachi, (a) DHA Karachi Phase VIII Zone B, (b) DHA Karachi Phase 4,
(c) Sector 7-A, (d) Sector 28.
Scientific Reports | (2022) 12:5294 | https://doi.org/10.1038/s41598-022-09359-7 11
Vol.:(0123456789)www.nature.com/scientificreports/
Figure 12. Vertical displacement in Karachi, (e) Sherpao Colony, (f) Radio Pakistan Colony, (g) Milar Areas.
Parameters Population
Total average available supply 550 MGD
Populationa 16.05 million
Demand 1100 MGD
Water requirement per capita 54 gallons
Current shortfall (demand–supply) 650 MGD
The average duration of water supply available 2–4 h/day
Water currently available per capita 25 gallons
Table 2. Overview of water usage, demand, and availability in Karachi (Modified after Ashir and K
halid84;
a
KWASB). Census, 2017, MGD: millions of gallons per day.
Parameters 2010 2015 2020 2025 Unit
Bulk water demand 741.1 903.8 1102.0 1300.3 MGD
Domestic consumption 272.6 362.3 497.3 655.3 MGD
Ratio of domestic consumption 60.4% 61.7% 63.2% 65.2% %
Non domestic consumption 178.8 225.1 289.1 349.5 MGD
Population 18 22 27 32 x millions
Table 3. Projections of future water demands based on KWSB study and Japan International Cooperation
Agency (JICA 2008).
Geological consideration. Soil consolidation qualities have been identified as a significant cause of sub-
sidence worldwide86. It has been found that the majority of the Karachi metropolis has formed on alluvium
deposits. The alluvium is generally made of sand, silty sand, sandy silt, deltaic, coastal, and eruptive mud deposits
lay69. The majority of the city, including institutions, the military school, and other
of recent age, with very little C
residential and commercial structures, is constructed above alluvium deposits.
Scientific Reports | (2022) 12:5294 | https://doi.org/10.1038/s41598-022-09359-7 12
Vol:.(1234567890)www.nature.com/scientificreports/
Figure 13. The trend of groundwater table in research area.
Figure 14. Land subsidence in different places of Karachi City. (a) Collapsed residential building at Rizvia
Society, (b) Another collapsed at located in Soomro Street near Timber Market, Karachi City, (c) collapse
residential building at Azizabad area, (d) Southern port city of Karachi.
There were no strong earthquakes documented in the research region throughout the inquiry period; how-
ever, movement along the Karachi arc’s active faults might cause surface deformation. However, it is crucial to
remember that earthquakes have had epicenters between the Hyderabad highway and the river Malir99. According
to the USGS Earthquake database, only four earthquakes were recorded between 1975 and 2021 within a 60-km
radius of Karachi, with magnitudes ranging from 4 to 5 Mw. Furthermore, urban expansion and ongoing geologic
activity (although in limited numbers) may exacerbate continuous land displacement in the region along the
active Malir river fault and neighboring locations100. According to the findings, liquefaction happened primarily
in quaternary alluvium layers (Fig. 15). It is probable that water precipitation into the subsurface, which perme-
ates the subsurface layers and infrastructure stress, is to cause subsidence in the studied region.
Scientific Reports | (2022) 12:5294 | https://doi.org/10.1038/s41598-022-09359-7 13
Vol.:(0123456789)www.nature.com/scientificreports/
Figure 15. Water on the roads in Karachi city during raining.
Additionally, the connection between rainfall and liquefaction has been documented in5,87, and excessive
precipitation disturbs the equilibrium of subsurface aquifers. This amount of precipitation, together with other
causal variables, might impact subsidence. The high monsoon precipitation in the research area has previously
been reported58,62. Subsurface aquifer refilling causes saturation of the subsurface layers, and a substantial asso-
ciation of subsidence in the study region with rainfall has previously been d ocumented58,62.
The above photographs (Fig. 15) were shot at various periods throughout the rainy season and showed flood-
ing at several spots along the primary route. This route runs through the city’s heart; subsidence can be observed
in Fig. 15 around the road (Fig. 15a). Figure 16 depicts the PS points overlay on a geological map of Karachi
City. The black polygons, in this case, emphasize the subsidence on different parts of the research area, which is
conspicuous in the Alluvium sediments. There were enough scatterers in the research region to estimate ground
liquefaction. The red dots show subsidence in the research region in the polygon.
Conclusions
PS-InSAR is a precise and accurate tool for monitoring urban structural collapse, ground subsidence, mining
subsidence, landslides, and so on. However, specific noise effects and decorrelations can impact the final result.
Meanwhile, our findings effectively indicated subsidence processes in the research region, although they may
be improved by in situ data analysis and other approaches like Quasi-PS or SBAS. We observed ground subsid-
ence in Karachi from November 2019 to December 2020 in this study, highlighting the capabilities of PS-InSAR
to monitor time-series subsidence. The primary process factors have been thoroughly described, and different
techniques to reduce noise and inaccuracies have been included throughout the processing. Various causal fac-
tors, such as subsurface geology, soil consolidation, groundwater extraction, and so on, have been studied. The
study area’s subsidence maps suggest that Karachi is undergoing rising land subsidence. The data also show that
subsidence is comparatively high in the city center, whereas it is significantly low in the eastern and western
areas of the research region.
According to the findings of this study, the cumulative deformation in LOS ranged from − 68.91 to 76.06 mm/
year. In contrast, the vertical deformation in LOS ranged from − 67.66 to 74.68 mm/year during the study period
(2019–2020). The most obvious reasons for this appear to be fast population expansion in recent years, coupled
with a rising need for daily-use water (industries and household) and groundwater extraction. Furthermore,
subsurface geology with inadequate outflow, systems, and unauthorized building loads are significant reasons
for ground subsidence in the studied region. Lastly, Geotechnical and well logs data are required to measure
the more accurate subsidence rate in the future. It is also recommended that multi-scale research be done in the
future to comprehensively examine ground subsidence and prevent significant harm in this area.
Scientific Reports | (2022) 12:5294 | https://doi.org/10.1038/s41598-022-09359-7 14
Vol:.(1234567890)www.nature.com/scientificreports/
Figure 16. Subsidence on Geological map.
Data availability
Sentinel-1 data were obtained from https://a sf.a laska.e du. The data presented in the study are available on request
from the first author and corresponding.
Received: 24 December 2021; Accepted: 22 March 2022
References
1. Khorrami, M., Abrishami, S., Maghsoudi, Y., Alizadeh, B. & Perissin, D. Extreme subsidence in a populated city (Mashhad)
detected by PSInSAR considering groundwater withdrawal and geotechnical properties. Sci. Rep. 10, 1–16 (2020).
2. Chen, G. et al. Detection of land subsidence associated with land creation and rapid urbanization in the Chinese loess plateau
using time series insar: A case study of Lanzhou new district. Remote Sensing 10, 270 (2018).
3. Yang, Q. et al. Multi-scale analysis of the relationship between land subsidence and buildings: A case study in an eastern Beijing
Urban Area using the PS-InSAR technique. Remote Sensing 10, 1006 (2018).
4. Seleem, T., Stergiopoulos, V., Kourkouli, P., Perrou, T. & Parcharidis, I. Active and Passive Microwave Remote Sensing for Envi-
ronmental Monitoring 104260E (International Society for Optics and Photonics, 2018).
5. Zhang, Y. et al. Monitoring land subsidence in Wuhan City (China) using the SBAS-InSAR method with radarsat-2 imagery
data. Sensors 19, 743 (2019).
6. Delgado Blasco, J. M., Foumelis, M., Stewart, C. & Hooper, A. Measuring urban subsidence in the Rome metropolitan area
(Italy) with Sentinel-1 SNAP-StaMPS persistent scatterer interferometry. Remote Sensing 11, 129 (2019).
7. Stanley, J.-D. & Clemente, P. L. Clay distributions, grain sizes, sediment thicknesses, and compaction rates to interpret subsid-
ence in Egypt’s northern Nile Delta. J. Coastal Res. 30, 88–101 (2014).
8. Chaussard, E., Wdowinski, S., Cabral-Cano, E. & Amelung, F. Land subsidence in central Mexico detected by ALOS InSAR
time-series. Remote Sens. Environ. 140, 94–106 (2014).
9. Osmanoğlu, B., Dixon, T. H., Wdowinski, S., Cabral-Cano, E. & Jiang, Y. Mexico City subsidence observed with persistent scat-
terer InSAR. Int. J. Appl. Earth Observ. Geoinform. 13, 1–12 (2011).
10. Stanley, J.-D. Growth faults, a distinct carbonate-siliciclastic interface and recent coastal evolution, NW Nile Delta, Egypt. J.
Coast. Res. 1, 309–318 (2005).
11. Cavalié, O., Sladen, A. & Kelner, M. Detailed quantification of delta subsidence, compaction and interaction with man-made
structures: The case of the NCA airport, France. Nat. Hazards Earth Syst. Sci. 15, 1973–1984 (2015).
12. Heleno, S. I. et al. Persistent scatterers interferometry detects and measures ground subsidence in Lisbon. Remote Sens. Environ.
115, 2152–2167 (2011).
13. Malinowska, A. & Hejmanowski, R. Building damage risk assessment on mining terrains in Poland with GIS application. Int. J.
Rock Mech. Mining Sci. 47, 238–245 (2010).
Scientific Reports | (2022) 12:5294 | https://doi.org/10.1038/s41598-022-09359-7 15
Vol.:(0123456789)www.nature.com/scientificreports/
14. Arangio, S. et al. An application of the SBAS-DInSAR technique for the assessment of structural damage in the city of Rome.
Structu. Infrastruct. Eng. 10, 1469–1483 (2014).
15. Shahzad, N., Ding, X., Wu, S. & Liang, H. Ground deformation and its causes in Abbottabad City, Pakistan from sentinel-1a
data and mt-insar. Remote Sensing 12, 3442 (2020).
16. Yu, X., Hu, J. & Sun, Q. Estimating actual 2D ground deformations induced by underground activities with cross-heading InSAR
measurements. J. Sensors 2017, 12 (2017).
17. Tosi, L., Teatini, P. & Strozzi, T. Natural versus anthropogenic subsidence of Venice. Sci. Rep. 3, 1–9 (2013).
18. Rattan, M., Sidhu, G., Singh, S. K. & Singh, S. K. History of land use in the Indo Gangetic Plains, India and its impact on popula-
tion: A review. Plant Arch. 21, 532–537 (2021).
19. Döll, P. et al. Impact of water withdrawals from groundwater and surface water on continental water storage variations. J. Geodyn.
59, 143–156 (2012).
20. Konikow, L. F. Contribution of global groundwater depletion since 1900 to sea‐level rise. Geophys. Res. Lett. 38, 17 (2011).
21. Wada, Y. et al. Global depletion of groundwater resources. Geophys. Res. Lett. 37, 20 (2010).
22. Fishman, R. M., Siegfried, T., Raj, P., Modi, V. & Lall, U. Over‐extraction from shallow bedrock versus deep alluvial aquifers:
Reliability versus sustainability considerations for India’s groundwater irrigation. Water Resources Res. 47, 6 (2011).
23. Aeschbach-Hertig, W. & Gleeson, T. Regional strategies for the accelerating global problem of groundwater depletion. Nat.
Geosci. 5, 853–861 (2012).
24. Giordano, M. Global groundwater? Issues and solutions. Annu. Rev. Environ. Resources 34, 153–178 (2009).
25. Bilham, R. et al. Seismic hazard in Karachi, Pakistan: Uncertain past, uncertain future. Seismol. Res. Lett. 78, 601–613 (2007).
26. Fattahi, H., Amelung, F., Chaussard, E. & Wdowinski, S. Coseismic and postseismic deformation due to the 2007 M5. 5 Ghaza-
band fault earthquake, Balochistan, Pakistan. Geophys. Res. Lett. 42, 3305–3312 (2015).
27. Khan, A. S., Khan, S. D. & Kakar, D. M. Land subsidence and declining water resources in Quetta Valley, Pakistan. Environ.
Earth Sci. 70, 2719–2727 (2013).
28. Syvitski, J. P. et al. Sinking deltas due to human activities. Nat. Geosci. 2, 681–686 (2009).
29. Khan, A. N. & Shaw, R. Disaster Risk Reduction Approaches in Pakistan (Springer, 2015).
30. Chaussard, E., Amelung, F., Abidin, H. & Hong, S.-H. Sinking cities in Indonesia: ALOS PALSAR detects rapid subsidence due
to groundwater and gas extraction. Remote Sens. Environ. 128, 150–161 (2013).
31. Liu, G. et al. Detecting subsidence in coastal areas by ultrashort-baseline TCPInSAR on the time series of high-resolution
TerraSAR-X images. IEEE Trans. Geosci. Remote Sensing 52, 1911–1923 (2013).
32. Wang, H. et al. InSAR reveals coastal subsidence in the Pearl River Delta, China. Geophys. J. Int. 191, 1119–1128 (2012).
33. Shi, X., Liao, M., Li, M., Zhang, L. & Cunningham, C. Wide-area landslide deformation mapping with multi-path ALOS PALSAR
data stacks: A case study of Three Gorges Area, China. Remote Sensing 8, 136 (2016).
34. Hussain, M. A., Chen, Z., Wang, R. & Shoaib, M. PS-InSAR-based validated landslide susceptibility mapping along Karakorum
Highway, Pakistan. Remote Sensing 13, 4129 (2021).
35. Lanari, R. et al. An overview of the small baseline subset algorithm: A DInSAR technique for surface deformation analysis.
Deform. Gravity Change Indicators Isostasy Tectonics Volcanism Clim. Change 164, 637–661 (2007).
36. Cigna, F. & Tapete, D. Sentinel-1 BigData processing with P-SBAS InSAR in the geohazards exploitation platform: An experi-
ment on coastal land subsidence and landslides in Italy. Remote Sensing 13, 885 (2021).
37. Ferretti, A., Prati, C. & Rocca, F. Permanent scatterers in SAR interferometry. IEEE Trans. Geosci. Remote Sensing 39, 8–20
(2001).
38. Kampes, B. & Adam, N. The STUN algorithm for persistent scatterer interferometry. Proc. FRINGE 610, 1–14 (2005).
39. Zhang, Y., Zhang, J., Wu, H., Lu, Z. & Guangtong, S. Monitoring of urban subsidence with SAR interferometric point target
analysis: A case study in Suzhou, China. Int. J. Appl. Earth Observ. Geoinform. 13, 812–818 (2011).
40. Hamling, I. J. et al. Complex multifault rupture during the 2016 Mw 7.8 Kaikōura earthquake, New Zealand. Science 356, 6334
(2017).
41. Ferretti, A., Prati, C. & Rocca, F. Permanent scatterers in SAR interferometry. IEEE Trans. Geosci. Remote Sensing 39, 8–20
(2001).
42. Liu, G. et al. Exploration of subsidence estimation by persistent scatterer InSAR on time series of high resolution TerraSAR-X
images. IEEE J. Selected Topics Appl. Earth Observ. Remote Sensing 4, 159–170 (2010).
43. Gernhardt, S. & Bamler, R. Deformation monitoring of single buildings using meter-resolution SAR data in PSI. ISPRS J. Pho-
togram. Remote Sensing 73, 68–79 (2012).
44. Fornaro, G., Reale, D. & Verde, S. Bridge thermal dilation monitoring with millimeter sensitivity via multidimensional SAR
imaging. IEEE Geosci. Remote Sensing Lett. 10, 677–681 (2012).
45. Sousa, J. & Bastos, L. Multi-temporal SAR interferometry reveals acceleration of bridge sinking before collapse. Nat. Hazards
Earth Syst. Sci. 13, 659–667 (2013).
46. Cigna, F. et al. Monitoring land subsidence and its induced geological hazard with Synthetic Aperture Radar Interferometry: A
case study in Morelia, Mexico. Remote Sensing Environ. 117, 146–161 (2012).
47. Chen, B. et al. Spatial correlation between land subsidence and urbanization in Beijing, China. Nat. Hazards 75, 2637–2652
(2015).
48. Bozzano, F. et al. Understanding the subsidence process of a quaternary plain by combining geological and hydrogeological
modelling with satellite InSAR data: The Acque Albule Plain case study. Remote Sens. Environ. 168, 219–238 (2015).
49. Zhang, Y. et al. Detection of geohazards in the Bailong River Basin using synthetic aperture radar interferometry. Landslides 13,
1273–1284 (2016).
50. Zhou, C. et al. InSAR time-series analysis of land subsidence under different land use types in the Eastern Beijing Plain, China.
Remote Sensing 9, 380 (2017).
51. Berardino, P., Fornaro, G., Lanari, R. & Sansosti, E. A new algorithm for surface deformation monitoring based on small baseline
differential SAR interferograms. IEEE Trans. Geosci. Remote Sensing 40, 2375–2383 (2002).
52. Hooper, A. A multi‐temporal InSAR method incorporating both persistent scatterer and small baseline approaches. Geophys.
Res. Lett. 35, 16 (2008).
53. Ferretti, A. et al. A new algorithm for processing interferometric data-stacks: SqueeSAR. IEEE Trans. Geosci. Remote Sensing
49, 3460–3470 (2011).
54. Yan, Y. et al. Mexico City subsidence measured by InSAR time series: Joint analysis using PS and SBAS approaches. IEEE J.
Selected Topics Appl. Earth Observ. Remote Sensing 5, 1312–1326 (2012).
55. Hooper, A., Bekaert, D., Spaans, K. & Arıkan, M. Recent advances in SAR interferometry time series analysis for measuring
crustal deformation. Tectonophysics 514, 1–13 (2012).
56. Nolesini, T., Frodella, W., Bianchini, S. & Casagli, N. Detecting slope and urban potential unstable areas by means of multi-
platform remote sensing techniques: The Volterra (Italy) case study. Remote Sensing 8, 746 (2016).
57. Waqas, M., Nazeer, M., Shahzad, M. I. & Zia, I. Spatial and temporal variability of open-ocean barrier islands along the Indus
Delta region. Remote Sensing 11, 437 (2019).
58. Kanwal, S., Ding, X. & Zhang, L. in IGARSS 2018–2018 IEEE International Geoscience and Remote Sensing Symposium. 1395–1398
(IEEE).
Scientific Reports | (2022) 12:5294 | https://doi.org/10.1038/s41598-022-09359-7 16
Vol:.(1234567890)www.nature.com/scientificreports/
59. Ali, M., Shahzad, M. I., Nazeer, M., Mahmood, I. & Zia, I. Estimation of surface deformation due to Pasni earthquake using
RADAR interferometry. Geocarto Int. 36, 1–16 (2019).
60. Zia, I., Zafar, H., Shahzad, M. I., Meraj, M. & Kazmi, J. H. Assessment of sea water inundation along Daboo Creek area in Indus
Delta Region, Pakistan. J. Ocean Univ. China 16, 1055–1060 (2017).
61. Nazeer, M., Waqas, M., Shahzad, M. I., Zia, I. & Wu, W. Coastline vulnerability assessment through landsat and cubesats in a
coastal mega city. Remote Sensing 12, 749 (2020).
62. Amin, G., Shahzad, M. I., Jaweria, S. & Zia, I. Measuring land deformation in a mega city Karachi–Pakistan with sentinel SAR
interferometry. Geocarto Int. 36, 1–15 (2021).
63. Klemm, H., Quseimi, I., Novali, F., Ferretti, A. & Tamburini, A. Monitoring horizontal and vertical surface deformation over a
hydrocarbon reservoir by PSInSAR. First Break 28, 5 (2010).
64. Pepe, A. & Calò, F. A review of interferometric synthetic aperture RADAR (InSAR) multi-track approaches for the retrieval of
Earth’s surface displacements. Appl. Sci. 7, 1264 (2017).
65. Zhou, C. et al. Reduced rate of land subsidence since 2016 in Beijing, China: Evidence from Tomo-PSInSAR using RadarSAT-2
and Sentinel-1 datasets. Int. J. Remote Sens. 41, 1259–1285 (2020).
66. Duan, W. et al. in 2019 SAR in Big Data Era (BIGSARDATA). 1–4 (IEEE).
67. Hernandez-Marin, M. et al. Ongoing research on the pumping-induced land deformation in the Aguascalientes Valley: An
analysis of the recent data of vertical deformation, groundwater level variations and local seismicity. Proc. Int. Assoc. Hydrol.
Sci. 382, 99–102 (2020).
68. Farooq, M., Malik, M. A., Hussain, A. & Abbasi, H. N. Multivariate statistical approach for the assessment of salinity in the
periphery of Karachi, Pakistan. World Appl. Sci. J. 11, 379–387 (2010).
69. Mohsin, S., Hamid, G., Siddiqui, E. & Zubair, A. Engineering properties of soil layers of Karachi. Pakistan J. Sci. Ind. Res. 38,
384–390 (1995).
70. Mora, O., Mallorqui, J. J. & Broquetas, A. Linear and nonlinear terrain deformation maps from a reduced set of interferometric
SAR images. IEEE Trans. Geosci. Remote Sensing 41, 2243–2253 (2003).
71. Crosetto, M., Devanthéry, N., Cuevas-González, M., Monserrat, O. & Crippa, B. Exploitation of the full potential of PSI data for
subsidence monitoring. Proc. Int. Assoc. Hydrol. Sci. 372, 311–314 (2015).
72. Torres, R. et al. GMES Sentinel-1 mission. Remote Sens. Environ. 120, 9–24 (2012).
73. Yagüe-Martínez, N. et al. Interferometric processing of Sentinel-1 TOPS data. IEEE Trans. Geosci. Remote Sensing 54, 2220–2234
(2016).
74. Beladam, O., Balz, T., Mohamadi, B. & Abdalhak, M. Using ps-insar with sentinel-1 images for deformation monitoring in
northeast Algeria. Geosciences 9, 315 (2019).
75. Hanssen, R. F. Radar Interferometry: Data Interpretation and Error Analysis Vol. 2 (Springer Science & Business Media, 2001).
76. Qin, Y. & Perissin, D. Monitoring ground subsidence in Hong Kong via spaceborne Radar: Experiments and validation. Remote
Sensing 7, 10715–10736 (2015).
77. Ferretti, A., Prati, C. & Rocca, F. Nonlinear subsidence rate estimation using permanent scatterers in differential SAR interfer-
ometry. IEEE Trans. Geosci. Remote Sensing 38, 2202–2212 (2000).
78. Fárová, K., Jelének, J., Kopačková-Strnadová, V. & Kycl, P. Comparing DInSAR and PSI techniques employed to Sentinel-1 data
to monitor highway stability: A case study of a massive Dobkovičky landslide, Czech Republic. Remote Sensing 11, 2670 (2019).
79. Perissin, D. Multitemporal Remote Sensing 145–176 (Springer, 2016).
80. Khan, A. & EghbalBakhtiari, A. Groundwater assessment of coastal aquifers in Karachi: Impact of seawater intrusion. Int. J.
Ground Sediment. Water 6, 248 (2017).
81. Zhao, Q., Lin, H., Jiang, L., Chen, F. & Cheng, S. A study of ground deformation in the Guangzhou urban area with persistent
scatterer interferometry. Sensors 9, 503–518 (2009).
82. Ge, D., Wang, Y., Zhang, L., Li, M. & Guo, X. in 2013 IEEE International Geoscience and Remote Sensing Symposium-IGARSS.
4034–4037 (IEEE).
83. Jo, M.-J., Won, J.-S. & Kim, S.-W. in 2011 3rd International Asia-Pacific Conference on Synthetic Aperture Radar (APSAR). 1–3
(IEEE).
84. Wang, S., Gong, H., Du, Z., Ren, Y. & Gu, Z. in 2011 19th International Conference on Geoinformatics. 1–4 (IEEE).
85. Galloway, D. L. & Burbey, T. J. Regional land subsidence accompanying groundwater extraction. Hydrogeol. J. 19, 1459–1486
(2011).
86. Holzer, T. L. & Johnson, A. I. Land subsidence caused by ground water withdrawal in urban areas. GeoJournal 11, 245–255
(1985).
87. Khan, R. et al. Monitoring subsidence in urban area by PSInSAR: A case study of Abbottabad City, Northern Pakistan. Remote
Sensing 13, 1651 (2021).
88. Abidin, H., Gumilar, I., Andreas, H., Sidiq, P. & Fukuda, Y. Study on causes and impacts of land subsidence in Bandung Basin,
Indonesia. FIG Working Week Bridging the Gap between Cultures Marrakech, Morocco, 18–22 (2011).
89. Huang, J. et al. Study of subsidence and earthquake swarms in the Western Pakistan. Remote Sensing 8, 956 (2016).
90. Castellazzi, P. et al. Quantitative mapping of groundwater depletion at the water management scale using a combined GRACE/
InSAR approach. Remote Sens. Environ. 205, 408–418 (2018).
91. Da Lio, C., Teatini, P., Strozzi, T. & Tosi, L. Understanding land subsidence in salt marshes of the Venice Lagoon from SAR
Interferometry and ground-based investigations. Remote Sens. Environ. 205, 56–70 (2018).
92. Meribole, J. J. B. M. & The Borgen Project: Seattle, W., USA. The Water Crisis in Pakistan. (2020).
93. Irfan, M., Kazmi, S. J. H. & Arsalan, M. H. Sustainable harnessing of the surface water resources for Karachi: A geographic
review. Arab. J. Geosci. 11, 1–11 (2018).
94. Khattak, M. I. & Khattak, M. I. Ground water analysis of Karachi with reference to adverse effect on human health and its
comparison with other cities of Pakistan. J. Environ. Sci. Water Resources 2, 410–418 (2013).
95. Khan, A., Raza, S. A., Fatima, A. & Haider, S. W. Assessment of groundwater quality in coastal region a case study of Qayyuma-
bad, Karachi, Pakistan. Asian Rev. Environ. Earth Sci. 7, 9–17 (2020).
96. Bear, J. & Corapcioglu, M. Y. Mathematical model for regional land subsidence due to pumping: 2. Integrated aquifer subsidence
equations for vertical and horizontal displacements. Water Resources Res. 17, 947–958 (1981).
97. Agarwal, V. et al. Comparative study of groundwater-induced subsidence for London and Delhi using PSInSAR. Remote Sensing
13, 4741 (2021).
98. Abidin, H., Gumilar, I., Andreas, H., Sidiq, P. & Fukuda, Y. Study on causes and impacts of land subsidence in Bandung Basin,
Indonesia. In: FIG Working Week Bridging the Gap between Cultures Marrakech, Morocco, 18–22 May, 18–22 (2011).
99. Sarwar, G. & Alizai, A. Riding the mobile Karachi arc, Pakistan: Understanding tectonic threats. J. Himalayan Earth Sci. 46, 2
(2013).
100. Nabi, A. et al. Episodic uplift along a quaternary fault, a signature of active deformation in frontal part of Karachi Arc, Southern
Pakistan. Int. J. Econ. Environ. Geol. 3, 6–12 (2018).
Scientific Reports | (2022) 12:5294 | https://doi.org/10.1038/s41598-022-09359-7 17
Vol.:(0123456789)You can also read