Soil Sealing and Hydrological Changes during the Development of the University Campus of Elche (Spain) - MDPI
←
→
Page content transcription
If your browser does not render page correctly, please read the page content below
International Journal of
               Environmental Research
               and Public Health

Article
Soil Sealing and Hydrological Changes during the
Development of the University Campus of Elche (Spain)
Manon Navarro-Leblond, Ignacio Meléndez-Pastor, Jose Navarro-Pedreño *                                  and Ignacio Gómez Lucas

                                            Department of Agrochemistry and Environment, University Miguel Hernández of Elche, Avenida de la
                                            Universidad de Elche s/n, Edificio Alcudia, 03202 Elche, Spain; manon.navarro@alu.umh.es (M.N.-L.);
                                            imelendez@umh.es (I.M.-P.); ignacio.gomez@umh.es (I.G.L.)
                                            * Correspondence: jonavar@umh.es

                                            Abstract: The University Miguel Hernández of Elche was created in 1996 and its headquarters is
                                            located in the city of Elche. A new campus was developed where new buildings and infrastructures
                                            have been established for over 25 years in the north of the city. The university is growing, and the
                                            land cover/land use is changing, adapted to the new infrastructures. In fact, the landscape changed
                                            from a periurban agricultural area mixed with other activities into an urbanized area integrated
                                            into the city. The purpose of this work was to evaluate the progressive sealing of the soil and the
                                            consequences on the surface hydrology. The area is close to the Palmeral of Elche, a landscape of
                                  date palm groves with an ancient irrigation system, which is a World Heritage Cultural Landscape
                                     recognized by UNESCO. The evolution of the land occupation was analyzed based on the Aerial
Citation: Navarro-Leblond, M.;              National Orthophotography Plan (PNOA). Soil sealing and the modifications of the hydrological
Meléndez-Pastor, I.; Navarro-               ancient irrigation system were detected. Based on the results, proposals for improvement are made
Pedreño, J.; Gómez Lucas, I. Soil           in order to implement green infrastructures and landscape recovery that can alleviate the possible
Sealing and Hydrological Changes            negative effects of the soil sealing in the area occupied by the university.
during the Development of the
University Campus of Elche (Spain).         Keywords: green infrastructure; irrigation system; land changes; soil sealing; urbanization
Int. J. Environ. Res. Public Health 2021,
18, 9511. https://doi.org/10.3390/
ijerph18189511

                                            1. Introduction
Academic Editors: Alejandro
Luis Grindlay Moreno and María
                                                 Soil formation is considered a very slow process that results in a complex and dynamic
Isabel Rodríguez Rojas                      system with continuously changing properties [1]. Soil acts as a producer, filter-buffer,
                                            carrier, resource, habitat, and cultural heritage, and a number of crucial functions have been
Received: 24 August 2021                    recognized to be environmentally, economically, and socially important [2–5]. However,
Accepted: 7 September 2021                  since the emergence of the first settlements the soil has been widely transformed and
Published: 9 September 2021                 degraded by anthropogenic activities [6]. According to the FAO’s key results [7], globally,
                                            about 33% of the land surface is already degraded and over 90% could become degraded
Publisher’s Note: MDPI stays neutral        by 2050.
with regard to jurisdictional claims in          Land changes reflect socioeconomic development and political decisions across time,
published maps and institutional affil-     becoming a relevant factor in understanding the dynamics of the relation between soil
iations.                                    functions and land use/land cover (LULC). It is commonly accepted to define land use
                                            as urban landscapes (e.g., industrial, residential areas, etc.) that link land cover to human
                                            activities, and land cover as land-use components (e.g., vegetation, concrete, etc.) that
                                            represent the biophysical conditions of the earth [8]. Over the past century, several factors,
Copyright: © 2021 by the authors.           such as better living standards, greater disposable incomes, or climatic amenities, have
Licensee MDPI, Basel, Switzerland.          driven to rapid land-cover changes along Euro-Mediterranean coastal areas [9,10]. In the
This article is an open access article      Valencian Community, agricultural landscapes have been extremely modified by urbaniza-
distributed under the terms and             tion processes and soil degradation has been identified as the main threat [11,12]. Land
conditions of the Creative Commons          degradation implies a progressive loss of soil functionality that diminishes its capacity
Attribution (CC BY) license (https://       to provide goods and services, including biological, hydrological, social, and economic
creativecommons.org/licenses/by/            services [13]. In this context, soil sealing is the most intense form of land-take or land con-
4.0/).

Int. J. Environ. Res. Public Health 2021, 18, 9511. https://doi.org/10.3390/ijerph18189511                     https://www.mdpi.com/journal/ijerph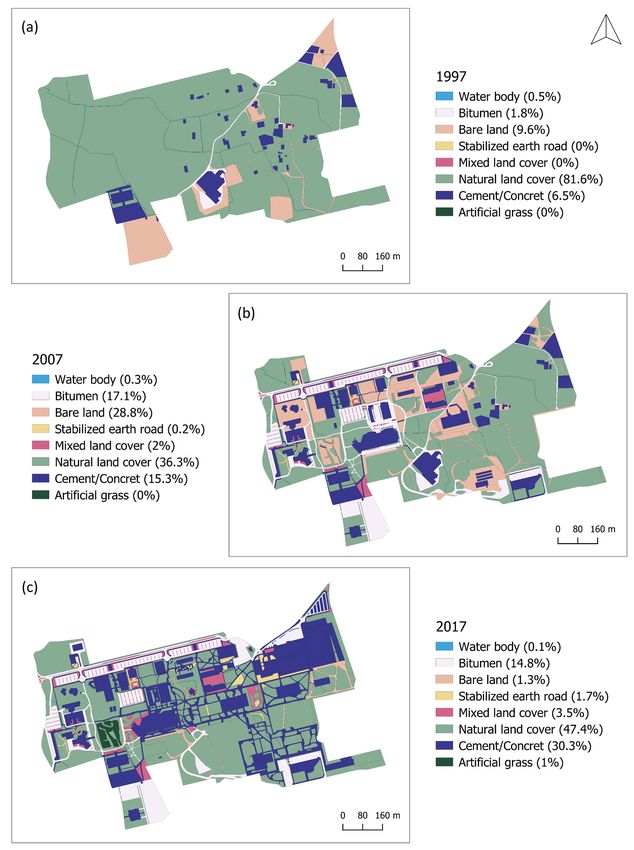
Int. J. Environ. Res. Public Health 2021, 18, 9511                                                                              2 of 19

                                        sumption and can be defined as the permanent covering of land by completely or partially
                                        impermeable artificial material (e.g., asphalt, concrete, metal, glass, and plastic) [3,14].
                                              As soil sealing is related to a change in land cover and its associated properties over
                                        time [15], the exchange and transformation of the energy and matter of each land-cover unit
                                        can be analyzed [16] (e.g., urban climate, hydrology, energy demands for space heating, and
                                        carbon dioxide emissions). The extent of impervious surfaces involves severe consequences
                                        to the biological, hydrological, and atmospheric compartments [17], for instance, the
                                        (i) loss of infiltration and baseflow; (ii) increase in runoff rates, volumes, and response to
                                        rainfall; (iii) air and water pollution; (iv) habitat fragmentation and loss of biodiversity;
                                        (v) greenhouse gas emissions through interruption of carbon sink; and (vi) the urban heat
                                        island effect from the decrease in radiation absorption [2,17–20]. In addition, soil sealing
                                        may have a great impact on neighboring ecosystems by changing water pathways and
                                        exposing unsealed soils to pollution [2]. Nowadays, the negative effects of urban sprawl
                                        are fully recognized by the European Union, where, on the average, around 9% of the
                                        surface is covered with impermeable material [21].
                                              Extensive work related to the change in runoff characteristics has been carried out
                                        at urban scales ranging from water quality research [8,22,23] to runoff spatial–temporal
                                        variations [19,24,25]. For example, in the impervious surface of a roundabout located on the
                                        campus of the Polytechnic University of Valencia, the results of Andrés-Doménech et al. [26]
                                        showed high event mean concentrations (EMCs) for suspended solids, organic matter
                                        (COD, BOD), nutrients, and metals under Mediterranean climate conditions, exceeding,
                                        on average, the maximum acceptable value fixed in the European Directive 91/271/ECC
                                        for TSS and the environmental quality standards (EQS) set out in the European Directive
                                        2008/105/CE for Cu, Ni and Pb. Pollutant first-flush, considered as “the disproportionate
                                        discharge of either higher pollutant concentrations or load in the initial part of a runoff
                                        event relative to its latter part” [23], has been identified as an important phenomenon that
                                        causes detrimental impacts on the quality of receiving bodies [27]. With climate change
                                        predicted to increase rainfall intensities and extreme events [28,29], water body quality
                                        preservation must be a priority, especially in semiarid areas where water availability is
                                        already scarce. In addition, a deep understanding of hydrological behavior in urban
                                        Mediterranean environments is necessary to develop planning strategies that improve
                                        resilience to these events.
                                              To better represent the temporal and spatial variability of small-scale rainfall–runoff
                                        processes, detailed temporal and spatial information on land cover and hydrological
                                        parameters are required [8]. Land-cover classification provides input variables for a wide
                                        variety of environmental models (e.g., land change, habitat and biodiversity, ecosystem
                                        services, earth trends, climate change adaptation, hydrological response, etc.) [15,30]. With
                                        the computational capabilities and the availability and accessibility of digital spatial data,
                                        the Geographic Information System (GIS) and remote sensing (RS) have become versatile
                                        tools in decision support systems, which can be applied in a combination of hydrological
                                        models to analyze the impacts of urbanization on flood behavior [15]. However, a large
                                        number of input parameters are necessary to measure and predict rainfall excess with
                                        high levels of precision in watershed models such as the Storm Water Management Model
                                        (SWMM) or the Hydrologic Modeling System developed by the Hydrologic Engineering
                                        Center (HEC-HMS) [31].
                                              Consequently, empirical methods are more effective for estimating runoff volumes
                                        when data are not available or under semiarid and Mediterranean environments [24]. The
                                        most common example of this type of approach is probably the Soil Conservation Service
                                        Curve Number (SCS-CN) method, which has been applied worldwide to assess the effects
                                        of land cover change on surface runoff [32,33], given its automaticity and simplicity. In
                                        Spain, it was adapted by Témez [34] and constitutes the basis of the Standard 5.2-IC of
                                        road surface drainage.
                                              In the last two decades, an increasing number of universities have started to improve
                                        their own sustainability strategies in order to reduce their campuses’ environmental im-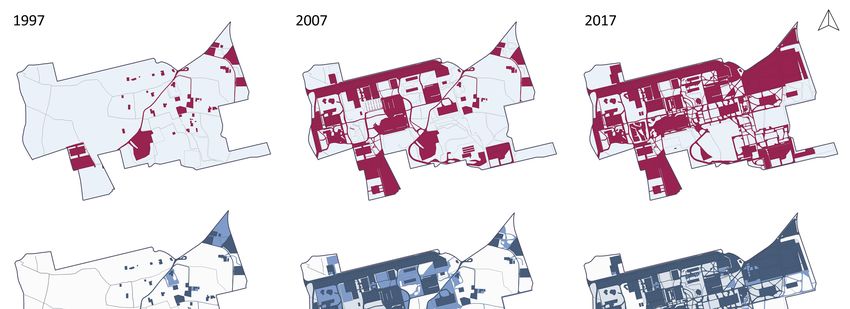
Int. J. Environ. Res. Public Health 2021, 18, x FOR PEER REVIEW 3 of 20
Int. J. Environ. Res. Public Health 2021, 18, 9511 3 of 19
In the last two decades, an increasing number of universities have started to improve
their own sustainability strategies in order to reduce their campuses´ environmental im-
pact [35]. Amaral et al. [36] carried out a review of the implemented actions and initiatives
pact [35]. Amaral et al. [36] carried out a review of the implemented actions and initiatives
on university campuses as reported in scientific publications, showing that the largest in-
on university campuses as reported in scientific publications, showing that the largest
itiatives were aimed at building improvements, while only 6% of the cases included hy-
initiatives were aimed at building improvements, while only 6% of the cases included
drological projects (wastewater treatment and rainwater harvesting for irrigation of green
hydrological projects (wastewater treatment and rainwater harvesting for irrigation of
spaces). Against this backdrop, this paper contributes to the literature by exploring the
green spaces). Against this backdrop, this paper contributes to the literature by exploring
impacts of soil sealing on surface runoff on the headquarter campus of the University
the impacts of soil sealing on surface runoff on the headquarter campus of the University
Miguel Hernández of Elche (UMH), by accounting for land-cover changes throughout its
Miguel Hernández of Elche (UMH), by accounting for land-cover changes throughout
development (1997–2017). To this end, the surface cover classification was carried out
its development (1997–2017). To this end, the surface cover classification was carried out
from manual photointerpretation of high-resolution aerial images. Then, two periods
from manual photointerpretation of high-resolution aerial images. Then, two periods
were analyzed
were analyzed (1997–2007
(1997–2007 and and 2007–2017)
2007–2017) to
to assess
assessland-cover
land-coverchanges.
changes. Finally,
Finally, runoff
runoff
production was estimated under three development scenarios for the university
production was estimated under three development scenarios for the university campus campus
of Elche,
of Elche, expecting
expecting toto set
set aa precedent
precedent for
for developing
developing integrated
integrated water
water management
management prac-
prac-
tices that allow rainwater collection, treatment, storage, and reuse, for example,
tices that allow rainwater collection, treatment, storage, and reuse, for example, by using by using
sustainable and
sustainable and holistic
holistic approaches
approacheslikelikeBest
BestManagement
ManagementPractices
Practices(BMPs),
(BMPs),Low
LowImpact
Impact
Developments (LIDs) or Sustainable Urban Drainage Systems
Developments (LIDs) or Sustainable Urban Drainage Systems (SUDS). (SUDS).
2. Materials
2. Materials andand Methods
Methods
2.1.
2.1. The
The Study
Study Aarea
Aarea
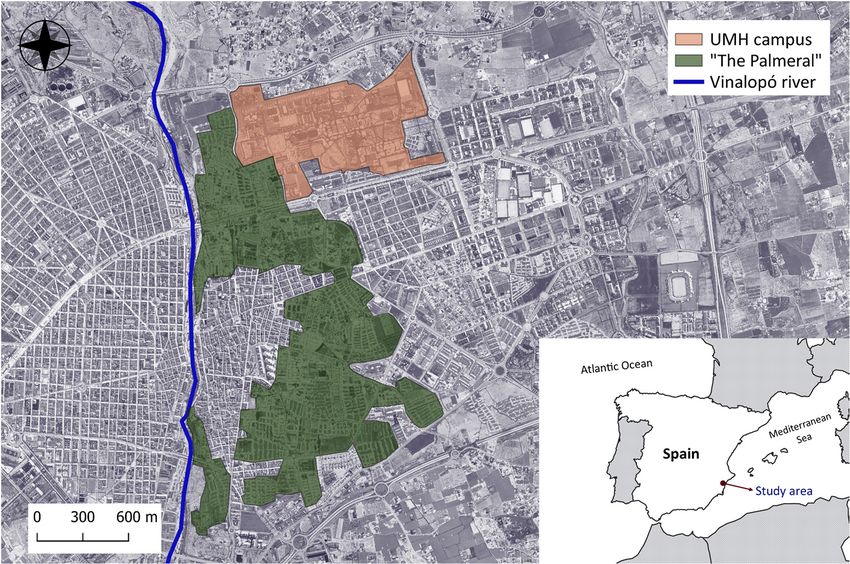
The
TheUMHUMHcampus
campusisislocated
locatedininSESESpain,
Spain,ininthethe
Mediterranean
Mediterranean citycity
of Elche (Figure
of Elche 1).
(Figure
The study
1). The areaarea
study extends
extendsover 68.868.8
over ha and
ha andrises at an
rises altitude
at an range
altitude range of 88–100
of 88–100mm close to to
close a
historical
a historicalagricultural
agricultural landscape
landscapeofofgreat
greatcultural
culturalvalue
valueincluded
includedin inthe
theUNESCO-World
UNESCO-World
Heritage
Heritage List
List since
since 2000
2000 (nº
(nº 930):
930): the
the Palmeral
Palmeral of of Elche.
Elche. This
This is
is aa landscape
landscape of of groves
grovesofof
date palms associated with an old agricultural irrigation system, historically
date palms associated with an old agricultural irrigation system, historically documented documented
since
since at
at least
least the
the 10th
10th century
century AD ADand andconsidered
consideredaaremarkable
remarkableexample
exampleof ofsustainable
sustainable
water
water management [37]. Four ancient irrigation channels cross in the campusarea
management [37]. Four ancient irrigation channels cross in the campus areaused
usedtoto
provide
providewater
waterforforseveral
severalirrigated
irrigatedparts
partsof ofthe
themunicipality.
municipality.
Figure1.
Figure 1. Study
Study area
area location.
location.
Elche
Elche is
is characterized
characterized byby aasemi-arid
semi-aridMediterranean
Mediterranean climate
climate with
withmild
mildwinters
wintersandand
dry
dryand
andhot
hotsummers.
summers. TheThe
average annual
average precipitation
annual and mean
precipitation and temperature are around
mean temperature are
289 mm289andmm ◦ C, respectively [38]. Additionally, three reasons make this region
17.6and
around 17.6 °C, respectively [38]. Additionally, three reasons make this re-
extremely vulnerable
gion extremely [39,40]:[39,40]:
vulnerable (1) Water
(1)demand in semi-arid
Water demand areas cannot
in semi-arid becannot
areas fully supplied
be fully
by conventional water resources, even considering wastewater reuse and desalination;
(2) Total annual precipitation has been reduced by up to 15% in the last three decades in
Alicante, and water availability is expected to continue to decline by 2050, which increases
Int. J. Environ. Res. Public Health 2021, 18, 9511 4 of 19
pressure on water resources; and (3) Rainfall occurs mainly in autumn, when intense
rainfall and flash floods are more frequent. Consequently, it may cause considerable
damage and incur great costs (e.g., September 2019 in Vega Baja del Segura, region south
of the province of Alicante).
Considering the projection of drier conditions and under the uncertainty of high
rainfall event occurrences in the future [39,41], the campus of Elche became a suitable case
study to assess on a small scale the impact of land-cover changes on surface runoff and to
propose conservation measures to move toward greater water self-sufficiency and reduce
soil sealing.
2.2. Land-Cover Mapping
In this work, a time series of aerial images compiled between 1997 and 2017 was
used to create a database of chronological land cover maps, of which three specific years
were used to assess the dynamics of land cover on the campus: 1997, 2007, and 2017.
Cartographic data required for the mapping of the study area was obtained from the
National Geographic Institute (IGN) [42], where two types of images were available: first,
aerial photos from the Five-Year flight 1998–2003, from which year 1999 was selected.
The spatial resolution for this image was 1 m. Second, orthophotos were selected from
the olive cultivation (GIS-OLISTAT), the Geographic Information System of Agricultural
Parcels (SIGPAC), and the National Plan of Aerial Photography (PNOA). Orthophotos were
obtained for the years 1997, 2002, 2005, 2007, 2009, 2012, 2014, and 2017 at spatial resolutions
of 1, 0.5, 0.5, 0.5, 0.25, 0.5, 0.25, and 0.25 m, respectively. Georeferencing was carried out for
the year 1999 by using the free and open-source geographic information system QGIS [43].
Also, official cartography related to the campus boundaries and hydraulic infrastructure
was provided by the UMH Infrastructure Service.
Each aerial photograph was digitized by visual interpretation using a land-cover
classification subjectively decided. Additionally, in the last year (2017), a field validation
survey was accomplished. Surface classes established are shown in Table 1, where bitumen,
cement, and concrete surfaces, stabilized earth roads, artificial grass, and mixed land covers
were defined as soil sealed. Several nomenclatures have been reported in urban scales.
For example, Rio et al. [8] used two levels for land-cover classification in terms of water
quantity and quality modeling (Level 1: Hydrological Response Units; Level 2: Water
Int. J.
Int. J. Environ.
Environ. Res.
Res. Public
Public Health
Health 2021, 18,
Quality
2021, 18, xx FOR
FOR PEER
Response PEER REVIEW
Units),
REVIEWwhile in Zhao et al. [44], categories were defined to assess their 55 of
of 20
20
thermal contributions.
Table 1. Descriptions of the urban land-cover classes in the study.
Table 1.
Table 1. Descriptions
Descriptions of
of the
the urban
urban land-cover
land-cover classes
classes in
in the
the study.
study.
Land Cover
Land Cover Descriptions
Descriptions Imagesfrom
Images from the
the Campus
Campus
Land Cover Descriptions Images from the Campus
Bitumen
BitumenBitumen Road networksand
Road networks
Road networks and
and parking
parking areas
areas
parking areas
Cement/Concrete
Cement/Concrete
Cement/Concrete Pedestrian
Pedestrian networks
Pedestrian networks
networks and
and buildings
buildings
and buildings
Artificial grass
Artificial grass Golf course
Golf course
Pavement composed
Pavement composed of
of aggregates,
aggregates,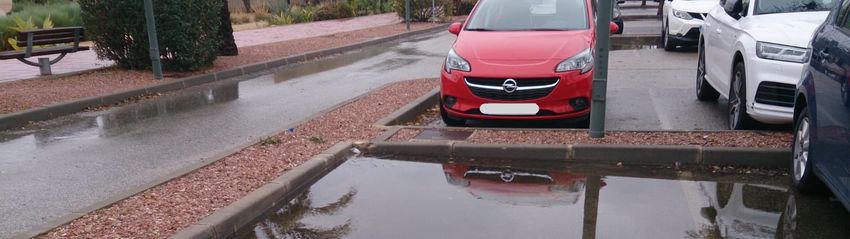
Bitumen Road networks and parking areas
Bitumen
Bitumen Road
Road networks and parking areas
Bitumen Road networks
networks and
and parking
parking areas
areas
Int. J. Environ. Res. Public Health 2021, 18, 9511 5 of 19
Cement/Concrete Pedestrian networks and buildings
Cement/Concrete
Cement/Concrete Pedestrian
Pedestrian networks
networks and
and buildings
Cement/Concrete Pedestrian
Table 1.networks
Cont. and buildings
buildings
Land Cover Descriptions Images from the Campus
Artificial grass Golf course
ArtificialArtificial
grass
Artificial grass
grass Golf
Golf course
Golfcourse
course
Artificial grass Golf course
Pavement composed of aggregates,
Pavement
Pavement composed
composed of
of aggregates,
Stabilized earth road binder, and
Pavement water that
composed ofisaggregates,
generally
aggregates,
Stabilized earth road
Stabilized earth binder,
Pavement composed and water that
of aggregates, is generally
binder, and water that is
Stabilized
Stabilized earth road
earth road road binder,
foundand
binder, and water
water that
in pedestrian is
is generally
that networks
generally
found
generally
found in
foundpedestrian
in networks
pedestrian networks
found in
in pedestrian
pedestrian networks
networks
Land covered by a mix of materials
Land
Land covered
covered by
by a mix of materials
that
Landcan be found
covered by aainmix of
of materials
nature
mix (gravel,
materials
that
that can
can be
be found
found in
in nature
nature (gravel,
(gravel,
sand,
thatby
Land covered vegetation,
can be found
a mix wood, etc.)
in nature
of materials and
that can artifi-
(gravel,
be found in
sand,
sand, vegetation,
vegetation, wood,
wood, etc.)
etc.) and
and artifi-
artifi-
Mixed land cover cial synthetic
sand,
nature (gravel, vegetation, materials
sand, vegetation,wood, obtained
etc.)
wood, andand
etc.) byartificial
artifi-
Mixed
Mixed land
land cover cial
cial synthetic
cover synthetic materials synthetic materials
materials obtained
obtained by
by
Mixed landMixedcover
land cover man
cial obtained
through
synthetic by manand
physical
materials through physical
chemical
obtained by and
man
chemical processes
man through
(e.g.,
through physical
geotextile
physical and chemical
membranes)
and chemical associated
processes
man through (e.g.,physical
geotextile andmembranes)
chemical
processes
processes (e.g.,
with
(e.g., geotextile
dry gardens membranes)
processes (e.g., geotextile
associated membranes)
with dry gardens
geotextile membranes)
associated with dry gardens
Landassociated
covered bywith
associated dry
dry gardens
materials
with that can be
gardens
Land
Land covered
covered by
by materials
materials that
that can
can be
foundcovered
Land in nature by(gravel,
materials sand, can be
thatvegeta- be
found
found in
in nature
nature (gravel, sand, vegeta-
Land covered
tion,
found by
wood, etc.) (gravel,
inmaterials
nature that cansand,
associated
(gravel, be with
sand,foundvegeta-
in nature
green
vegeta-
Natural land cover (gravel, sand, tion,
tion, wood,
vegetation,
wood, etc.) associated
wood, with
etc.) associated green
with green
Natural Natural
land cover land cover urban
tion, areasetc.)
wood, withassociated
fully grown with green
vegeta-
Natural
Natural land
land cover
cover urban areas with
urban fullyetc.)
areas grown
with
associated
vegetation
fully grown
with green trees,
(including
vegeta-
urban
tion
urban areas
areas with
(including
with fully
trees,
fully grown
shrubs,
grown vegeta-
and
shrubs,
tion and
(including grass)
trees,and cropsvegeta-
shrubs,
tion (including
tion (including
grass) andtrees,
trees, shrubs, and
crops
shrubs, and
and
grass)
grass) and
and crops
crops
Lands that are notand
grass) covered
cropsand suscep-
Lands
Lands that
that are
are not
not covered
covered and
and suscep-
suscep-
tible to
Lands erosion
that are notprocesses
covered and
and loss of
suscep-
Lands that
tibleare
tonot covered
erosion and susceptible
processes and to erosion
loss of
tible
tible to
structure erosion
to loss due
erosion toprocesses
compaction,
processes and loss
loss of
water-
processes and
structure of structure
due to due and
compaction, to compaction,
water-
of
Bare land Bare land structure
proofing,
structure
waterproofing, etc., due
etc.,
due to
to
generallycompaction,
generally
compaction,
land land
under water-
under
water-
construction,
Int. J. Environ. Res. Bare
Public land
Health 2021, 18, x FOR PEER REVIEW etc., generally land under
proofing, 6 of 20
Bare
Bare land
land proofing,
vacant lands, dirt roads,
construction,
proofing, etc.,
andgenerally
green
vacant
etc., lands,
generally land
urban
land under
areas
dirt with grow
roads,
under
construction,
construction, stagevacant lands,
vegetation
vacant lands, dirt
dirt roads,
roads,
and green urban areas with
construction, vacant lands, dirt roads, grow stage
and
and green urban areas with grow stage
and green
green urban
urban areas
areas with
vegetation with grow
grow stage
stage
vegetation
vegetation
vegetation
Ditches, swimming
Ditches, swimming pools, ponds,pools, ponds,
reservoirs, andres-
any other
Water body
Water body
ervoirs, and any other open water
open water
Gain (Gj) Equation (1), loss (Lij) equiation (2), net change (Cn) equiation (3), and swap
Although many different vegetation classifications are identified in rural catchments,
(Sj) Equation (4), can be calculated as follows [45]:
in this case only crops and density of vegetation in urban green areas were considered
= − process,
to estimate the initial abstraction in the rainfall–runoff , which may include trees, (1)
shrubs, and grass.
Land-cover change detection was performed with the TerrSet software developed by
= ( )− , (2)
ClarkLabs [30]. For this purpose, digitized polygons were converted to raster format and
two periods were analyzed: 1997–2007 and 2007–2017. As a result, each cross-tabulation
matrix was examined to assess the net change, = persistence,
− , swap, gain, and loss of land (3)
categories between time 1 and time 2 following the Pontius et al. [45] approach. Categories
from time 1 and time 2 configure the rows = 2(P·i ) and the, columns (Pj ), respectively, of the (4)
transition matrix, which ends with an additional column (Pi+ ) and row (P+j ) to denote the
where P+j represents the total area of category j in time 2; Pi+ is the total area of category i
in time 1, and Pjj denotes the persistence.
2.3. Surface Runoff Estimation
2.3.1. The SCS-CN Method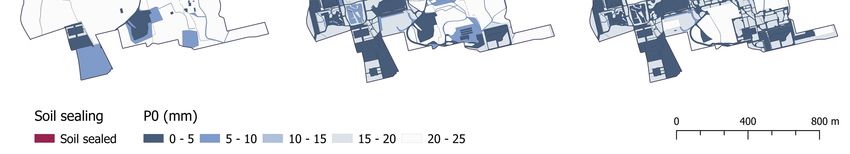
Int. J. Environ. Res. Public Health 2021, 18, 9511                                                                                 6 of 19

                                        total surface for each category in time 1 and time 2. The diagonal entries indicate the total
                                        amount of surface that remained constant during the time interval considered, while the
                                        rest of the cells reflect the surface that changed to another category.
                                               Gain (Gj ) Equation (1), loss (Lij ) Equation (2), net change (Cn ) Equation (3), and swap
                                        (Sj ) Equation (4), can be calculated as follows [45]:

                                                                              Gj = P+ j − Pjj ,                                       (1)

                                                                              Lij = ( Pi+ ) − Pjj ,                                   (2)
                                                                               Cn = P+ j − Pi+ ,                                      (3)

                                                                             S j = 2· MI N Lij , Gj                                   (4)
                                        where P+j represents the total area of category j in time 2; Pi + is the total area of category i
                                        in time 1, and Pjj denotes the persistence.

                                        2.3. Surface Runoff Estimation
                                        2.3.1. The SCS-CN Method
                                             Surface runoff was estimated using the empirical Soil Conservation Service Curve
                                        Number (SCS-CN) method, which was developed in 1972 by the Soil Conservation Service
                                        (SCS) and recently integrated into several hydrological models, such as SWMM, HEC-HMS,
                                        or the Soil and Water Assessment Tool (SWAT). Two parameters are mainly considered
                                        in this method: precipitation (P) and initial abstraction (Ia or P0 ). The initial abstraction
                                        is assumed to be a function of the potential maximum soil moisture retention (S) and
                                        represents the threshold from which runoff begins. Estimating P0 is not easy, however it
                                        can be expressed as (Equation (5)):
                                                                                  P0 = λ·S                                          (5)
                                        where λ denotes the initial abstraction ratio that is assumed to be constant (λ = 0.2 in this
                                        study).
                                            There is a dimensionless characteristic numbered curve (CN) related to each soil-cover
                                        complex ranging from 0 to 100 that reflects its hydrological behavior and runoff potential.
                                        Equation (6) shows the transformation of CN to S (in mm):

                                                                                     25,400
                                                                               S=           − 254                                     (6)
                                                                                      CN
                                             Tabulated P0 and CN values are provided by the Spanish Standard 5.2-IC of surface
                                        drainage [46] and the National Engineering Handbook Hydrology (NEH) of the NRCS [47],
                                        respectively. P0 and CN equivalence is shown in Equation (7).

                                                                                     5080
                                                                              P0 =        − 50.8.                                     (7)
                                                                                     CN
                                              Then, direct runoff (channel runoff, surface runoff, and subsurface flow in unknown
                                        proportions) for a given precipitation event and assuming λ = 0.2 can be calculated as
                                        fo-llows (Equation (8)):
                                                                             E=0         for P ≤ P0
                                                                              ( P− P0 )2                                       (8)
                                                                         E = ( P+4P ) for P > P0
                                                                                      0

                                        where E denotes the depth of runoff in mm, P represents the depth of rainfall in mm and
                                        P0 is the initial abstraction in mm. Lower P0 values (or higher CN values) indicate that the
                                        surface has a higher potential for runoff production.
                                              Both, P0 and CN, are mainly determined by land cover type, slope, degree of previous
                                        soil moisture (AMC), and hydrologic soil group (HSG). According to the infiltration capaci-
                                        ties of soils, four HSGs (A, B, C, and D) are distinguished, from sandier (A) to more clayey
Int. J. Environ. Res. Public Health 2021, 18, 9511 7 of 19
textures (D). Furthermore, three types of AMC are defined in the SCS-CN method: I (dry
conditions), II (average conditions), and III (wetter conditions).
2.3.2. Initial P0 , HSG, and Weighted P0 in the Area Study
The allocation of HSGs remains one of the major uncertainties of this method [48],
especially in semi-arid areas. Thus, in the present study, the proposal of Camarasa et al. [24],
which considers lithological, geomorphological, and soil factors, was selected and com-
pared with the HSG map derived from the Standard 5.2-IC of surface drainage. As a result,
HSG C was assumed for the campus area, which is sited on alluvial plains of Quaternary
sediments (gravels, sands, and clayey silts) [49] and is characterized by the presence of
haplocalcids [50].
Initial P0 and CN values for each land cover classification are shown in Table 2.
Ta-bulated P0 values were selected for an average slope of the campus less of than 3%,
which was calculated from a digital elevation model with a cell size of 5 m [42], and the
transformation of CN into P0 was carried out with Equation (7). These values assume an
AMC II that can be considered standard when the Procedure is not applied to real rainfall
events [51], as in the current case. However, the Standard 5.2-IC provides a corrector
coefficient based on the area location and return period that will be applied.
Table 2. Initial P0 and CN values for each land-cover type in the study area for AMC II. Equivalence to P0 for CN values
after applying Equation (7) is indicated in parentheses.
Initial P0 (mm) Initial CN Land Cover
0 Water body
1 Bitumen, cement, and concrete
96 (2.1) Artificial grass, mixed land cover (dry gardens)
87 (7.6) Bare land (dirt road)
8 Bare land (land under construction)
86 (8.3) Bare land (green urban areas with grow stage vegetation: vegetation cover < 50%)
74 (17.8) Natural land cover (green urban areas with fully grown vegetation: vegetation cover > 75%)
22 Natural land cover (crops *)
Note: P0 and CN values were assigned according to the lookup tables of the Spanish Standard 5.2-IC and the NEH of the NRCS. * Historical
crop types were obtained through the Spanish Geographic Information System of Agrarian Data (SIGA). The P0 value is associated to a
“Mosaic of annual crops with permanent irrigated crops”.
For a watershed having more than one hydrologic soil-cover complex, a weighted P0
value can be estimated if the area of each land cover is known [51]:
P0i (w) = ∑ Si · P0 (i) (9)
i
where Pi 0 (w) is the initial weighted P0 ; Si is the fraction of surface cover; and P0 (i) is the
initial P0 of the surface cover i. In the study area, a weighted P0 value was calculated for
the entire campus to analyze the potential for surface runoff production during the campus
development.
To estimate surface runoff volumes, three daily rain events (42.4, 62.4, and 78 mm),
which are considered representative of the area location for return periods of two, five and
ten years, respectively, were calculated by using the “Máximas Lluvias Diarias en la España
Peninsular” method [52]. because of the nature of rainfall in the study area, maximum
daily precipitations were considered appropriate to assess the maximum surface runoff
that would be produced in extreme events. To consider the regional factor of previous soil
moisture, a corrector coefficient of initial abstraction is provided by the Standard 5.2-IC to
watershed calibration (Equations (10) and (11)).
P0 (w) = P0i (w)· β PM , (10)
β PM = β m · FT (11)Int. J. Environ. Res. Public Health 2021, 18, 9511 8 of 19
where βm represents the average of the corrector coefficient of initial abstraction in the
study area location (dimensionless) (βm = 2.1 in Elche); and FT is a dimensionless coefficient
function of a return period T (for the present study: FT = 0.67, 0.86, and 1 for T = 2, 5, and
10 years, respectively).
2.3.3. Proposed Scenarios and P0 Values Associated
The SCS-CN method was applied to three different scenarios to assess changes in
runoff along the development of the campus and determine the hydrological response if
better soil conservation practices had been employed. For that, impervious surfaces of roof
tops were replaced by green roofs, and parking lots, roads, and pedestrian networks by
permeable pavements. The aim was to establish how the surface runoff produced would
differ with changes in surface cover types. The following scenarios were applied to the
three daily rain events defined in the previous section (42.4, 62.4, and 78 mm):
Scenario 1. Conditions before campus development (1997). It is estimated that the
surface is almost unaltered.
Scenario 2. Conditions after campus development (2017).
Scenario 3. Conditions after campus development (2017) with: (a) sedum roofs
installed on 95% of the building area (3373.65 m2 of green roofs in the entire campus); and
(b) permeable paving replacing the current impervious surface of parking lots, roads, and
pedestrian networks (22.81 ha of the whole campus). As green roofs represented a small
portion of the study area, runoff was computed considering both proposals together.
P0 values for each surface cover type were assigned as indicated in Section 2.3.2 and
additional curve numbers were found in earlier research for Scenario 3. For permeable
paving like porous asphalt or concrete, studies in North Carolina have shown CN values
from 45 to ~85, depending on the base depth and underlying soil composition [53]; however,
this study followed the recommendation of the NC Cooperative Extension of a range from
75 to 80 [54]. A CN value of 80 (P0 = 12.7 mm) was chosen for HSG C in the study area.
For green roofs, many CN values have been reported in the literature in different climatic
regions with considerable variations. For example, CN values ranging 93-98 for vegetated
and bare green roofs were recorded in [55], while Getter et al. [20] derived CN values of
84, 87, 89, and 90 for green roofs with 2, 7, 15, and 25% slope gradient, respectively. In the
present study, to ensure good drainage, a CN value of 87 for sedum roofs was established
for a fixed slope of 7% [20].
3. Results
3.1. Spatiotemporal Land-Cover Changes Analysis
Maps from 1997, 2007, and 2017 (Figure 2) were compared to produce a cross-
tabulation matrix showing the amount of surface that changed within each category. The
approach of Pontius et al. [45] allowed us to answer a few increasingly detailed questions,
from analyzing the net change for each category to knowing the distance at which the
change occurred. In the present study, net change, gain, loss, and land swap of each
category were analyzed.3.1. Spatiotemporal Land-Cover Changes Analysis
Maps from 1997, 2007, and 2017 (Figure 2) were compared to produce a cross-tabu
lation matrix showing the amount of surface that changed within each category. The ap
proach of Pontius et al. [45] allowed us to answer a few increasingly detailed questions
Int. J. Environ. Res. Public Health 2021, 18, 9511 from analyzing the net change for each category to knowing the distance at19which the
9 of
change occurred. In the present study, net change, gain, loss, and land swap of each cate
gory were analyzed.
2. Maps
Figure Figure 2. of the of
Maps land
thecover of theofUMH
land cover campus
the UMH in (a)in1997;
campus (b) 2007;
(a) 1997; (c) 2017.
(b) 2007; (c) 2017.
Change indicators for the first (1997–2007) and second (2007–2017) periods are shown
in Table 3 and in the chord diagram displaying the interrelations (Figure 3), where it can be
seen that from 1997 to 2007, 63.16 ha (54.13%) of the campus surface remained constant.
Hence, the total change was 31.58 ha (45.87%), of which 22.03 ha (32%) belonged to net
change and 9.54 ha (13.86%) were swaps.Int. J. Environ. Res. Public Health 2021, 18, 9511 10 of 19
Table 3. Land-cover changes in terms of percent of the campus surface where 1st is 1997–2007; 2nd is 2007–2017.
Persistence Gain Loss Total Change Net Change Swap
Land Cover
1st 2nd 1st 2nd 1st 2nd 1st 2nd 1st 2nd 1st 2nd
Bitumen 1.67 12.04 14.71 2.76 0.11 4.34 14.82 7.09 14.61 1.58 0.21 5.51
Cement/Concrete 5.61 13.78 10.92 16.51 0.90 2.76 11.82 19.27 10.03 13.75 1.79 5.51
Stabilized earth road 0 0.36 0.36 1.29 0 0 0.36 1.29 0.36 1.29 0 0
Natural land cover 44.8 34.82 4.94 12.60 36.73 15.01 41.68 27.61 31.78 2.41 9.89 25.20
Mixed land cover 0 2.38 2.51 1.08 0 0.13 2.51 1.21 2.51 0.95 0 0.26
Int. J. Environ.
BareRes.
landPublic Health 2021, 18, 0.37
1.79 x FOR PEER REVIEW
12.34 0.94 7.84 13.77 20.19 14.71 4.50 12.82 15.69 11 of1.88
20
Water body 0.17 0.11 0.07 0 0.29 0.13 0.35 0.13 0.22 0.13 0.13 0
Artificial grass 0 0 0 0.96 0 0 0 0.96 0 0.96 0 0
Total 54.13 63.86 45.87 36.14 45.87 36.14 45.87 36.14 32.00 16.95 13.86 19.18
a b
Figure 3. Chord
Figure diagram
3. Chord diagramshowing
showing thethe
major interrelations
major interrelationsandand
changes between
changes 1997–2007
between (a) (a)
1997–2007 andand
2007–2017 (b).(b).
2007–2017 LandLand
cover abbreviations
cover used
abbreviations in the
used diagram:
in the Bare:
diagram: bare
Bare: soil;
bare CC:CC:
soil; cement/concrete; Bit: Bit:
cement/concrete; bitumen; ML:ML:
bitumen; mixed landland
mixed cover; NL:NL:
cover;
natural land
natural cover.
land Years:
cover. 97 97
Years: (1997), 07 07
(1997), (2007), 17 17
(2007), (2017).
(2017).
3.2. Impact of Land-Cover
Natural Changes
land covers fromonmosaics
Surface Runoff
of annual crops with permanent irrigated crops
3.2.1. Soil Sealed and Initial P0 Values in theaverage
experienced the largest net loss, with an of 21.88 ha (31.78%). On the other hand,
Study Area
the development of car parks, roads, pedestrian networks, and buildings resulted in major
From the chronological land-cover maps, it was possible to assess the whole campus
net gains to bitumen, cemented/concreted surfaces, and bare lands (14.61, 10.03, and
development process and its impact on the potential for runoff production, as shown in
4.5%, respectively). Mixed land covers and earthen pavement were first introduced in
Figure 4a. A clear difference in the proportion of soil sealed between 1997 and 2017 was
small proportions into dry gardens and pedestrian networks, replacing natural covers,
observed, a period in which the campus area experienced an average annual change rate
cemented or concreted surfaces, and irrigation channels. Throughout this first stage of the
of 10.6%, until, in the last year, the soil sealed accounted for more than a half of the total
construction, it was observed that changes in bitumen, cement and concrete, stabilized
area. In consequence, the initial weighted P0 value for the entire campus, set at 18.79 mm
earth road, and mixed land cover were nearly pure net changes; changes in bare lands from
for 1997, dropped to 11.87 mm in 2007 and 9.86 mm in 2017, exhibiting a rising trend in
areas under construction were almost pure swap-types of change, and changes in natural
runoff production for any precipitation event. From 1997 to 2017, Pi0 values remained sta-
land covers and water bodies consisted of both types of change. On the whole campus
ble in 18.79% of the whole area, while 72.56% of the surface recorded a higher potential
surface, net change was larger than change attributable to swap, and most of the change
for runoff production, which was mainly associated with impervious covers.
was associated with natural land covers in part because of the fact that it was the largest
Conversely,
category in 1997only
anda 2007.
small proportion of the campus (8.65%) improved its infiltration
capacityInbecause of the removal of old buildings
the second period, a 63.86% (43.97 ha)and asphalted roads.
of persistence Figure 4bfor
was registered illustrates
the entire
these changes for each stage of development: 1997–2007 (west sector) and 2007–2017
campus. Therefore, the total change was 24.88 ha (36.14%), of which 11.67 ha (16.95%) (east
sector). Smaller increases in P0 were observed during the second period, even though the
belonged to net change and 13.21 ha (19.18%) were swaps. Bare lands experienced the
increases in sealed surfaces between both phases were similar. Replacement of cemented
and concreted surfaces for less impervious covers in construction practices could explain
some of these changes, for example, the use of stabilized earth pavements in pedestrian
networks around the sport facilities. Besides, land use must be considered, since in the
first period larger surfaces were allocated for parking and buildings, responding to a greatInt. J. Environ. Res. Public Health 2021, 18, 9511 11 of 19
largest net loss, with an average of 8.83 ha (12.82%), transforming mainly into revegetated
areas in urban green spaces. Least significance losses (6
1
7.40
4
5.56
10
4.19
0.88
2
0 0
1997 1999 2002 2005 2007 2009 2012 2014 2017
Int. J. Environ. Res. Public Health 2021, 18, 9511 12 of 19
Soil sealed Initial weighted P0
Soil sealed Potential runoff production
(a) (b)
and concreted surfaces for less impervious covers in construction practices could explain
Figure 4. Illustration of (a) some of theseofchanges,
the evolution forand
soil sealing example, the use of
initial weighted P0 stabilized earth1997
values between pavements
and 2017;in
(b)pedestrian
the
networks
percent of surface that experienced around
changes thesealed
in soil sportand
facilities.
P0 valuesBesides, land
(a decrease use must
in potential be considered,
runoff since in the
production means
an increase in P0 value, and first
vice versa).
period larger surfaces were allocated for parking and buildings, responding to a great
social demand. Then, more urban green areas and dry gardens occupied the east sector.
The
The spatial
spatialdistribution
distributionofofPP0 0values
valuesisisshown
shownininFigure
Figure5,5,where
wherebetween
between 1997
1997 and
and
2017, a 28% reduction was detected for P ranging from 20 to 25 mm, and at
2017, a 28% reduction was detected for P0 ranging from 20 to 25 mm, and at the same time,
0 the same time,
increases
increasesof of42
42and
and28%
28%were
wererecorded
recordedinin ranges
rangesof of
0–5 and
0–5 and15–20 mm,
15–20 mm,respectively. As aAs
respectively.
result, the study area shows a mosaic of covers, which is mainly characterized
a result, the study area shows a mosaic of covers, which is mainly characterized by P 0 by P i0 val- i
ues lower
values thanthan
lower 5 mm thatthat
5 mm willwill
contribute to generate
contribute greater
to generate depths
greater of runoff.
depths of runoff.
Spatial variability
Figure 5. Spatial variability of
of soil
soilsealed
sealedand initialPP0 0values
andinitial valuesbetween
between1997
1997and
and2017.
2017.
3.2.2. Weighted P0 Values and Surface Runoff Estimation for Different Scenarios
The initial weighted P0 for modeling Scenarios 1, 2, and 3 was 18.79, 9.86, and
13.83 mm, respectively. From initial weighted P0 values, corrector coefficients were ap-
plied to each return period and runoff volumes were estimated using the SCS-CN method.
As expected, for each return period, the highest runoff depth was calculated for the de-
veloped campus (Scenario 2), since the weighted P0 values were the lowest; while the
runoff generated for the pre-developed situation (Scenario 1) recorded the smaller values
(Table 4). Furthermore, it was found that replacing impervious surfaces on the campus
(Scenario 3) reduced significantly maximum runoff volumes that could be incorporated
into the rainwater drainage network. If LID practices had been implemented at the be-
ginning of the construction process, maybe smaller dimensions for the current rainwater
drainage system would have been required, which would have meant economic savings.
These infrastructures act as first pollutant filters, which would have allowed an increase in
potential for store and reused the exceeded infiltered water for future uses, such as garden
irrigation. For the return period of 2 years, 5723.018 m3 was estimated for Scenario 2, while
in Scenario 3, the runoff volume was 3013.430 m3 . This means that a 47% reduction was
achieved with surface cover replacing. Rather, for the 5- and 10-year return periods, the
reduction was 42 and 39.5%, respectively. As a result, we determined that the difference in
runoff volumes tended to decrease as the return period rose from 2 to 10 years.Int. J. Environ. Res. Public Health 2021, 18, 9511 13 of 19
Table 4. Weighted P0 values (P0 (w)) and surface runoff depth (E) generated on the university campus for each scenario and
maximum daily precipitations of 42.4 mm (T = 2), 62.4 mm (T = 5), and 78 mm (T = 10).
Scenario 1 Scenario 2 Scenario 3
T (Years)
P0 (w) (mm) E (mm) P0 (w) (mm) E (mm) P0 (w) (mm) E (mm)
2 26.44 1.72 13.87 8.31 19.46 4.38
5 33.93 4.09 17.81 14.88 24.98 8.63
10 39.46 6.30 20.71 20.41 29.04 12.34
4. Discussion
4.1. Impact of the UMH Campus Development on Surface Runoff Production
Land-cover changes have direct and indirect impacts on hydrological cycle. Analyzing
urban surfaces as urban units with their own energy and matter exchanges can allow us
to understand the effect that each surface transformation has on the water balance and
anticipate future environmental issues. At that point, urban units need to be defined
and classified.
The construction of the university campus arose in the context of socioeconomic
transition, where energy, agricultural, livestock and fishing sectors decreased notably,
giving way to powerful construction activity and a growing development of the tertiary
sector [56]. This resulted in the need to provide new services like shopping centers, schools,
or universities. Such transformation is manifested in the loss of high productive soils [57]
and leads to a deterioration of soil ecosystem services by fragmentation of traditional
agricultural landscapes, such as the agroecosystem of the Palmeral of Elche. Comparison
of maps from 1997–2007 and 2007–2017 made possible the detection of the progressive
increase in soil sealing in the study area, where periurban agricultural landscapes were
transformed into urban landscapes. In fact, around 50% of the entire surface was identified
as sealed soil in 2017, increasing from 5.7 ha in 1997 to 35.2 ha in 2017. The sealing of
the campus was mainly due to the construction of buildings, parking areas, roads, and
pedestrian networks, which are related to the use of impervious materials such as bitumen,
concrete, and cement. However, in the second period, more earthen pavements were
introduced in pedestrian networks, which indicated a change in campus management. In
addition, access to vehicles was restricted when pedestrian transects replaced numerous
road networks, a decision that, intentionally or not, could limit pollutant deposition on
surfaces and their subsequent wash-off with stormwater runoff.
Cities development responds to specific needs and consumption patterns that are
closely linked to urban water quality and quantity problems [58]. The first step to reduce
water deterioration is to understand how the natural water balance is disturbed. Larger
impervious surfaces decrease the infiltration rate of rainwater and reduce the soil’s capacity
to hold water [59]; this intuitively leads us to deduce that greater runoff will be generated.
At the local level, variables such as soil type, morphology, and climate remain con-
stant, and changes in hydrological response between scenarios rely on differences in land
covers [60]. This study determined theoretically that, by modifying the land´s natural
conditions (Scenario 1), potential runoff production increased 47.5% by decreasing ini-
tial weighted P0 values from 18.79 mm (1997) to 9.86 mm (2017). A similar proportion
of soil sealed and weighted CN values have been detected in low-density residential
areas [16,19]. Hydrological response depends on surface cover complex properties, but
also on the duration and intensity of the precipitation [18]. The SCS-CN method cannot
estimate accurate runoff values for low rainfall depths or time resolutions smaller than
24 h duration [61]. Nevertheless, a first approximation can be made by comparing two
maximum daily rainfall events representatives of the area (42.4 and 62.4 mm), observing
the greatest rainfall amount increases of 8.7 (1997), 35.7 (2007), and 50.3% (2017) in surface
proportion where surface runoff was higher than 40 mm. This was particularly interesting,
since it showed that the proportion of impervious surfaces in the campus played a key
role in the runoff depth generated under higher intensity precipitations. Despite the factInt. J. Environ. Res. Public Health 2021, 18, 9511 14 of 19
that a continuous simulation approach would be a better representation for modeling
scenarios under different ranges of duration and intensity of precipitation, there was a lack
of information to characterize the watershed in 1997, so empirical methods were thought to
be more appropriate in this case. However, we expect to use continuous models in future
studies to evaluate specific soil and water conservation practices on the current campus.
As alternatives to mitigate surface runoff increase, nature-based solutions have been
implemented around the world as a transition to more sustainable and holistic approaches
to stormwater management [26]. Low Impact Development (LID) systems and practices
such as bioretention cells, rain gardens, green roofs, and permeable pavements increase
surface runoff volumes retention and are able to maintain or restore the original hydrologic
cycle and its ecological functions in semi-arid urban areas [59,62]. As a first approximation
of how the campus would have responded if green roofs and permeable pavements had
been considered in the development processes, Scenario 3 was evaluated. From the results
of this scenario, it was possible to confirm that replacing some impervious surfaces on
the university campus could reduce the surface runoff generated in extreme precipitation
events associated with 2-, 5-, and 10-year return periods by up to 40%. Such types of
LID practices have not been implemented yet in the campus area; thus, some proposals
and considerations were made to encourage managers to invest in future field research
to move to better water and soil conservation measures. In semi-arid climates, designing
practices require different considerations. For instance, harvested rainwater should be
stored in closed containers because of high evaporation rates, and pollutant concentrations
are larger because of the low frequency of storm events; therefore, greater capture volumes
are needed for first-flush treatment [63]. On the other hand, plants should be native and
drought-tolerant, but also able to tolerate inundation [63]. As examples of successful cases,
permeable pavements, rain gardens, bioswales, green roofs, and bioretention ponds have
been implemented in the semi-arid West of EEUU [64]. In the study area, green roofs would
be a suitable practice not only because of their hydrological mitigation (reduction of peak
Int. J. Environ. Res. Public Health 2021,flow
18, x and
FOR PEER
waterREVIEW
pollution) but also because they provide insulating properties that15 of 20
allow
reducing energy consumption related to building cooling (around 0.7%) [65], which is
especially interesting in Elche, where temperatures of 38 ◦ C are reached in summer. Despite
permeable
large storms, pavements
replacinghelping to absorb flash
all the conventional floods from
pavements large
in the storms,
campus as replacing
simulatedall the
in Sce-
conventional pavements in the campus as simulated in Scenario 3 would
nario 3 would be extremely expensive. Nevertheless, some changes can be made by incor- be extremely
expensive. Nevertheless,
porating bioswales some changes
and bioretention can be
practices madeof
instead bydryincorporating bioswalesforand
gardens or concrete, ex-
bioretention practices instead of dry gardens or concrete, for example,
ample, around parking lot areas. Sometimes, the implementation of such practices around parkingdoeslot
areas. Sometimes,
not necessary the implementation
involve high costs, andofflowsuchaccumulation
practices doesasnot necessary
shown involve
in Figure 6 canhigh be
costs, and flow accumulation as shown in Figure 6 can be avoided with simple
avoided with simple but effective solutions, such as providing a wide opening for storm- but effective
solutions,
water flow such
andasredirecting
providing it a wide openingareas
into garden for stormwater
[63], treatingflow and redirecting
stormwater it into
as a resource
garden areas [63], treating
rather than a waste product. stormwater as a resource rather than a waste product.
Figure6.6.Flow
Figure Flowaccumulation
accumulation inin aa parking
parking lot
lot of
of the
the study
study area
area with
with aa total
total accumulated
accumulated rainfall
rainfall of
of
17.2 mm in 72 h (8 January 2021) [66].
17.2 mm in 72 h (8 January 2021) [66].
4.2. Limits and Strengths
In this study visual photointerpretation of high-resolution images was carried out
and eight land-cover types were identified according to the nature of their surfacing ma-
terial. Some drawbacks related to work at small-size scales are linked to subjectivity inInt. J. Environ. Res. Public Health 2021, 18, 9511 15 of 19
4.2. Limits and Strengths
In this study visual photointerpretation of high-resolution images was carried out
and eight land-cover types were identified according to the nature of their surfacing
material. Some drawbacks related to work at small-size scales are linked to subjectivity
in urban unit definition; firstly, due to a lack of image resolution, and secondly, because
no common classifications have been established [67], resulting in different land-cover
types depending on the aim of the study. Moreover, the composition of surfacing material
cannot be always properly identified with aerial images, so land cover and land use have
usually been employed indistinctly to refer to urban units. This work purposed to create a
database that incorporated new attributes, both physical and environmental, and be used
in future studies. Therefore, chronological land-cover and land-use maps were developed
(Supplementary Figures S1–S3), providing detailed spatial information of urban land units
integrated in the university campus, allowing different research approaches. Despite the
fact that the land-cover classification mentioned in the present study was tailored to specific
needs and may not be feasible for large-scale studies, it can be extended to other university
campuses and improved until a common classification is created.
In the other hand, the simplicity, stability, and acceptance of the SCS-CN method make
it a suitable empirical approach to modeling storm losses in the study area. Two of the
greatest weakness of this lumped model are the strong dependency on a single parameter
(the CN), which needs to be calibrated for each region, and the fixed initial abstraction ratio
of 0.2 [68]. It is not easy to accurately select CN values to characterize a study area; for this
reason, this work used both P0 and CN values from Spanish and American tabulated tables,
prioritizing the first and reserving the second for those land covers that did not fit with the
descriptions of the National Standard 5.2-IC. Then, a weighted P0 value was established
for the entire campus and calibrated to estimate the surface runoff generated. The under-
or over-estimation of runoff depth due to the weighted values of P0 increases when the CN
ranges are wider [69]. For the present study, differences were considered not significant,
since the purpose of this work was to compare the changes in surface runoff under different
land conditions, rather than to obtain precise results. Otherwise, the initial abstraction
ratio could be interpreted as a regional parameter, as values varying in the range 0–0.3
have been documented in numerous studies [70], where λ from 0.05 to 0.1 seems to be
more representative in other locations [51,71]; consequently, additional research is needed
to shed light on this issue. It should be added that hydrological responses are influenced
by multiple factors and control of variables was limited to the methodology selected and
data availability. It was assumed that climate conditions had an even distribution in the
whole area and an average value was calculated for the entire campus, considering the
morphology of the study area location and the digital elevation model used. The soil
type classification remained a relevant factor and although field samples could have been
analyzed for the last period (2017) to better represent soil textures in each surface cover,
this process would have been too expensive and not easily done (considering permanent
soil sealing). For that reason, a common soil group was defined. As a result, the most
important variable between the three scenarios relied on P0 and CN values, which were
considered appropriately characterized, given the available data. However, we expect to
incorporate new variables in future studies to design and evaluate LID performance in the
current campus conditions.
Leaving behind the limitations of this work, it is important to highlight that the
flexibility of both methodologies can be adapted to other urban areas, for example, to
different residential types, and can be used to evaluate the role of urban growth form in
surface runoff production such as in Xu et al. [19], or we can examine the surface runoff
associated with different sustainable drainage systems, given the increasing amount of
experimental works that are attempting to determine CN values for the most common
green infrastructures [20,55,72]. In addition, future research can be focused on investigating
the surface runoff quality on the university campus, as detailed land-cover classification is
already established.You can also read