Shiva, A., Sobouti, F., Priestley, K., Ghods, A., Motaghi, K., Tilmann, F., Eken, T. (2021): Seismic anisotropy and mantle deformation in NW Iran ...
←
→
Page content transcription
If your browser does not render page correctly, please read the page content below
Shiva, A., Sobouti, F., Priestley, K., Ghods, A.,
Motaghi, K., Tilmann, F., Eken, T. (2021): Seismic
anisotropy and mantle deformation in NW Iran
inferred from splitting measurements of SK(K)S
and direct S phases. - Geophysical Journal
International, 226, 2, 1417-1431.

https://doi.org/10.1093/gji/ggab181

Institional Repository GFZpublic: https://gfzpublic.gfz-potsdam.de/
Geophys. J. Int. (2021) 226, 1417–1431                                                                                        doi: 10.1093/gji/ggab181
Advance Access publication 2021 May 06
GJI Seismology

Seismic anisotropy and mantle deformation in NW Iran inferred
from splitting measurements of SK(K)S and direct S phases

                                                                                                                                                         Downloaded from https://academic.oup.com/gji/article/226/2/1417/6270890 by Bibliothek des Wissenschaftsparks Albert Einstein user on 14 June 2021
Shiva Arvin,1 Farhad Sobouti,1 Keith Priestley,2 Abdolreza Ghods,1 Khalil Motaghi,1
Frederik Tilmann 3,4 and Tuna Eken5
1 Department of Earth Sciences, Institute for Advanced Studies in Basic Sciences (IASBS), Zanjan 45137–66731, Iran. E-mail: shivarvn@gmail.com
2 Department of Earth Sciences, Bullard Laboratories, University of Cambridge, Cambridge CB3 0EZ, UK
3 Department of Geophysics, Deutsches GeoForschungsZentrum GFZ, 14473 Potsdam, Germany
4 Department of Earth Sciences, Institute of Geological Sciences, Freie Universität, Berlin 14195, Germany
5 Department of Geophysical Engineering, Faculty of Mines, Istanbul Technical University, 34469, Maslak/Istanbul, Turkey

Accepted 2021 May 4. Received 2021 April 27; in original form 2020 December 30

                                       SUMMARY
                                       We present the results of a shear wave splitting analysis performed on the teleseismic SK(K)S
                                       and direct S wave recordings of 68 temporary broad-band stations to investigate the mantle
                                       deformation on the northern side of the Arabia–Eurasia collision zone in NW Iran. We used
                                       the Reference Station Technique to overcome potential contamination from the source-side
                                       anisotropy on the direct S wave signals. This method enabled us to expand our splitting
                                       measurement database beyond the usual SK(K)S phases. The average splitting delay time over
                                       the entire region was found to be 1.14 ± 0.42 s for the SK(K)S wave and 1.36 ± 0.26 s for
                                       the direct S wave. In most parts of the study area, the fast polarization directions for both
                                       shear phases are consistent and show a uniform NE–SW direction with an average of 36◦ and
                                       37◦ for SK(K)S and S wave-derived results, respectively. This direction is in close agreement
                                       with the direction of the absolute plate motion vector in NW Iran (N39◦ E). The fast directions
                                       are associated with neither the surface geological trends, nor the geodetic strain fields. We
                                       propose that the observed anisotropy is mainly controlled by the LPO fabric developed due to
                                       the shearing of the asthenospheric layer in response to the motion of the lithosphere relative
                                       to the deeper mantle. Only in a narrow region near the tectonic boundaries of central Iran
                                       with NW Iran and the Alborz, NW–SE oriented SK(K)S fast directions tend to align with the
                                       major geological structures. Fast directions obtained from direct S wave indicate significantly
                                       smoother variations in the same regions and mostly continue to be aligned in the NE–SW
                                       direction. We attribute these differences to the change in the structure of the lithosphere in the
                                       tectonic boundary zone. The western margins of central Iran possess a strong deformational
                                       fabric as evidenced by the major active strike-slip zones there. Considering that the depth extent
                                       of this fabric expands over a relatively narrow zone in the mantle, it can locally influence the
                                       SK(K)S phases. The direct S waves, on the other hand, have a larger footprint and therefore
                                       average over a larger region, and relative to the SK(K)S phases, are influenced more strongly
                                       by the asthenospheric fabric due to their larger angles of incidence, which results in a larger
                                       zone of influence for station average anisotropy parameters.
                                       Key words: Seismic anisotropy; Continental tectonics: compressional; Dynamics of litho-
                                       sphere and mantle.

                                                                               Motaghi et al. 2017) has resulted in the formation of a broad oro-
I N T RO D U C T I O N
                                                                               genic plateau, bounded by the thrust-and-fold belt of the Zagros
The present-day tectonics of Iran has resulted from the continental            in the south, and the Alborz and Kopet Dag in the north (Agard
collision of the Arabian and Eurasian plates. Ever since the clo-              et al. 2011). Collision has resulted in the formation of a very thick
sure of the Neo-Tethys Ocean in the late Oligocene (25 Ma) in                  lithospheric root of up to 230–250 km in the Zagros that is in sharp
Iran (Mouthereau et al. 2012), the progressive underthrusting of               contrast with the thinner lithosphere of the rest of Iran (Priest-
the Arabian passive margin beneath central Iran (Paul et al. 2006;             ley et al. 2012; Motaghi et al. 2015; Tunini et al. 2015, 2017).


C The Author(s) 2021. Published by Oxford University Press on behalf of The Royal Astronomical Society. All rights reserved. For
permissions, please e-mail: journals.permissions@oup.com
                                                                                                                                                 1417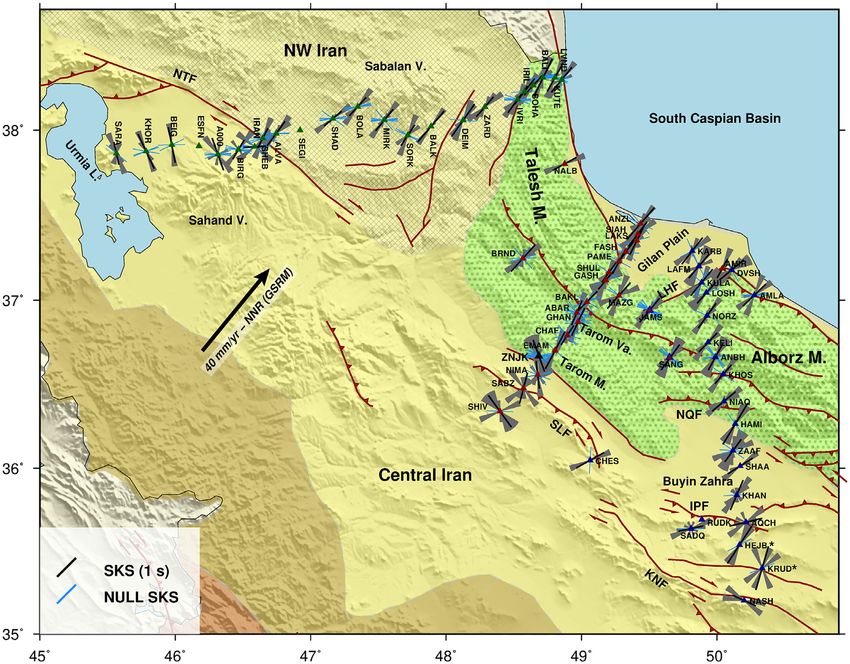
1418       S. Arvin et al.

There have been extensive discussions about the fate of the sub-             Although splitting measurements obtained from SK(K)S phases
ducted oceanic lithosphere, and whether or not it is still attached       are a well-established tool to map seismic anisotropy, analysis of
to the Arabian lithosphere with numerous investigations offering          complex anisotropy is often limited by poor azimuthal coverage.
various geophysical and geological evidence for a post-collisional        In contrast, direct teleseismic S waves tend to be more frequently
slab break-off under the Zagros orogeny (e.g. Agard et al. 2011;          recorded with good signal-to-noise ratios due to the larger distance
Mouthereau et al. 2012; van der Meer et al. 2018; Mahmoodabadi            range, over which they are observed, and also due to the smaller
et al. 2019). On the other side of the collision zone, in central Iran    distances. They show a larger variety of incidence angles and polar-
and regions to its north, observations of seismically low-velocity        ization directions. Direct S waves have been used to estimate source-

                                                                                                                                                      Downloaded from https://academic.oup.com/gji/article/226/2/1417/6270890 by Bibliothek des Wissenschaftsparks Albert Einstein user on 14 June 2021
shallow mantle (e.g. Al-Lazki et al. 2004; Kaviani et al. 2007;           side region anisotropy of the subslab environment after correcting S
Rastgoo et al. 2018; Mahmoodabadi et al. 2019; Rahmani et al.             wave signals for previously known receiver-side anisotropy. Lynner
2019) and post-collisional magmatic activities (Omrani et al. 2008;       et al. (2017) reported that source-side splitting measurements for the
Chiü et al. 2013) have prompted several authors to suggest that          events at short distances and thus with large incidence angles can be
warm upward asthenospheric flow fields have influenced the evo-           influenced by different types of LPO fabrics developed under local
lution of the lithospheric structure after the start of collision (e.g.   stress, temperature and water content conditions within subduction
Amini et al. 2012; Mahmoodabadi et al. 2020). The deformation of          environments. The problem can also arise when the main goal is to
the lithosphere in the collision zone therefore, is probably closely      image variation of anisotropic parameters beneath the receiver-side
intertwined with the upper mantle flow field beneath. An important        since these waves can be easily contaminated by undesired source-
aspect of the study of the dynamics of the collision zone is to under-    side anisotropy. To overcome this issue, deep-focus earthquakes
stand the relationship between the mantle flow field and the surface      in subduction zones have been suggested as suitable sources of S
deformation inferred from tectonics. One other subject is whether         waves uncontaminated by source side anisotropy, as the mantle be-
or not the lithosphere deforms coherently. This is an important is-       low 300–400 km depth is generally thought to be largely isotropic
sue, since it can shed light on how shortening is accommodated and        (e.g. Savage et al. 1990; Long & van der Hilst 2005). However,
how faulting near the surface is continued into the lower part of the     Wookey et al. (2002) observed that deep events were actually af-
lithosphere.                                                              fected by slab and subslab anisotropy; presumably due to the lower
   Lithospheric and mantle deformation can be efficiently con-            temperatures in subducting slabs, anisotropic fabrics can persist
strained by measurements and models of seismic anisotropy.                to larger depths. Furthermore, for temporary deployments, usually
Specifically, shear wave splitting parameters derived from waves          only a small number of deep-focus events are recorded. Therefore,
travelling in an anisotropic mantle can give hints about the present-     we used the Reference Station Technique (RST) developed by Eken
day patterns of mantle flow, as well as the present and past de-          & Tilmann (2014) to remove the potential contamination of the
formation history of the lithospheric mantle (Silver 1996). The           direct S phases by source-side anisotropy in shear wave splitting
mapping of splitting patterns is therefore crucial for our under-         analysis. As an array-based approach, the RST makes use of wave-
standing of the dynamics of continental deformation throughout            form comparisons at two closely spaced stations (reference and
different tectonic domains and across boundaries separating those         target stations) for which source-side anisotropy can be regarded as
domains.                                                                  identical. The optimum splitting parameters beneath a target station,
   For the quantification of seismic anisotropy in the mantle, po-        can then be estimated through a grid search procedure where the tar-
larization analyses of split shear waves are often used as a direct       get station is corrected for tentative splitting parameters. If splitting
diagnostic tool. Shear waves entering an anisotropic medium are           is present at the reference station, it is corrected for receiver-side
split into fast and slow components. Among various types of shear         anisotropy prior to the analysis. The maximum similarity of the cor-
waves, core-mantle refracted shear waves, SK(K)S, are the most            rected S wave signal beneath the reference station and target station
popular phases to determine the mantle anisotropy because their           represents the best estimate of splitting parameters for the respec-
polarity prior to entering the anisotropic medium below the re-           tive station pair and event; final splitting parameters are derived
ceiver can be assumed to be radial (R). Therefore, the presence           by averaging the results from many events and station-pairs. The
of energy on the transverse component (T) giving rise to elliptical       RST has been applied to the regions with various tectonic settings,
particle motion is the main diagnostic feature of anisotropic struc-      such as in the Tibetan Plateau (Eken & Tilmann 2014; Singh et al.
ture (Savage 1999). The two splitting parameters are the time de-         2016; Tiwari et al. 2017) and the Hellenic Trench in the eastern
lay between the fast and slow wave (δt), which depends on both            Mediterranean (Confal et al. 2016).
the strength of anisotropy and the thickness of the anisotropic              In this work, we focus on the northwestern corner of the Ira-
layer, and the fast polarization direction (FPD), which indicates         nian plateau, covering the western Alborz and Talesh Mountains,
the orientation of the fast axis of anisotropy (Silver & Chan             NW Iran and parts of the northern margin of central Iran (Fig. 1).
1991).                                                                    By using SK(K)S and direct S wave splitting analyses, we will
   The lattice preferred orientation of anisotropic olivine crystals in   investigate the anisotropic nature of the mantle in a part of the
the upper 400 km of the mantle is considered to be the major source       Arabia–Eurasia collision zone where several of the constituent tec-
for shear-wave anisotropy as measured by teleseismic shear wave           tonic blocks of Iran come into contact. Our aim is to identify the
splitting (Karato et al. 1995). The FPDs tend to orient parallel to       dominant source of anisotropy in order to infer the pattern of mantle
the fast a-axis of olivine crystals and are often used as a proxy for     deformation as it responds to the forces of continental convergence.
the direction of mantle strain or flow (Silver & Chan 1991; Savage        We used the recordings of three temporary seismic arrays deployed
1999). The steep-angle arrival of split SK(K)S waves at the receiver      in the region at different time periods between 2008 and 2016.
provides excellent lateral resolution for splitting measurements in       Including both SK(K)S and direct S waves in the splitting mea-
the upper mantle, and enables a direct comparison of anisotropy with      surements notably improved the range of initial polarization an-
surface tectonic and geologic features possessing typical continental     gles (equivalent to backazimuths for SK(K)S events) and azimuthal
dimensions.                                                               coverage.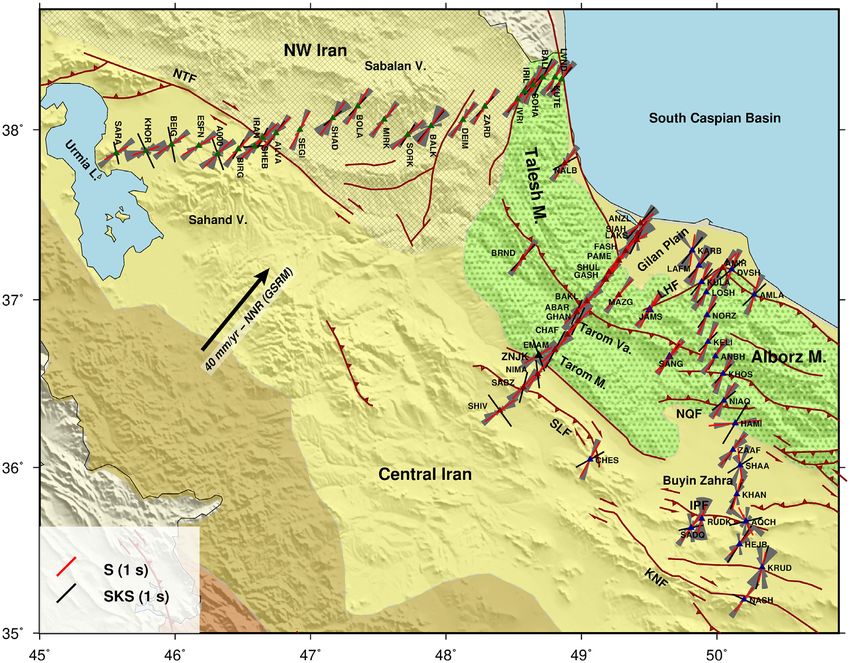
Seismic anisotropy and mantle deformation                    1419

                                                                                                                                                                   Downloaded from https://academic.oup.com/gji/article/226/2/1417/6270890 by Bibliothek des Wissenschaftsparks Albert Einstein user on 14 June 2021
Figure 1. The regional tectonic and topographic map showing the seismic arrays used in the present study. The red lines show the trace of the active faults,
taken mostly from Hessami et al. (2003). The temporary IASBS/CAM seismic arrays are shown by colored triangles. Station names are mentioned in the
subsequent figures. The SK(K)S fast directions obtained from previous studies are also shown. Contour lines show variations of lithospheric thickness adopted
from Mortezanejad et al. (2019). The black and grey arrows are the plate motion vectors from Kreemer et al. (2014) and GPS vectors (relative to stable Eurasia)
from Khorrami et al. (2019), respectively. The dark slate grey bars are the strike of the geodetic maximum shear strain rate in Iran (Raeesi et al. 2017). Fault
and region abbreviations: LHF, Lahijan Fault; NTF, North Tabriz Fault; NQF, North Qazvin Fault; SLF, Soltanieh Fault; KNF, Kushk-e Nosrat Fault; IPF, Ipak
Fault; KD, Kopet-Dagh; UDMA, Urumieh-Dokhtar Magmatic Arc; SSZ, Sanandaj-Sirjan Zone.

R E G I O NA L T E C TO N I C S E T T I N G A N D                                  absent and shortening (at a relatively slow rate) is accommodated
P R E V I O U S A N I S O T RO P Y S T U D I E S                                   on sets of major strike-slip fault zones (Allen et al. 2011). In our
                                                                                   region of interest these strike-slip zones include the North Tabriz,
The Arabia–Eurasia collision has resulted in the formation of the
                                                                                   Soltanieh and Kushk-e Nosrat faults. Seismic tomography and other
central Iran Plateau. In western Iran the plateau is bounded on its
                                                                                   seismological techniques have revealed a great deal of variation in
foreland side by the Zagros Mountains, and on the hinterland by
                                                                                   lithospheric and upper mantle structure from south to north of the
the Alborz and Talesh Mountains. The South Caspian Basin (SCB)
                                                                                   collision zone. In the Zagros and SSZ, high upper-mantle seismic
on the northern end acts as a rigid backstop to the forces of con-
                                                                                   velocities reveal a thick lithosphere of the Arabian margin under-
tinental shortening (e.g. Ghods et al. 2015). North of the Zagros
                                                                                   thrusting central Iran (e.g. Paul et al. 2010; Motaghi et al. 2017;
suture lie the Sanandaj-Sirjan Zone (SSZ) and the Urumieh-Dokhtar
                                                                                   Rahmani et al. 2019). Receiver function studies and ambient noise
Magmatic Arc (UDMA), which developed as the arc regions of the
                                                                                   tomography further clearly imaged the Arabian mid-lower crust un-
Neo-Tethyan subduction in the Mesozoic and Cenozoic, respec-
                                                                                   derthrusting the crust of central Iran along the Main Zagros thrust
tively (Agard et al. 2011). Central Iran as a distinct continental
                                                                                   (e.g. Paul et al. 2006; Nissen et al. 2011; Pilia et al. 2020). Sur-
block separates the SSZ and UDMA from the Alborz. These dis-
                                                                                   face wave tomography images show that in the Zagros a high shear
parate tectonic blocks were assembled in the last 25 Myr as part of
                                                                                   wave-speed lid extends to a depth of 225 km (Priestley et al. 2012;
the ongoing continental collision process (e.g. Agard et al. 2011).
                                                                                   Motaghi et al. 2015). Similarly, under the SCB upper mantle ve-
Our study region covers the northern part of this geological setting
                                                                                   locities are high, indicating a large lithospheric thickness (Priestley
from the UDMA to the southwestern margins of the SCB (Fig. 1).
                                                                                   et al. 2012). In contrast in central Iran, NW Iran and the Alborz, low
The constituent blocks are characterized by different present-day
                                                                                   uppermost mantle wave speeds point to the presence of a thinner
styles of deformation. In the mountain belts the deformation is
                                                                                   lithosphere and warm mantle (Al-Lazki et al. 2004; Maggi & Priest-
mainly accommodated by folding and thrust faulting (e.g. Nis-
                                                                                   ley. 2005; Amini et al. 2012; Rahmani et al. 2019). Two body wave
sen et al. 2011), while in central Iran crustal thickening is largely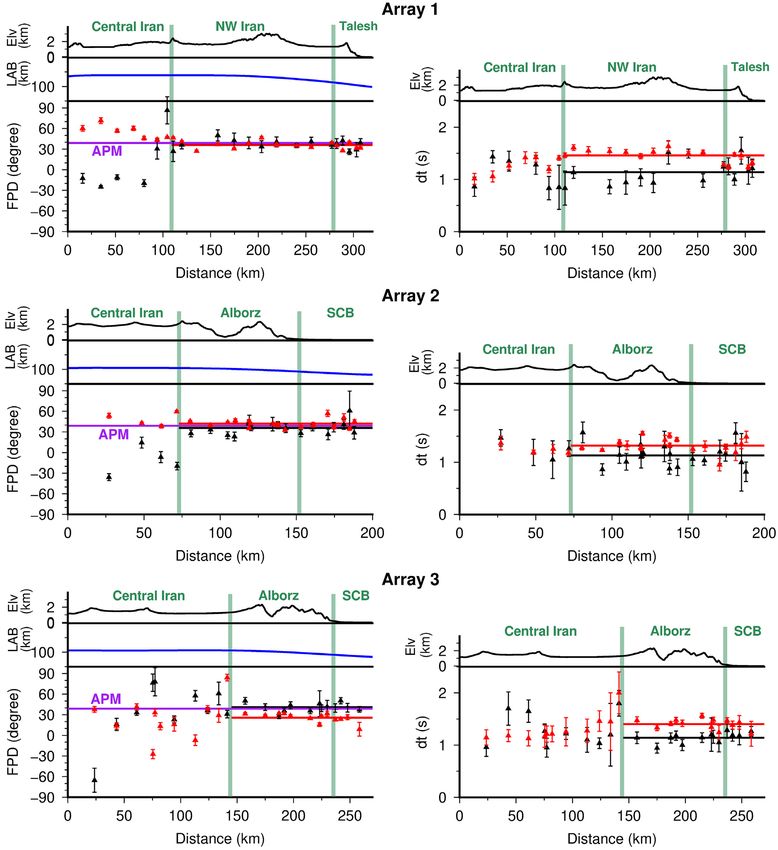
1420 S. Arvin et al.
tomographic models using joint regional and teleseismic phases
(Bavali et al. 2016; Motaghi et al. 2018) in NW Iran have shown a
sharp contrast between high-velocities in the upper mantle under the
SCB and low-velocities in the neighbouring NW Iran and western
Alborz regions. Mortezanejad et al. (2019) converted the Rayleigh
wave group velocity dispersion data for shear wave velocity in NW
Iran and derived a map of lithospheric thickness variations in our
study area (Fig. 1). According to this map, the lithospheric thickness
Downloaded from https://academic.oup.com/gji/article/226/2/1417/6270890 by Bibliothek des Wissenschaftsparks Albert Einstein user on 14 June 2021
is as low as 70 km in NW Iran, increasing to more than 120 km
towards NW Zagros in the south and SCB in the east. Quantita-
tive analysis of P and S receiver functions (Taghizadeh-Farahmand
et al. 2010) gave an estimate of 85 km for the thickness of the
lithosphere in NW Iran. Another receiver function analysis (Mo-
hammadi et al. 2013) imaged the lithosphere to decrease from a
thickness of ∼200 km in west-central Zagros and SSZ to 80–90 km
in central Iran and central and eastern Alborz. Late Cenozoic mag-
matism throughout much of central Iran and the Alborz also attest
to a warm shallow upper mantle (Omrani et al. 2008; Chiü et al.
2013).
Previous seismic anisotropy studies in Iran and neighbouring re-
gions have revealed much about the anisotropic structure of the
Arabia–Eurasia collision zone. Kaviani et al. (2009) observed from
SK(K)S splitting measurements that seismic anisotropy in Iran
shows internal consistency in each individual tectonic block but
varies sharply between them. They argued that the heterogeneous
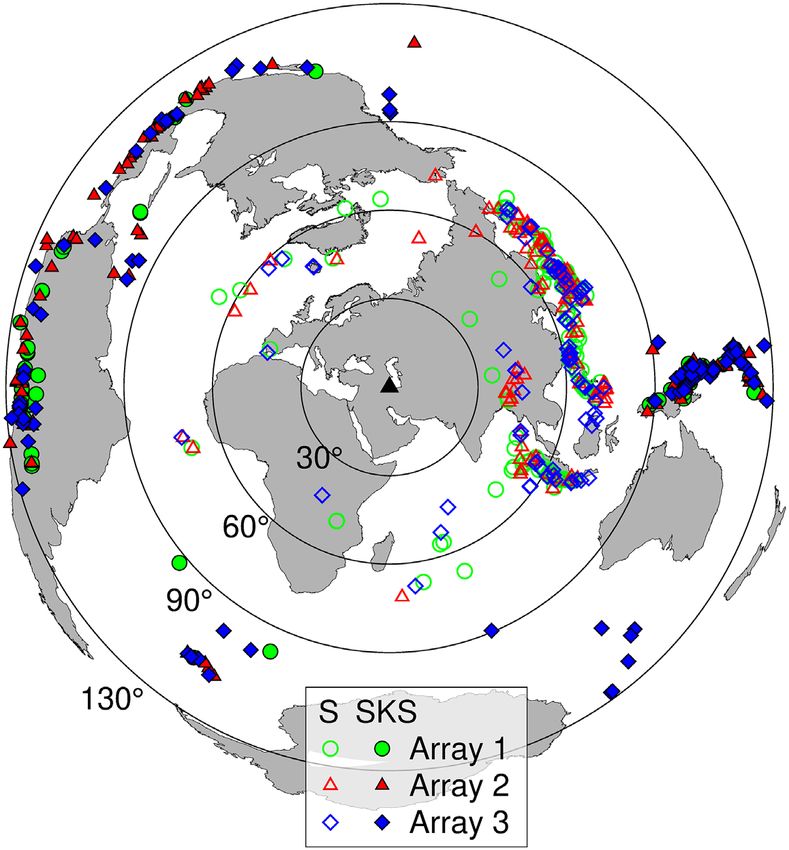
Figure 2. Azimuthal and distance distribution of the teleseismic events used
nature of the anisotropic field in Iran might be influenced by the in this study.
deformation fabric of the lithosphere rather than the flow fabric
of the asthenosphere. According to them the agreement between
the observed directions of anisotropy with the direction of maxi- for Advanced Studies in Basic Sciences (IASBS) and University
mum shear as inferred from geodetic measurements implies a verti- of Cambridge, and one permanent station of the Iranian National
cally coherent deformation within the lithosphere of Iran. Sadeghi- Seismic Network (INSN, Fig. 1). The temporary arrays were mainly
Bagherabadi et al. 2018a, 2018b) examined the shear wave splitting linear profiles that traversed the Talesh and western Alborz Moun-
of the SK(K)S phases along a seismic array in western Iran across tains, NW Iran and parts of the central Iran Plateau to the vicinity of
the collision zone from the Zagros to the Alborz. Their work re- the UDMA. The average inter-station distance on the profiles was
vealed that while in the Zagros, the thick lithospheric root accounts about 13 km. The stations were repositioned during deployment
for the along-strike fast polarization directions, in central Iran and and the recording span at individual stations varied between 4 and
the Alborz, the asthenospheric mantle flow field in the far-field 31 months.
away from the collisional front is responsible for the observed fast We used two data sets in this study. For the SK(K)S splitting mea-
directions, which trend subparallel to the absolute plate motion surements we used teleseismic earthquakes with magnitudes greater
(APM) vectors. They contended that the complex and variable pat- than 5.5 and epicentral distances between 90◦ and 130◦ , and for the
tern of fast polarization directions (FPD) under central Iran could direct S wave analysis we considered events larger than magnitude
reflect a small-scale organization of the mantle flow field under a 5.5 within a distance range from 40◦ to 80◦ (Fig. 2). The reason
lithosphere with a significant thickness gradient. Also, Sadidkhouy why we select direct S wave signals of the events with distances
et al. (2008) observed fast SKS directions in northern Iran that greater than 40◦ is to avoid possible complications, which may stem
were subparallel to the APM vector, suggesting an asthenospheric from phase shifts due to the surface reflection at shallow angles
origin for the observed anisotropy. Also, on the Anatolian side of the of incidence (Savage 1999). A total number of 2764 teleseismic
Turkish-Iranian plateau, SK(K)S studies (Sandvol et al. 2003; Paul events, mostly in the eastern hemisphere, met the above conditions.
et al. 2014; Confal et al. 2016, 2018) show a dominant NE-SW ori- More information about the three arrays and the number of events
ented FPDs, with almost no abrupt changes in directions across the analysed is given in Table S1.
main tectonic boundaries. Together with relatively thin lithospheric
thickness estimates (∼90–100 km) from S receiver functions across
entire Anatolia (Kind et al. 2015), these splitting parameters were
SK(K)S analysis
explained by a large-scale sublithospheric flow beneath the Anato-
lian plate as the primary origin of seismic anisotropy (Paul et al. We carried out the SK(K)S splitting analysis by applying the
2014; Confal et al. 2018). transverse-component minimization method (SC) of Silver & Chan
(1991) on individual records to measure the splitting parameters, the
fast polarization direction, FPD and the delay time, δt. The method
relies on finding the best-fitting splitting parameters in a grid search
D ATA A N D M E T H O D S
scheme by assuming a single-layer medium of transverse anisotropy
The broad-band seismic data used in this study were recorded by 68 with horizontal axis of symmetry.
seismic stations in three temporary arrays in NW Iran installed and We cross-checked with the rotation-correlation (RC) method of
operated non-concurrently between 2008 and 2016 by the Institute Bowman & Ando (1987) and only retained measurements when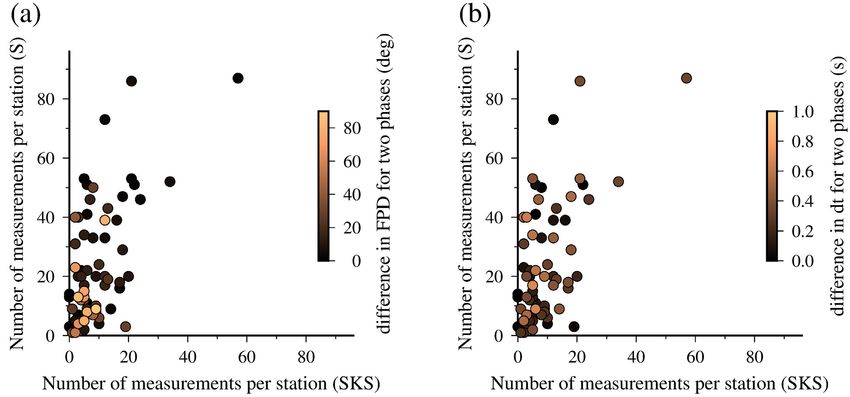
Seismic anisotropy and mantle deformation                  1421

both methods yielded consistent estimates for the splitting param-         inverse splitting operator (based on known anisotropic parameters
eters. Similar to Wüstefeld & Bokelmann (2007), we performed a            at the reference station) to the two horizontal components of the
comparison between results from these two methods and then we              reference station. The result of this correction is assumed to recover
kept the measurements as good non-null results if |FPDRC - FPDSC           the signal representing only source side anisotropy at the reference
|
1422       S. Arvin et al.

other phases such as SK(K)S and ScS. Finally, we applied a 0.03–          show more variation with both NE–SW and E–W FPDs. Most of
0.2 Hz bandpass filter to all seismograms.                                the stations, especially those located in NW Iran, the Talesh, and
   The uncertainties in the individual splitting parameters were es-      the Alborz exhibit a unimodal distribution of FPDs largely inde-
timated by the inverse F-test approach of Silver & Chan (1991),           pendent from the initial polarization direction of the SK(K)S phase
which is a statistical measure of the errors and works via comparing      (rose diagrams in Fig. 3), which implies a single-layer anisotropic
the variation in the residual energy distribution above the minimum       structure. Exceptions to this general pattern are observed at sev-
of the misfit surface with the variation based on a preset confidence     eral stations in the southern end of Arrays 2 and 3, located on the
level of 95 per cent.                                                     northern margins of central Iran (e.g. stations SHIV, SABZ, KRUD,

                                                                                                                                                     Downloaded from https://academic.oup.com/gji/article/226/2/1417/6270890 by Bibliothek des Wissenschaftsparks Albert Einstein user on 14 June 2021
   The causes for null measurements for the direct-S waves are sim-       SADQ and AQCH), for which the diagrams show two or three lobes.
ilar to those for the SK(K)S phases as explained earlier. To prevent      For eight stations in our database, our analysis resulted in only one
a null measurement to be included in the non-null results, the RST        or two reliable splitting measurements. Despite the low number of
performs a null-split reject test, where the F-test again compares        measurements, for most of these stations we found average FPDs
the residual energy at the actual minimum with the calculated resid-      that are more or less consistent with their neighbouring stations (e.g.
ual energy under the assumption of null splitting to determine how        IRAN, BEIG, NALB, EMAM and HAMI). This coherency gives a
strongly the data exclude null splitting in a statistical sense.          measure of confidence about the reliability of their results. Station
   We applied a stepwise quality assessment to achieve consistency        CHES in Array 2 has only one splitting measurement and we will
of the results and retained only measurements that: (1) had a normal-     not attempt to interpret it. For five stations of Array 3 located in
ized residual energy smaller than 0.5 to ensure that the assumption       the mountain ranges south of Buyin Zahra, station-averaged FPDs
of identical source-side splitting and absence of strong scattering       show significant variations. Three of the stations (AQCH, SADQ
phases is roughly satisfied, (2) had an α value between 0.4 and 0.6       and NASH), had five or more reliable splitting measurements with
to reject results affected by strong site effects or 3-D heterogeneity    approximately E–W oriented FPDs. The other two stations, HEJB
and (3) had null splitting rejected at 95 per cent confidence level       and KRUD located in the south of Buyin Zahra, only had 2 and
or higher. Fig. S2 presents an example of the process for the direct      3 splitting measurements, respectively, and were identified by NE–
S wave splitting measurements using the RST at station pair LVND          SW oriented fast directions. Since it would be unlikely for the
(reference)–IVRI (target). Our S wave analysis and its subsequent         anisotropic structure to vary so much over small distances, and
quality check procedure returned a total of 1624 reliable non-null        given the low number of measurements obtained for stations HEJB
measurements from 354 teleseismic events for the three arrays (see        and KRUD, we therefore assume that the fast axes in this region are
Table S1).                                                                mostly E–W oriented.
                                                                             Blue bars in Fig. 3 show the initial polarization directions of
                                                                          SK(K)S waves that returned null results. A majority of these polar-
R E S U LT S                                                              izations are either nearly parallel or perpendicular to the direction
                                                                          of the fast or slow axis, such that null splitting measurements are
The rose diagrams of individual measurements and averaged split-
                                                                          expected for these backazimuths. As the number of measurements
ting parameters for each station are shown in Fig. 3 [SK(K)S results]
                                                                          (both null and non-null) at the stations increases, the match between
and Fig. 4 (S results). The stereographic plot of splitting measure-
                                                                          the null-returning initial polarizations and the FPDs generally im-
ments at each stations varying with backazimuth and incidence
                                                                          proves. Good examples are observed at stations JAMS and SANG
angle are shown in Fig. S3. In order to calculate station-averaged
                                                                          with four years of continuous data. At some stations the null mea-
parameters we took the arithmetic mean for the delay times and
                                                                          surements are from different initial polarization directions suggest-
used the von Mises method (Cochran et al. 2003) to calculate the
                                                                          ing locally complex anisotropy, or scattering from heterogeneous
circular mean of the FPDs. For the direct S waves, at each target
                                                                          structures. As most of our stations have a limited back-azimuthal
station we first averaged the measurements obtained from all the
                                                                          coverage (Fig. 2), a modeling of multilayered anisotropy would be
reference stations for a given event and then took the total average
                                                                          poorly constrained and thus does not seem warranted. Nevertheless,
over all events.
                                                                          the unimodal pattern of the splitting measurements in most of the
                                                                          stations suggests that a single-layer anisotropy structure is sufficient
                                                                          to explain the splitting observations in NW Iran and the mountain
SK(K)S splitting parameters
                                                                          ranges.
Fig. 3 displays the results of the SK(K)S measurements on the re-
gional map. Statistics for each station are given in Table S2. The
total average of delay times for the entire region is 1.14 ± 0.42 s,      Direct S wave splitting parameters
and the average values of the three arrays differ from each other by
no more than 0.06 s. The FPDs at stations located throughout NW           As mentioned earlier we started the iterative RST process with
Iran, inside the Talesh and Alborz ranges, and in the Caspian region      three initial reference stations selected for each of the arrays. We
are dominated by a uniform NE–SW trend with an average azimuth            chose the reference stations among those with the most reliable
of 37 ± 8◦ . This direction closely matches with the APM vector in        and well-constrained splitting parameters and good backazimuthal
NW Iran trending at N39◦ E. Stations located outside the aforemen-        distribution, ensuring a good regional distribution; this was achieved
tioned regions exhibit FPDs that deviate from this regional trend.        by choosing the station with the largest number of good and fair
FPDs observed for the five westernmost stations of Array 1, which         SK(K)S measurements within each array, also checking whether the
are located near the UDMA region indicate a rotation towards NW–          single-event splitting estimates show internal consistency. Splitting
SE. The southern stations of Array 2 are situated in the transition       parameters obtained at each iteration are shown in Fig. S4. At
zone between the Alborz and central Iran, and their fast directions       the end of the first iteration, the minimum relative residual energy
also display NW–SE orientation. In the southern end of Array 3,           achieved for the three arrays was 0.021, 0.025 and 0.055, while the
situated on the northern limits of central Iran, the fast polarizations   residual energy resulting from zero splitting was 0.79, 0.88 and 1.08
Seismic anisotropy and mantle deformation 1423
Downloaded from https://academic.oup.com/gji/article/226/2/1417/6270890 by Bibliothek des Wissenschaftsparks Albert Einstein user on 14 June 2021
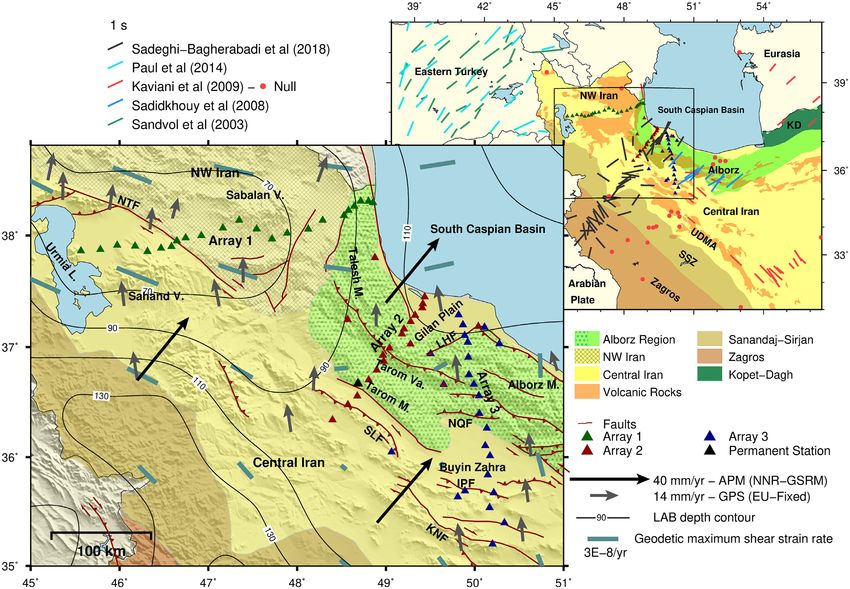
Figure 3. Rose diagrams, station averages and null measurements for the SK(K)S wave superimposed on the tectonic map shown in Fig 1. At each station, the
rose diagram histograms of the individual FPD measurements (grey wedges) are shown alongside the station-averaged FPDs (black bar). The length of bars is
proportional to the mean splitting delays. Stations with ∗ were deemed unreliable.
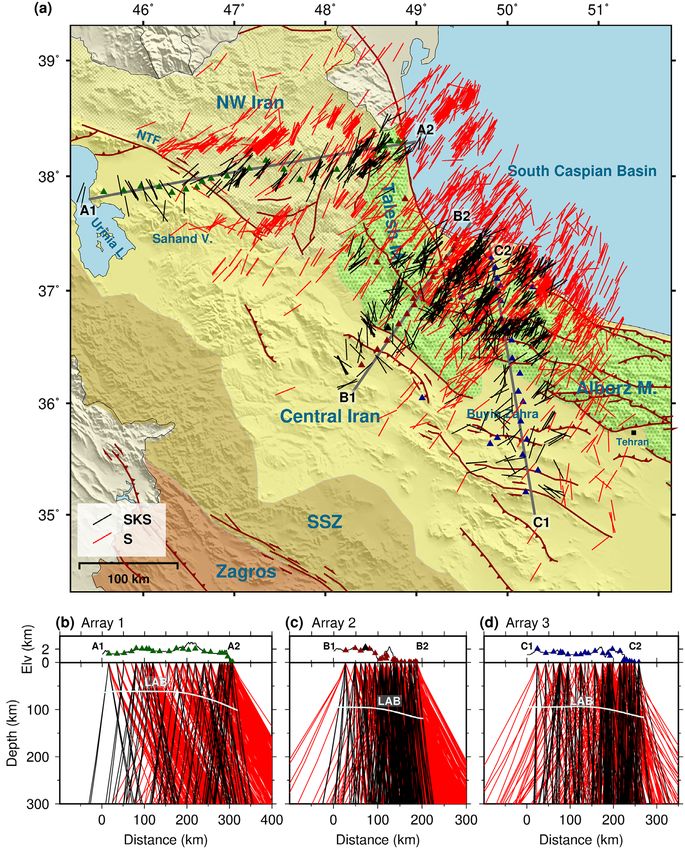
Figure 4. Rose diagrams (histograms of event-averaged S measurements, grey wedges) and station averages for the S wave (red bars) superimposed on the
tectonic map. SK(K)S station averages are also shown by black bars. Stations JAMS and SANG operated in both Array 2 and 3. The two arrays did not operate
concurrently. Consequently, we report two station-average FPDs for JAMS and SANG. The two average values differ by less than 10◦ , though.1424 S. Arvin et al.
respectively. In each array, most of the stations became a reference DISCUSSION
station from iteration 2 onwards. The minimum residual energies
settled around their minimum value (0.011, 0.012 and 0.032) after Comparison between SK(K)S and S wave splitting
iteration 2 or 3, but we carried out the process for one or two extra parameters
steps. We prevented stations with no SK(K)S result from becoming
In comparing the splitting measurements of the SK(K)S and di-
a reference station. The application of the α parameter was effective
rect S waves, an important question is how much of the differences
in obtaining reliable results in cases where one of the stations was
are due to the quantity of the available data and how much can
located on the Caspian sediments and the other one in the mountain
Downloaded from https://academic.oup.com/gji/article/226/2/1417/6270890 by Bibliothek des Wissenschaftsparks Albert Einstein user on 14 June 2021
be attributed to the way the two phases sample the anisotropic
regions. It allowed us to balance the waveform amplitudes of the two
medium. The scatter plots in Fig. 5 attempt to address this question
stations and helped to retain those measurements in the database.
by displaying the differences in the SK(K)S and S-derived average
The RST procedure enabled us to add to the splitting database three
splitting parameters as a function of the number of SK(K)S and S
stations (ESFN, SEGI,and RUDK), which did not produce a reliable
wave measurements. It was observed in several studies (e.g. Eken &
SK(K)S measurement.
Tilmann 2014; Tiwari et al. 2017) that most of the large differences
Fig. 4 shows the results of the splitting measurements based on
in FPDs and delay times could be attributed to the low numbers
direct S waves in comparison with the SK(K)S results. The average
of SK(K)S measurements at those stations. If the two datasets both
delay time δt, for the entire data set is 1.36 ± 0.26 s, which is 0.22 s
have reliable measurements and they still produce dissimilar re-
more than that of the SK(K)S phase. For Array 1 in NW Iran, the S
sults, then the variance could be attributed to lateral changes in
wave-derived FPDs are consistent with an overall NE–SW orienta-
anisotropic structure combined with the path differences between
tion, just as the SK(K)S results. We observe a smooth rotation from
the two phases. According to Fig. 5, out of 66 stations, 15 have an
a more east-west direction near the UDMA in the west to a more
FPD difference larger than 30◦ , but only 6 of them (KHOR, BEIG,
northerly direction in the Talesh region in the east. Across Array
IRAN, NIMA, HAMI and SHAA) have less than 5 SK(K)S split-
2, the dominant directions of FPDs are NE–SW with no significant
ting measurements. The other nine stations have high numbers of
variation along the profile. In Array 3, the Alborz Mountains north
SK(K)S measurements. Therefore, we cannot establish a clear cor-
of the North Qazvin Fault (NQF) are characterized by NE–SW ori-
relation between low number of SK(K)S measurements and large
ented FPDs, which appear to be fairly similar to the fast azimuthal
differences in FPDs. We conclude that the large difference between
pattern detected in the Talesh and Tarom regions. South of the NQF,
SK(K)S and S-derived splitting parameters can have a physical
in central Iran, the FPDs deviate from the regional NE–SW trend
meaning.
and become oriented more in the N–S direction. Station HAMI pro-
To track the propagation paths of the SK(K)S and direct S waves
duced only one S wave splitting measurement, which is inconsistent
in our region, we have plotted in Fig. 6, the fast axes of the indi-
with the neighbouring stations. We therefore consider the result of
vidual measurements of the two waves above the piercing points
this station not reliable. Compared to the rest of the study region
of their rays at 150 km depths (black and red bars, respectively)
where FPDs show considerable uniformity both at the individual
and the incoming rays of the two waves projected onto each of
stations and between the stations, many of the stations in the south-
the seismic arrays. This kind of representation is helpful in visu-
ern part of Array 3 exhibit significant variations in individual split-
alizing the geographical extent of the anisotropic volume sampled
ting measurements, as well as changes between stations over short
by the waves. According to the figure, the subvertically travelling
distances.
SK(K)S rays sample the asthenosphere and lithosphere inside a nar-
We can summarize the patterns of FPD variations for both phases
row region in the near vicinity of the stations, whereas the S rays
as follows: In NW Iran and the Talesh and Alborz ranges, which
travel on much-longer non-vertical paths inside the asthenosphere
collectively encompass most of our study area, both SK(K)S and S
and lithosphere before reaching the stations. Piercing points of S
waves have produced consistent NE–SW oriented FPDs (Figs 3
rays at 150 km depth, can be located at a horizontal distance of
and 4). The similarity of the splitting parameters for these re-
200 km from the stations (Fig. 6a). The great majority of S wave
gions suggests that they constitute a uniform block as far as their
single measurements exhibit uniformity in FPDs irrespective of the
anisotropic character is concerned. In the central Iranian domain
direction of the incoming ray, that is rays with southern and south-
immediately west of the North Tabriz Fault, as well as south of
western backazimuths produce the same NE–SW trending fast axes
the Tarom Mountains, the SK(K)S fast axes abruptly change to
as those approaching from north and northeast. Apart from a minor
NW–SE and N–S directions. In contrast, in the same regions the S
perturbation among the fast axes for rays arriving at the western
wave fast axes show much more gentle variations and maintain a
stations of Array 1 on paths parallel with the North Tabriz Fault
general NE–SW direction when the tectonic boundary is crossed;
(the region surrounding the Sahand volcano), the S wave fast axes,
in NW Iran moving further west, they smoothly rotate to a nearly
in contrast to the SK(K)S wave, do not show a notable sensitivity to
E–W direction. In the Buyin Zahra region in the southeast of the
tectonic boundaries over short length-scales. They instead show a
study region, we do not observe abrupt changes in the pattern of
more-or-less uniform anisotropic structure even across the bound-
the SK(K)S fast axes at the Alborz-central Iran boundary across
aries between major lithospheric blocks. This observation could be
the NQF zone, but further south in the mountains south of Buyin
explained by the relatively increased effect of the asthenosphere on
Zahra, they vary on a small scale, with the dominant trend being
the direct S wave anisotropy with respect to the lithosphere. The
subparallel to the approximately E–W strike of the mountains and
reason for why the S waves should be more sensitive to the as-
the faults bounding them (IPF and KNF). The S wave fast axes,
thenosphere is not entirely clear. One explanation could be that in
on the other hand, change to a more-or-less N–S orientation just
a heterogeneous lithosphere the larger zone of influence of the S
south of the NQF. Overall, both shear phases appear to distinguish,
wave tends to cancel out the smaller-scale variations, whereas in the
to varying degrees, between central Iran and the tectonic blocks to
asthenosphere the flow field is coherent and the common patterns
the northeast of it with the SK(K)S phase having greater sensitivity
of anisotropy are actually enhanced through the averaging effect of
than the direct S wave to structural changes.
the S wave. To summarize the interpretation of the results of the twoSeismic anisotropy and mantle deformation 1425
Downloaded from https://academic.oup.com/gji/article/226/2/1417/6270890 by Bibliothek des Wissenschaftsparks Albert Einstein user on 14 June 2021
Figure 5. Comparison between the station-averaged SK(K)S and direct S splitting parameters. (a) Scatter plot of the number of individual FPD measurements
at stations for the direct S wave versus SK(K)S wave. (b) The same plot for the delay times. The coloring of the data points represents the difference in the
splitting parameter measured by the two phases.
Figure 6. (a) Map of the individual FPDs plotted above the corresponding piercing points at 150 km for SK(K)S (black bars) and S (red bars). (b) The black
and red solid lines reveal the ray path of SK(K)S and S, along the Array 1, respectively. (c) and (b) are the same as (b) for Array 2 and 3.1426 S. Arvin et al.
phases, the direct S wave fast directions seem to map the general part in showing strong variability; they also do not always agree
direction of the prevailing sublithospheric mantle flow field beneath with the SK(K)S fast axes. This indicates that in the interior of cen-
the northeastern margin of central Iran, as well as under NW Iran tral Iran anisotropy is characterized by heterogeneous anisotropic
and the Alborz. This flow field has a NE direction away from the patterns.
collisional front of the Zagros in the southwest. The SK(K)S fast di-
rections in most cases also map the same sublithospheric flow field,
but they are locally affected by strong anisotropy of the intensely
Geodynamic interpretation and comparison with previous
deformed lithosphere on the boundary zone of central Iran and its
Downloaded from https://academic.oup.com/gji/article/226/2/1417/6270890 by Bibliothek des Wissenschaftsparks Albert Einstein user on 14 June 2021
studies
northern neighbouring blocks.
The only significant variation of S wave fast axes is observed in In the Alborz, Talesh and NW Iran the FPDs from both phases show
the southern stations of Array 3 in the Buyin Zahra region. Rays no correlation with surface geological features such as the strikes
approaching those stations from southeast and east have produced of the mountain ranges and the trend of the major fault zones. Nei-
fast directions that roughly trend N–S, discordant with surface ge- ther do they correlate with the Eurasia-fixed GPS vectors (Fig. 1).
ological trends and also with the local APM vector. These waves Instead, they are in close agreement with the direction of the APM
travel through a different part of the asthenosphere in central Iran vectors in the no-net-rotation frame (Figs 3 and 4). These obser-
that lies to the southeast of our region of study (the region south vations suggest that the main source of anisotropy in NW Iran and
of Tehran), and the change in fast directions from west to east regions surrounding the South Caspian Basin must be in the shallow
of our region can be an indication of possible changes in mantle asthenosphere as it is being sheared near the base of the lithosphere.
flow field beneath this part of central Iran. These changes in the It seems that the crust and mantle lithosphere do not play a signifi-
flow field can arise from variations in the geometry, thickness, and cant role in the observed anisotropy in these regions. This can be a
the dip of the advancing Arabian lithosphere along the collisional plausible explanation if the lithosphere is thin and the relative mo-
front. tion of the lithosphere and deeper mantle is large enough to generate
Figs 4 and 7 compare the delay times and FPDs for both phases the large strains needed for the development of a strong anisotropic
along each of the three arrays. In general the S wave delays are fabric (e.g. Confal et al. 2018). The high rate of 40 mm yr–1 for
slightly larger than the SK(K)S delay times. The observed differ- the APM velocity in western Iran (Kreemer et al. 2014—GSRM
ences are mostly larger than the error bounds suggesting that they v2.1 model) makes the development of a thick, strong layer with
are physically meaningful. The SK(K)S phases travel nearly verti- shearing-induced LPO feasible (Debayle & Ricard 2013). The re-
cally, and as a result, traverse a shorter path inside an anisotropic sultant large strength of anisotropy in the asthenosphere would be
volume than the direct S waves, producing a smaller delay time. consistent with our relatively large splitting delay time estimates.
A few stations in central Iran (e.g. KHOR, BEIG, ZNJK, SHIV, The general picture that the seismic studies mentioned above con-
KRUD, HEJB and AQCH), deviate from this general rule and have vey is that central Iran and the Alborz possess a relatively thin
an SK(K)S delay time larger than the S wave. Figs 3 and 7 show lithosphere and might even have undergone a delamination process
that the NW Iran stations (Array 1) in the north of the Sahand Vol- (Maggi & Priestley 2005; Rastgoo et al. 2018), in contrast to the
cano (i.e. SHEB, IRAN and BIRG) and those in the south of the Zagros range, which has a very thick lithospheric root (estimated
Sabalan Volcano (SHAD, BOLA, MIRK and SORK) consistently in excess of 240 km by some studies). These observations lend cre-
have smaller SK(K)S delay times than the regional average. Their dence to the suggestion that anisotropy in a major part of our study
average delay is 0.89 s, 0.24 s smaller than the average delay of Ar- area might be controlled by the upper mantle flow field rather than
ray 1. However, the S wave delay times do not show a corresponding by the deformational fabric of the lithosphere.
variation in their magnitude in the vicinity of the volcanoes. NW Our results are in agreement with the SK(K)S-derived FPDs es-
Iran is a region of anomalously warm crust and upper mantle and timated by Sadeghi-Bagherabadi et al. (2018a) who carried out a
the Sahand and Sabalan have had post-collisional magmatic activ- study over an expansive region in western Iran near arrays 2 and
ities as recently as Pliocene–Quaternary (Chiü et al. 2013). The 3 (Fig. 1). Their FPDs indicate a NE–SW orientation in the west-
regional Pg-wave tomography of Maheri-Peyrov et al. (2020) and ern Alborz Mountains; they change to NW–SE just south of the
the P-wave tomography of Bavali et al. (2016) revealed low-velocity Alborz and become E-W oriented further south in the interior of
zones at mid-crustal to subcrustal mantle depths directly beneath the central Iran. NE–SW fast-axes have also been observed by Sadid-
volcanoes, which could be related to their thermal source regions. khouy et al. (2008) in the southern flank of central Alborz east of
This structural setting can create a layered anisotropy at a local our region, and by Kaviani et al. (2009) farther east in the Kopet
scale and explain the smaller delay times in the regions of the two Dag Mountains of northeastern Iran. Sadeghi-Bagherabadi et al.
volcanoes. (2018a) and Sadidkhouy et al. (2008) attributed their observations
To summarize, the FPDs from the two data sets also show similar in the Alborz to the role of the asthenospheric flow field. Further
patterns. In NW Iran, and Talesh and the Alborz mountains, the west in eastern Turkey and in Anatolia, SK(K)S fast directions are
SK(K)S and S wave fast axes all trend NE–SW, with a difference dominated by a regional NE–SW trend (Sandvol et al. 2003 and
of less than 10◦ from the average in most of the stations. The fast Paul et al. 2014), subparallel with the direction of APM vectors.
axes of the S wave vary more gradually than those of the SK(K)S Various seismic tomography models and converted phases studies
wave. Significant differences in the FPDs of the two waves are ob- (e.g. Gök et al. 2007; Salaün et al. 2012; Kind et al. 2015; Confal
served at the stations located near the boundaries of central Iran or et al. 2020) have shown an anomalously low-velocity uppermost
in its interior. The SK(K)S waves, being a phase capable of sam- mantle and a thin lithospheric structure (i.e. 80–100 km) beneath
pling smaller lateral heterogeneities, have captured this difference. Anatolia. Spatial distribution of isotropic and anisotropic velocities
The S waves, on the other hand, are presumably less sensitive to in seismological observations/models has favored a hypothesis of an
small-scale variations of structure and thus vary more smoothly asthenospheric source region in Anatolia. Confal et al. (2018) suc-
across contrasting tectonic block boundaries. The S-derived FPDs cessfully reproduced the lateral variation of present-day anisotropy
in the central Iran part of Array differ from those in the Alborz by modelling the LPO, which develops in response to convectiveSeismic anisotropy and mantle deformation 1427
Downloaded from https://academic.oup.com/gji/article/226/2/1417/6270890 by Bibliothek des Wissenschaftsparks Albert Einstein user on 14 June 2021
Figure 7. Variations of splitting parameters with their error bars along the three seismic arrays. Black and red symbols represent the SK(K)S and direct S wave
measurements at each station, respectively. Solid purple lines represent the trends of APM. Solid black and red are the average splitting parameters in stations
located in NW Iran, Talesh, SCB and Alborz for SK(K)S and S derived, respectively. Solid blue lines show the LAB depth beneath each array.
mantle flow within a region covering the eastern Mediterranean and in central Iran. The western margin of central Iran is character-
Anatolia. The whole region stretching from Anatolia to northeast- ized by a strip of active shear zones that run parallel to the SSZ
ern Iran comprises the northern hinterland of the Arabia-Eurasia stretching from northwestern Iran to near the southeastern termi-
collision zone. Throughout this vast extent, the lithosphere is thin, nation of the Zagros Mountains. The North Tabriz and Soltanieh
and the FPDs thus show NE–SW trends with a remarkable degree fault zones and the set of faults south of the Buyin Zahra in our
of uniformity. Our observations combined with previous studies region of study (KNF and IPF) are part of these shear zones. Many
suggest that far north of the collision zone the anisotropic structure of the FPDs near these fault zones strike subparallel to them. Ka-
in the upper mantle is controlled by a coherent asthenospheric flow viani et al. (2009) in their analysis of anisotropy over the entire
field dominated by basal shear, resulting in broadly APM parallel Iran region (Fig. 1) observed that the SK(K)S fast axes are mostly
fast directions. subparallel with the dominant direction of shear inside the shear
In central Iran, most of the SK(K)S-derived fast directions trend zones of central Iran. They saw good correlations between patterns
NW–SE, which is sub-parallel to the major geological structures, of anisotropy and lithospheric deformation, and hence argued for
notably the strike-slip systems of the NTF, SF and KNF as well as a lithospheric origin of anisotropy. Fig. 1 shows the direction of
the regional trend of the UDMA. The fast axes rapidly rotate from maximum shear strain rate calculated from GPS vectors by Raeesi
range-perpendicular in NW Iran and the Alborz to range-parallel et al. (2017). The direction of shear in central Iran is consistently1428 S. Arvin et al.
NW–SE and subparallel with the active strike-slip fault zones in suggests a lack of strong anisotropic layering in the region. In the
the study area. It also matches with the direction SK(K)S-derived case of NW Iran and Alborz, the subcrustal mantle may not be
fast axes. The agreement between the pattern of geodetic and ge- able to form a strong layer to influence the observed anisotropy. In
ological finite strain in the crust and the finite strain of the mantle central Iran, sub-crustal anisotropy as inferred from Pn seems to be
as inferred from the SK(K)S splitting parameters implies that the stronger and its fast direction correlates better with the SK(K)S fast
dominant source of anisotropy resides inside the lithosphere. This axes. We have already argued that the SK(K)S splitting results in
suggestion is reaffirmed by the fact that the Zagros collision zone central Iran have a lithospheric origin. The match between the Pn
is a region of intense deformation and the central Iran lithosphere and SK(K)S fast directions, then implies that the entire thickness of
Downloaded from https://academic.oup.com/gji/article/226/2/1417/6270890 by Bibliothek des Wissenschaftsparks Albert Einstein user on 14 June 2021
is accommodating a significant part of the total strain. the mantle lithosphere undergoes a coherent deformation.
Sadeghi-Bagherabadi et al. (2018a) mapped the variations of
SK(K)S fast axes in central Iran from the Zagros to the edge of SCB
(Fig. 1) and showed a complicated pattern of fast axes where they C O N C LU S I O N S
repeatedly change from range-perpendicular to range-subparallel.
Based on this observed variability, Sadeghi-Bagherabadi et al. Our splitting measurements cover a part of the plateau region that
(2018b) put forward the alternative interpretation that the observed has formed on the back side of the Arabia–Eurasia collision zone,
anisotropy over central Iran mostly reflects the pattern of an astheno- and they reveal the details of the mantle flow field and the defor-
spheric flow field beneath a thin lithosphere affected by the keel of a mation of the upper plate of the collision. The majority of the delay
thick Zagros lithosphere and an edge-driven small-scale convective times for both direct S and SK(K)S phases are in the range of 1–
flow in the region of strong lithospheric thickness gradient. Specif- 1.5 s. These are within the high range of values for active continental
ically, they partially attributed the NW–SE fast orientations along regions (Silver 1996) and indicate that the mantle is undergoing in-
the NW margin of central Iran (coincident with our study area) tense deformation. The S and SK(K)S fast orientations are largely
to toroidal convective flow, which establishes a horizontal compo- in agreement with each other and map a NE–SW directed mantle
nent normal to the lithospheric gradient (Kaislaniemi & van Hunen flow field, approximately parallel to the APM direction. The smooth
2014). At the same time they acknowledged that those trends could variation of splitting parameters over most of the study region is an
also have their origin in the lithosphere. The small-scale mantle flow indication that they are unlikely to originate from shallow depths.
fields as described by Sadeghi-Bagherabadi et al. (2018b) imply that Furthermore, they do not correlate with surface geology, implying
asthenospheric anisotropy might be strongly localized and not give that the crust and mantle lithosphere probably do not make strong
rise to a coherent pattern, potentially allowing the lithospheric fab- anisotropic layers to significantly affect the observations. Also, the
ric arising from the shear zones to dominate over the anisotropy of thickness of the lithosphere in central Iran and the Alborz is less
the layer underneath it. than the average for continental lithosphere. As the lithosphere of
Several studies have investigated the azimuthal anisotropy of the Arabia and Eurasia move in the NE direction, the shearing of the
Pn velocity over the Iran region (Al-Lazki et al. 2004; Lü et al. asthenosphere at the base of the lithosphere creates olivine LPO
2012; Al-Lazki et al. 2014). All of them show a patchy pattern fabric in the asthenospheric mantle, which can explain our observa-
of variations of Pn anisotropy but in many regions a relation with tions. The SK(K)S waves sample comparatively narrower regions
surface geological structures can be identified. In NW Iran, the Pn around the stations than the S waves do, and so they are able to de-
fast direction has a dominant NE–SW orientation, very similar to tect potential changes in the anisotropic characters of neighbouring
the SK(K)S and S wave fast axes we have obtained on Array 1. In blocks, especially if those changes happen inside the lithosphere.
the western Alborz and the Tarom regions, Pn anisotropy is low- On this basis, the SK(K)S fast directions have captured the strong
intensity to negligible and its fast direction is overall E–W, which anisotropy that has developed inside the lithospheric shear zones on
does not match well with the NE–SW fast axes obtained from the the margins of central Iran where they locally obscure the effect of
shear wave splittings. In the central Iran part of our study area, Pn the asthenospheric flow field beneath, whereas the S waves remain
anisotropy shows more affinity with surface structures; south of the sensitive to the larger scale asthenospheric pattern. This can explain
Tarom Mountains the Pn fast directions trend NW–SE and in Buyin the systematic differences between the SK(K)S and S wave fast
Zahra and the mountains south of it they rotate to a more-or-less axes in the boundary region of central Iran with NW Iran and the
E–W direction. In these regions there is a broad agreement between Alborz. We should caution that this explanation is far from definite
Pn and SK(K)S fast direction. The S wave fast axes, however, match and needs further measurements and testing in the future.
less with the pattern of Pn directions. The Pn wave is sensitive to the
shallowest mantle and its anisotropy and therefore probes the current
or fossil deformation of the lithospheric mantle, unless the mantle D ATA A N D S O F T WA R E
lithosphere is absent or extremely thin. In NW Iran, the above- The shear waveforms used for splitting measurements, along with
mentioned studies have revealed low isotropic and anisotropic Pn station response information and the measurements in machine-
velocity anomalies. This region also has a very thin lithosphere, as readable form are available at https://doi.org/10.5880/GFZ.2.4.2021
thin as 70 km (see Fig. 1), and a crustal thickness of about 50 km. .004. SplitLab and RST codes are publicly available via http://splitt
These lines of evidence suggest that the mantle lid of NW Iran is ing.gm.univ-montp2.f r and https://github.com/f tilmann/multisplit.
very thin, and thus, Pn might be influenced by the deformation of the
asthenosphere, which would explain the observed match between
the fast direction of Pn and that of the mantle shear phases in NW
AC K N OW L E D G E M E N T S
Iran. In the western Alborz, the lithosphere is relatively thicker than
in NW Iran, but given that Pn anisotropy is not particularly strong This research was supported by several IASBS internal grants, and
in this region, lithospheric anisotropy does not seem to make a large the following NERC grants to Cambridge: NERC (Grant Ref:
contribution to the splitting measurements from the SK(K)S and S NE/J019895/1), IOF award NE/M017559/1, and RG73719–IAA
phases. The unimodal fast-axis distribution at most of the stations award NE/L012936/1. SA was supported by a scholarship from theYou can also read