Short-Term Energy Outlook Supplement: Drought Effects on California Electricity Generation and Western Power Markets - May 2022 - EIA
←
→
Page content transcription
If your browser does not render page correctly, please read the page content below

Short-Term Energy Outlook Supplement:
Drought Effects on California Electricity
Generation and Western Power Markets
May 2022

Independent Statistics & Analysis   U.S. Department of Energy
www.eia.gov                            Washington, DC 20585
This report was prepared by the U.S. Energy Information Administration (EIA), the statistical and
analytical agency within the U.S. Department of Energy. By law, EIA’s data, analyses, and forecasts
are independent of approval by any other officer or employee of the U.S. Government. The views in
this report should not be construed as representing those of the U.S. Department of Energy or other
federal agencies.

U.S. Energy Information Administration | STEO Supplement: The Impact of the California Drought on Western Power Markets   i

May 2022
Summary
Over the last decade, California has experienced more frequent and intense drought conditions, and is
currently in its third year of drought. Droughts limit water use in general and reduce hydropower in
particular. Current drought conditions in the state potentially have a significant impact on power
markets throughout the West, which could be different than in past years, given the state’s accelerating
growth in intermittent generating capacity and reliance on imports, which account for nearly one-third
of California’s power supply.
EIA's Short-Term Energy Outlook (STEO) forecasts for California hydroelectric generation currently rely
on a simple econometric model that assumes monthly generation in the future will mimic average
historical patterns. Because of the potential significant effects of changing water availability, in this
Supplement to STEO we evaluate an alternative approach to modeling hydropower that explicitly
includes hydrological variables and more precisely accounts for the impact of variable hydro conditions
on forecasts for the California region. This STEO Supplement focuses on the critical June 1–September
30 period (when electricity demand increases) and uses detailed information about water and reservoir
storage conditions to model the output of six major hydropower projects in California as a driver for
overall hydroelectric generation in the California electricity supply region.
We used this approach to compare the effects of two model scenarios on electricity markets:
Median case water conditions, defined as median water supply between 1980 and 2020
Drought case water conditions, representing the current year as of April 1
In our Drought case, we found that California’s summer hydroelectric share of generation mix was
nearly halved, falling from 15% to 8%. To offset the reduction in hydroelectric generation, California
purchases more electricity from neighboring markets and increases in-state natural gas generation,
which rises from 45% in the Median case to 50% of total summer generation mix in the Drought case. In
the Drought case, increased natural gas generation contributed to higher modeled wholesale electricity
prices, as well as an increase in CO2 emissions. The analysis in this STEO supplement focuses on the
drought’s effect on hydropower generation in California. Though the impact of drought on water-cooled
thermal power plants was not explicitly modeled here, it is not expected to have a significant near-term
effect on thermal generation in California.
Issues Overview
Relationship between drought conditions and hydroelectric generation
Drought conditions have intensified in California, although a few years have had higher-than-normal
precipitation (Figure 1). 1 During the last extended drought period (2012–16), all of California
experienced drought conditions for three consecutive years. Drought conditions ranged from
1Jeffrey Mount, Alvar Escriva-Bou, and Gokce Sencan (Public Policy Institute of California), Fact Sheet: Droughts in California,
April 2021.
U.S. Energy Information Administration | STEO Supplement: The Impact of the California Drought on Western Power Markets 1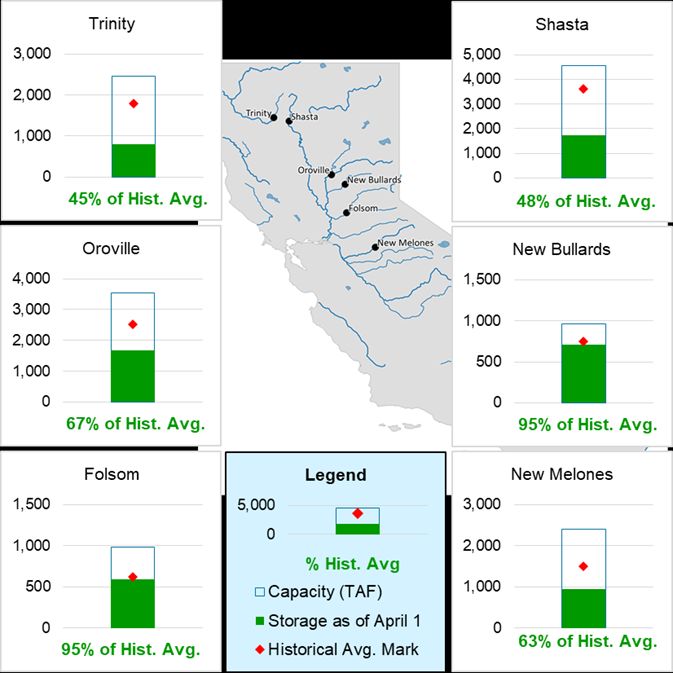
May 2022

abnormally dry (coded as D0 by the National Drought Mitigation Center) to exceptional drought (D4).
Code D0 drought impacts are mostly limited to farmers. Code D4 drought impacts include widespread
crop and pasture losses as well as potential water emergencies affecting industry and the general
population, given the reduced water supply in reservoirs and rivers. D4 is the most severe drought
category, according to the National Drought Mitigation Center.

Figure 1. California-Nevada areas reporting drought conditions (January 2011–February 2022)

Data source: U.S. Drought Monitor, jointly produced by the National Drought Mitigation Center (NDMC) at the University of
Nebraska-Lincoln, the United States Department of Agriculture, and the National Oceanic and Atmospheric Administration.
Graph courtesy of NDMC.

During 2017, above-normal precipitation significantly reduced drought severity, and exceptional drought
conditions did not appear again until October 2020. For 2021 the entire state was under some level of
drought. By August 2021, 41% of the state was classified experiencing exceptional drought (D4). Drought
conditions throughout the West resulted in lower hydroelectric generation in 2021 across the western
region. Hydroelectric generation in 2021 was 48% below the 10-year (2011-2020) average in California,
(Figure 2).2

2U.S. Energy Information Administration, Today in Energy, “Drought effects on hydroelectricity generation in western U.S.
differed by region in 2021,” March 30, 2022.

U.S. Energy Information Administration | STEO Supplement: The Impact of the California Drought on Western Power Markets          2
May 2022

Figure 2. Monthly hydroelectric generation, California (2011–2021)

Data source: U.S. Energy Information Administration, Electric Power Monthly

A comparison between Figure 1 and Figure 2 shows the relationship between drought conditions and
hydroelectric generation. In 2011 and 2017, a small portion of California was abnormally dry. Most of
the state experienced wet conditions resulting in greater-than-average California hydroelectric
generation. On the other hand, in 2014, 2015, and 2021, drought conditions were severe, and the
state’s hydroelectric generation fell below average.

Water supply in 2022

During the current water year, which began on October 1, 2021, and continues through September 30,
2022, California precipitation in the forms of rainfall and snow has been below normal. At the beginning
of the water year, some daily rainfall record highs were set. But in January 2022, the trend was reversed
when historically low rain and snow amounts were recorded from January through March. According to
the California Department of Water Resources, as of April 1, which is when snowpack typically reaches
peak levels, snowpack in Northern California was 26% of the normal level, while Central and Southern
California snowpacks were higher, each at 42% of the normal level. Less snow in the mountains means
that as temperatures begin to warm in the spring, less snow will melt and flow into California’s
reservoirs.

In many years, less inflow into reservoirs as a result of dry conditions is partially offset by releases of
stored reservoir water, mitigating reductions in hydroelectric generation due to drought conditions. In
2022, however, we do not expect that the effect of the drought will be eased by withdrawals from
storage because some of California’s largest reservoirs have below-average water storage levels. Many
of California’s reservoirs serve multiple purposes, and storage levels are managed over time primarily by
releasing water to meet environmental, agricultural, and urban water objectives rather than for
generating electricity.

U.S. Energy Information Administration | STEO Supplement: The Impact of the California Drought on Western Power Markets          3
May 2022

Hydropower plants, unlike other types of power plants, have dual functions. Hydropower plants provide
electricity and system reliability services to California’s electric grid, while also serving a key role in a
very complex, integrated system that delivers water for environmental, agricultural, and urban
demands. These demands vary within the state by sub-region and by water conditions and are often
competing, creating the need to regularly rebalance the water supply primarily among environmental,
agricultural, consumptive sectors, and, secondarily, the electricity sector.

Current reservoir storage is lower than the historical average at most reservoirs (Figure 3). On April 1,
California’s two largest reservoirs, Lake Shasta and Lake Oroville, were 48% and 67% of historical
average storage, respectively. Lake Shasta, which was completed in 1945, has only experienced one
year, 1977, when the reservoir storage was lower.

Figure 3. April 1, 2022 reservoir levels for California’s major hydropower plants

Data source: California Department of Water Resources, Current Reservoir Conditions

During drought years with lower-than-average storage levels, releasing water from storage increases the
possibility that the reservoir water level will drop to a point at which hydroelectric generation is no
longer feasible because the water level is lower than the point of entry into the facility. This situation
occurred in late 2021 at Lake Oroville. During the summer of 2021, the Oroville reservoir was drained to
the point that the adjacent hydropower plant, Edward C. Hyatt, had to go offline due to drought
conditions for the first time since it started operations in the 1940s. California subsequently experienced
a wet fall and early winter, enabling reservoir levels in Lake Oroville to rise from 22% of total storage

U.S. Energy Information Administration | STEO Supplement: The Impact of the California Drought on Western Power Markets          4
May 2022
capacity in October 2021 to 39% by January 2022, when the Edward C. Hyatt hydropower plant resumed
operations.
California has a Mediterranean climate,3 with wet winters and dry summers. While winter precipitation
creates most of California’s water supply, precipitation ranges from strong atmospheric rivers with large
masses of precipitation to periods of drought. Due to the precipitation uncertainty and because water
releases from reservoirs occur year round, hydrologists create water inflow forecasts daily for the
remainder of the water year to assist water managers in water release decision-making. Their water
supply forecasts capture existing conditions and future weather. Because most of the rain and snow for
the water year has typically fallen by April 1, the potential water supply that is available for summer
releases, when California is dry and the demand for water increases, is largely set by that date.
The 2022 water year has had lower-than-average precipitation and lower-than-average storage
reservoir levels, so California’s water supply is likely to be the lowest since 2011. Estimated water supply
for California is comprised of two components (Figure 4):
Reservoir storage as of April 1
Inflow, which includes the water from melting snow and precipitation falling from April 1
through the end of the water year on September 30
Figure 4. Water supply at major California reservoirs, March 31 storage and April through September
inflow
Data source: Storage data from the California Data Exchange Center and inflow forecast from the California Nevada River
Forecast Center
Notes: Data include storage and inflow data for Trinity, Shasta, Oroville, New Bullards Bar, Folsom, and New Melones
reservoirs. An acre-foot is the volume of water that will cover an area of one acre to a depth of one foot.
3
Kauffman, Eric. California Department of Fish and Game. “Climate and Topography,” in: Atlas of the Biodiversity of
California―Climate and Topography, October 2003. .
U.S. Energy Information Administration | STEO Supplement: The Impact of the California Drought on Western Power Markets 5May 2022
We calculated an April 1 total water supply using forecast April through September inflow and the April
1 storage totals at six key California storage reservoirs:
Trinity Lake
Shasta Lake
Lake Oroville
Folsom
New Bullards Bar Reservoir
New Melones Lake
For the 2022 water year, we used the median inflow forecast developed by the California Nevada River
Forecast Center (CNRFC) to represent the expected amount of additional inflow into reservoirs from
melting snow and future precipitation from April through September.
Changes in California’s electricity portfolio
California’s forecast water supply for 2022 is similar to the water supply in 2015, and both water years
were preceded by a dry year. As a result, 2015 is useful as a reference year for our current summer
California hydropower forecast. However, California’s generating capacity mix has changed since 2015.
In addition, the Western Energy Imbalance Market (WEIM), which is a voluntary real-time energy market
grew from 3 participants in 2015 to 19 participants in May of 2022. WEIM now covers large portions of
the western power market. Because of the changes in California’s generating portfolio and the growth in
the WEIM real-time energy market, the 2022 drought response will likely be different from 2015.
In recent years, California has shifted toward more solar and wind energy resources for electric power
generation and away from natural gas power plants. Since 2015, 58% of steam turbine natural gas units
have been retired, or 6,500 megawatts (MW). Solar capacity, on the other hand, has increased by 8,800
MW (157%) since 2015. The increase in intermittent renewable generating capacity and the decrease in
dispatchable resources (whose generation can ramp up or down to meet changes in system needs)
means that fewer conventional power plants are available to meet greater system needs. To mitigate
this situation, California has added significant battery storage capacity, growing from 11 MW in 2015 to
2,300 MW at the beginning of 2022. Batteries can provide system support to meet rapid changes in load
and generation when renewables generate more or less than expected.4 Even with California’s battery
capacity additions, however, the total share of dispatchable resources is lower in 2022 (Figure 5).
In addition, hydroelectric plants, which are also well suited for ramping up and down to offset changes
in renewable energy, will likely provide less of this operational flexibility this summer than in 2015 due
to lower reservoir storage levels and less water flow into reservoirs. Partially offsetting the reduction in
this operational flexibility is the accelerated growth of the WEIM. While WEIM began in 2014, over half
of the WEIM entities began participating in the past two years, and WEIM’s broad footprint adds both
load diversity and variable energy resource diversity. WEIM’s market characteristics also make it well
suited for integrating more intermittent resource energy into the grid. The market solves for every five-
minute interval, enabling a west-wide market solution to the intra-hour, generation variability of
4 U.S. Energy Information Administration, Battery Storage in the United States: An Update on Market Trends, August 2021.
U.S. Energy Information Administration | STEO Supplement: The Impact of the California Drought on Western Power Markets 6May 2022 intermittent resources and system load. In addition, because all participants submit offers into this automated market, WEIM provides a structure for solving each five-minute interval with lower cost resources. We expect that WEIM, given its expansion since 2015, will moderate the impact of drought conditions on the California electricity market and possible changes in emission levels this summer. Figure 5. California generating capacity Data source: U.S. Energy Information Administration, Preliminary Monthly Electric Generator Inventory Methodology In the analysis for this STEO Supplement, we evaluated an alternative approach to modeling hydropower that we plan to use in future STEO forecasts. This alternative approach reflects the effects of low water supply levels caused by persistent drought and other water demands on hydroelectric generation. The alternative modeling directly includes hydrological variables to more precisely account for drought conditions in our forecasts for California’s electricity generation. The STEO electricity model currently uses econometric equations for most regions including California that estimate the monthly average capacity factor of hydroelectric generators, then combine these capacity factors with expected capacity to forecast regional generation. For the May STEO, we made adjustments to the econometric-based forecast for California hydropower generation so that June– September generation totals 7 million megawatthours (MWh), similar to the modeled results from the Drought case in this Supplement. The one exception is the Northwest electricity supply region. For that region, the econometric equation for hydroelectric generation uses the water supply forecast from the Northwestern River Forecast Center for the Dalles Dam as an explanatory variable for region’s average capacity factors. We have found the operation patterns of the Dalles Dam to be well correlated with hydroelectric generation for the entire Northwest region. U.S. Energy Information Administration | STEO Supplement: The Impact of the California Drought on Western Power Markets 7
May 2022
The sustained drought in the western United States has demonstrated that precipitation and snowpack
conditions can vary significantly from normal conditions and that hydroelectric operations are affected
not just by current water conditions but also reservoir storage levels.
In this STEO Supplement, we present the results of our alternative modeling approach that focuses on
using detailed information about water conditions in the California electricity supply region, where the
current drought has significantly affected hydroelectric generation. Specifically, we focus on the
operation of six major hydropower projects in California (Figure 6):
Edward C. Hyatt Powerplant at Lake Oroville
New Melones Powerplant at New Melones Lake
Shasta Powerplant at Shasta Lake
Trinity Powerplant at Trinity Lake
Folsom Powerplant at Folsom Lake
Colgate Powerplant at New Bullards Bar Reservoir
These six projects accounted for 22% of total California hydroelectric generation in the previous five
years (2017-2021).
Figure 6. Selected major California hydropower plants
Data source: U.S. Energy Information Administration, Preliminary Monthly Electric Generator Inventory
With hydroelectric power plants, flowing or falling water turns a turbine, which turns a generator and
creates electricity. For hydropower projects that obtain their energy from falling water, such as the ones
that we have modeled, two main factors determine the maximum amount of power. The first is the
volume of water flow and the second is the head, which is measured by the distance that the water falls
from the reservoir surface to the turbines (Figure 7).
U.S. Energy Information Administration | STEO Supplement: The Impact of the California Drought on Western Power Markets 8May 2022 We develop detailed generation forecasts for each of these six hydropower plants using water supply forecasts from the California-Nevada River Forecast Center and reservoir storage data from the California Data Exchange Center. The UPLAN production cost model component of the Short Term Integrated Forecasting System that we use for developing the STEO electricity supply forecasts includes a feature for incorporating natural inflow to each project along with initial reservoir inventory. The UPLAN model then uses this information (along with project characteristics such as minimum and maximum outflow limits, reservoir capacity, head height, and power efficiency) to produce forecasts of hourly generation from each hydropower project. Input assumptions for all other aspects of electricity supply in the region are based on forecasts published in the April 2022 STEO. The aggregated monthly generation forecasts for these selected hydropower units are then used to help develop estimated average monthly capacity factors for the remaining hydroelectric power plants in the California region, based on the historical correlation of generation between the two sets of hydroelectric generators. Figure 7. Key factors in hydropower plant design Source: U.S. Department of Energy, Office of Energy Efficiency & Renewable Energy Findings By comparing the results from the two scenarios, we have estimated the effect that drought conditions in California will have in the state and on the western power market. Our analysis shows that the reduction in hydroelectric generation will alter the generation mix in California, resulting in an increase in wholesale power prices in the West and higher carbon emissions. U.S. Energy Information Administration | STEO Supplement: The Impact of the California Drought on Western Power Markets 9
May 2022

Figure 8. Historical and forecast summer hydroelectric generation in California, Median case versus
Drought case, (June–September, 2011-2022)

Data source: U.S. Energy Information Administration, Form EIA-923 data and Short-Term Integrated Forecasting System

We found that California’s total summer hydroelectric generation (from June to September) in 2022
would fall from 13 million MWh in the Median case to 7 million MWh in the Drought case, a 48% drop in
hydroelectric generation and comparable to generation in 2015 (Figure 8). As a result, hydroelectric
generation’s share of total summer generation falls from 15% in the Median case to 8% in the Drought
case (Figure 9).

The replacement power to make up for the reduced hydroelectric generation is about evenly divided
between an increase in out-of-state market purchases and in-state natural gas generation. In-state
natural gas generation in the Drought case is 8% higher than the Median Case, with the natural gas
share of generation rising from 45% to 50% of total summer generation to make up for the reduced
share from hydropower.

Given identical load between the two cases, the additional rise in natural gas generation in California
leaves 2.9 million MWh to be made up by imported power. Although California already makes out-of-
state market purchases to meet one-third of its electricity demand, WEIM provides another opportunity
to import electricity. The real-time nature of WEIM matches well with California’s greater need for
resources that can respond quickly to the within-the-hour-generation variability characteristic of solar
and wind resources.

U.S. Energy Information Administration | STEO Supplement: The Impact of the California Drought on Western Power Markets         10
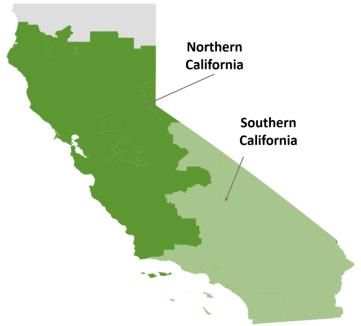
May 2022

Figure 9. Forecast June–September 2022 California generation mix, Median case versus Drought case

Data source: U.S. Energy Information Administration, Short-Term Integrated Forecasting System

Wholesale power price impact
Because the potential generation from low-cost energy sources such as hydropower is limited under
drought conditions, wholesale electricity prices are affected when higher cost resources are dispatched
to make up for the difference.

Our analysis showed that all summer electricity prices in California increase under a drought scenario.
The California power market is divided into two large regions along a north-south axis, (see inset Figure
10): Northern California (which includes the NP-15 region), and Southern California (which includes the
SP-15 region). Replacing low-cost hydroelectric power necessitates a shift to more expensive natural
gas generators and out-of-state power suppliers. As a result, on-peak prices in Northern California,
where most of California hydroelectric plants are located, increased by 7% relative to the Median case,
while Southern California on-peak prices are 5% higher (Figure 10).

From our analysis, we also found that prices in the neighboring power markets, Arizona and the
Northwest, increased in the Drought case as well. Summer on-peak prices increased by 5% in the
Northwest and 3% in Arizona. We forecast higher prices in neighboring power markets because less
available hydropower in California means California will need to import more electricity into the state
from neighboring regions, which puts pressure on power supplies in those markets. Although Arizona
and Nevada are also experiencing drought conditions, we did not include the effect of drought outside
of California in this analysis. If we had included other regions, price increases in Southern California and
Arizona would have been higher. We also did not include potential demand response to the higher
prices in California or elsewhere in the West. Such demand response could lower the need for
replacement power and resulting price impacts.

U.S. Energy Information Administration | STEO Supplement: The Impact of the California Drought on Western Power Markets         11
May 2022

Figure 10. Forecast impact on summer 2022 wholesale electricity price by power market region, on-
peak Median case versus Drought case, (June–September)

Data source: U.S. Energy Information Administration, Short-Term Integrated Forecasting System

CO2 emissions impact
As a result of the forecast greater use of natural gas generation in the Drought case, we expect CO2
emissions attributable to California’s summer electric demand to be 6% higher than in the Median case,
representing an additional 978,000 tons of CO2 (Figure 11). In the Drought case, CO2 emissions in the
Southern California area increase by 8% during the summer, and CO2 emissions increase by 4% in
Northern California during those same months, compared with the Median case.

Figure 11. Forecast impact on summer 2022 California CO2 emissions by month, Median case versus
Drought case, (June–September)

Data source: U.S. Energy Information Administration, Short-Term Integrated Forecasting System

U.S. Energy Information Administration | STEO Supplement: The Impact of the California Drought on Western Power Markets         12
You can also read