SIGN LANGUAGE INTERPRETING ON TV: A RECEPTION STUDY OF VISUAL SCREEN EXPLORATION IN DEAF SIGNING USERS1 - RUA
←
→
Page content transcription
If your browser does not render page correctly, please read the page content below
Recibido / Received: 31/05/2019
Aceptado / Accepted: 29/09/2019
Para enlazar con este artículo / To link to this article:
https://doi.org/10.6035/MonTI.2020.12.04
Para citar este artículo / To cite this article:
Bosch-Baliarda, Marta; Olga Soler-Vilageliu & Pilar Orero. (2020) “Sign language interpreting on TV: a
reception study of visual screen exploration in deaf signing users.” In: Richart-Marset, Mabel & Francesca
Calamita (eds.) 2020. Traducción y Accesibilidad en los medios de comunicación: de la teoría a la práctica /
Translation and Media Accessibility: from Theory to Practice. MonTI 12, pp. 108-143.

            SIGN LANGUAGE INTERPRETING ON TV:
            A RECEPTION STUDY OF VISUAL SCREEN
            EXPLORATION IN DEAF SIGNING USERS1
                                                                    Marta Bosch-Baliarda2
                                                                               Marta.Bosc@uab.cat
                                                                Universitat Autònoma de Barcelona

                                                                      Olga Soler-Vilageliu
                                                                                Olga.Soler@uab.cat
                                                                Universitat Autònoma de Barcelona

                                                                                        Pilar Orero
                                                                               Pilar.Orero@uab.cat
                                                                Universitat Autònoma de Barcelona

1. Acknowledgments: We gratefully acknowledge: Vanessa Beroy, Noelia Hernández and
    Sílvia Pujol for the translation and adaptation of the signed versions; RTVE, the Spanish
    Radio and Television Corporation, and WEBVISUAL TV for video production; Juan
    Pedro López-Velasco and Carlos Alberto Martín-Edo for video post-production and
    developing the technical implementation and delivery system for the questionnaire;
    Idoia Vallverdú-Segura for the graphic design of figures 1 - 4 and 7; FESOCA, the
    National Association of the Deaf in Catalonia, and CNLSE, the Centre for Language
    Normalization of Spanish Sign Language, for their collaboration and support.
2. All authors are TransMedia Catalonia members (2017SGR113, 2017). This research has
    been conducted in the Department of Translation and Interpretation in the Autonomous
    University of Barcelona (UAB) within the PhD program in Translation and Intercultural
    Studies. This research has been partially funded by the H2020 projects ImAc grant no.
    761974 and EasyTV grant no. 761999.

                 Esta obra está bajo una licencia de Creative Commons Reconocimiento 4.0 Internacional.

                   MonTI 12 (2020: 108-143) | ISSN-e: 1989-9335 | ISSN: 1889-4178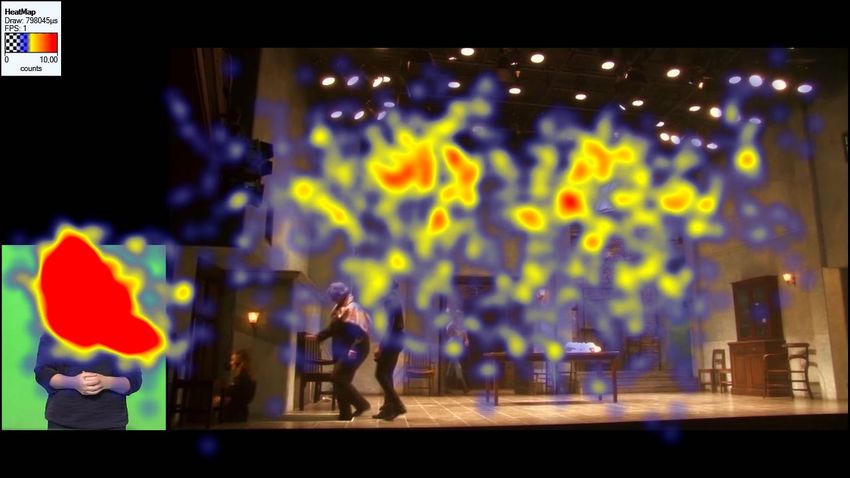
Sign language interpreting on TV: a reception study of visual screen exploration... 109

Abstract
We studied how sign language users responded to a screen composition including a
larger screen for the content and a smaller screen for the sign language interpreter.
32 deaf users participated in this experiment, watching four similar clips with four
different screen compositions. We registered the pattern of screen exploration with
Eye Tracker, and we assessed content recall with two questionnaires. Our results
show that sign language users mainly look at the sign language interpreter screen.
Participants tend to look more often and for longer time at the SLI side closer to the
main screen. Results are interpreted in terms of perceptual strategies developed by
Sign Language users.
Keywords: Sign language interpreting; Accessibility for the deaf; Access in HBBTV;
Service quality; Eye-tracking.

Resum
Hem estudiat com els usuaris de llengua de signes (LS) exploren una composició de
pantalla formada per una pantalla gran per al contingut i una de petita per a l’ILS.
32 usuaris sords han vist quatre clips similars amb quatre composicions de pantalla
diferents. Hem registrat l’exploració de pantalla amb Eye Tracker i avaluat el record
amb dos qüestionaris. Els resultats mostren que els usuaris miren principalment la
pantalla de l’ILS i tendeixen a mirar més sovint i més estona el costat de l’ILS més
proper a la pantalla principal. Els resultats s’interpreten en termes d’estratègies per-
ceptives desenvolupades pels usuaris de LS.
Keywords: Interpretació en llengua de signes; Accessibilitat per a sords;
Accessibilitat en la televisió connectada; Qualitat dels serveis; Moviments oculars.

1. Towards the accessibility of sign language in media platforms
Sign language interpretation (SLI) made its appearance on TV around 1950
(Ladd 2007) and is thus considered one of three mature TV accessibility
services along with subtitling and audio description (European Commission
2010; European Parliament 2010; European Parliament 2015; Looms 2009).
There are also some newer, hybrid accessibility services, such as audio sub-
titling, and easy to read subtitles or audio description, often offered with
personalisation options (Bernabé & Orero forthcoming). Some more recent
accessibility services to arise include clean audio and the numerous possibili-
ties offered through personalisation options (Mas & Orero 2018). Technology

               MonTI 12 (2020: 108-143) | ISSN-e: 1989-9335 | ISSN: 1889-4178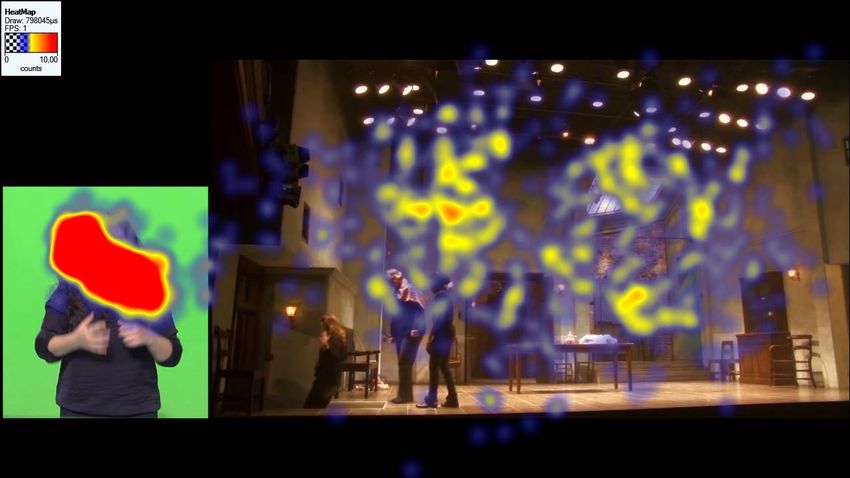
110                          Bosch-Baliarda, Marta; Olga Soler-Vilageliu & Pilar Orero

and end user lobbying are the two forces behind the development and main-
streaming of accessibility services.
     The latest technological advances have contributed to an increase in
informative, social and cultural content, transmitted through various media
platforms. The new TV formats (Digital TV —DTV— and more recently
Hybrid-Broadcast-Broadband —HbbTV or Smart TV) are mixed formats that
combine TV broadcasting with Internet broadband access. These more recent
formats allow the customisation of content and in particular, open up new
possibilities to deploy personalised, synchronised access services, which are
crucial to grant accessibility to information broadcasting (Martín, Orero,
Menéndez & Cisneros 2015). Validating the optimal parameters for any per-
sonalised access service implementation is key to ensure best practice in
future commercial use and to provide guidance to broadcasters deploying
the services. However, as for SLI it is still unclear which formal parameters
are to be implemented to fully explore the possibilities of its customization,
that grant quality sign language access services and equal rights in media
accessibility for sign language users.
     The provision of accessible audiovisual media services in Europe is cov-
ered by the European Audiovisual Media Services Directive. Article 46 of the
directive states that access to audiovisual media forms part of the “right of
persons with a disability and of the elderly to participate and be integrated
in the social and cultural life of the Union” and specifies that “the means to
achieve accessibility should include, but need not be limited to, sign language,
subtitling [and] audio-description.” Also according to article 7 of the Audio
Visual Media Standard Definition (AVMSD), “Member States shall encourage
media service providers under their jurisdiction to ensure that their services
are gradually made accessible to people with a visual or hearing disability.” It
is then up to each member state to gradually make appropriate services avail-
able, with a view to reaching targets of 100% for subtitling of public-service
broadcasting, and 10% for both audio description and sign language.

1.1. Sign language interpreting on television
Stakeholders have devoted many efforts towards attaining information access
(Orero et al. 2014). Deaf and hard-of-hearing people are active advocates of

              MonTI 12 (2020: 108-143) | ISSN-e: 1989-9335 | ISSN: 1889-4178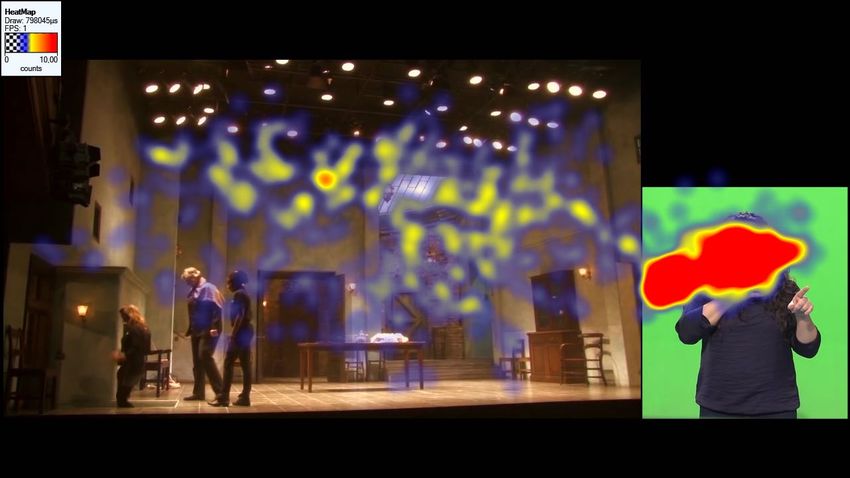
Sign language interpreting on TV: a reception study of visual screen exploration... 111

their language and cultural rights. Pursuing this goal and promoting develop-
ment and improvement of services to access audio-visual content —namely,
subtitling and sign language services. Traditionally, broadcasters preferred
subtitling over sign language, arguing that it was more cost effective and that
it allowed them to reach the entire target group of deaf and hearing-impaired
persons (Grbić 2002 as cited in Kurz & Mikulasek 2004: 83). However, sign
language communities strove (and are still striving) for their language rights;
to grant full accessibility and the provision of access to media in sign language
too. In Europe, a present example of this long advocating tradition can be
found in the ongoing European Disability Strategy Survey organised by the
European Union of the Deaf to gather information from different deaf asso-
ciations within the EU (EUD 2019). The survey tackles specific questions on
the provision of sign language in public websites, public TV channels and TV
programmes. The goal is to create a document for the European Commission
detailing the real implementation of the strategy for deaf people as is actually
experienced by deaf communities across the EU.
     There are different ways to include sign language in TV programmes:
sign-presented programmes, or programmes showing deaf sign language users
as presenters, contributors or characters; and sign-interpreted or sign-trans-
lated broadcasts, as two ways to make the content of speech or other sounds
in the programmes available to sign language users (National Disability
Authority 2014). Traditionally, media sign interpreters have been native and
non-native hearing professionals, however deaf translators/interpreters have
been provisioned too, providing a better cultural match with the target audi-
ence (Allshop & Kyle 2008; De Meulder & Heyerick 2013; Duncan 1997;
Stone 2007; Stone & West 2012). Most broadcasters provide access through
sign language interpreting services on screen (CNLSE 2015: 15; NDCS, 2005:
5). Even though SLI made its first appearance on TV nearly 70 years ago, it
is still an underdeveloped and under-researched access service.
     The report from the European Broadcasting Union (EBU, 2016) and the
report from the European Regulators Group for Audiovisual Media Services
(ERGA, 2016) point towards the need to improve the current standard of
the service. On average, public broadcasters deliver sign language in 4% of
programmes, mostly daily news (EBU 2016: 40-41). When an accessibility
service has a limited number of broadcast hours, as is the case with sign

               MonTI 12 (2020: 108-143) | ISSN-e: 1989-9335 | ISSN: 1889-4178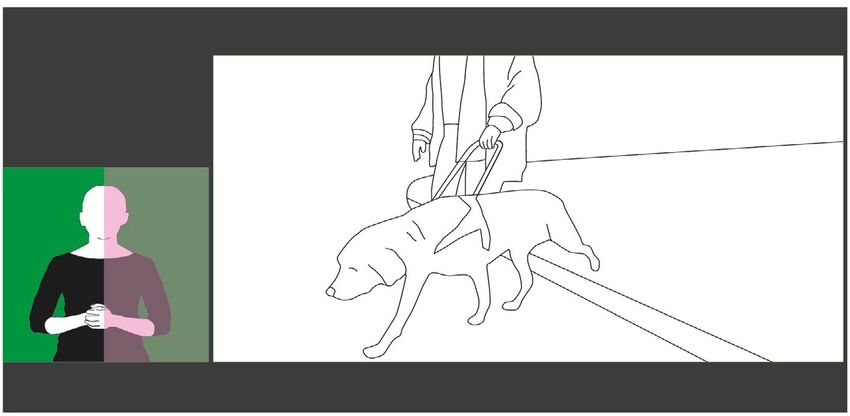
112                          Bosch-Baliarda, Marta; Olga Soler-Vilageliu & Pilar Orero

language services, it is important to prioritise the genre of the programme
since it has social implications and secures the full participation of citizens
in society and the fulfilment of equal rights (Geerts, Cesar & Bulterman
2008; Mäkipää & Hämesalo 1993: 9; NDCS 2005; Seleskovitch 1997: 562;
Steiner 1998). The Council of Europe recommends that “information on
daily politics, state developments and news should be made available to sign
language users. This should be secured by in-vision sign language interpreters
and subtitling in television; and/or by creating broadcasting formats/media
(on TV or the Internet) made by sign language users in sign language(s)”
(Krausneker 2008: 35).
     Furthermore, not all broadcasters observe the compliance norms deter-
mined by the governments. Public broadcasters are obliged to offer their
services to all citizens yet SLI is still not a mainstreamed accessibility service
for broadcasters when compared to subtitling (Kurz & Mikulasek 2004). For
example, in Spain the General Law on Audio-visual Communication (Spanish
Parliament 2010) determines that Spanish public TV broadcasters must offer
at least 10 hours/week of sign language, and commercial broadcasters must
offer at least 2 hours/week. Although the number of hours, and number of
broadcasters offering sign language access services has grown since the law
was passed, the minimum of sign language broadcast hours have not yet
been reached (CNLSE 2015; CNLSE 2017: 6; Utray & Gil Sabroso 2014).
Therefore, the targets concerning the quantity of SLI access services on TV
have not yet been met, but more crucially the quality of accessible content in
sign language in terms of on-screen representation has not been met either.

1.2. Sign language interpreter on-screen format
In addition to the limited broadcast time and variety of TV genres offered in
sign language, best practise guidance based on test results for this access ser-
vice is also limited. Although some guidelines for broadcasters are available,
(CNLSE 2017; Independent Television Commission 2010; National Disability
Authority 2014; Ofcom 2007) they are somewhat tentative and sometimes
created from parallel issues that have been recognised for other content access
services rather than research on sign language on TV (National Disability
Authority 2014). Nonetheless, the service user perspective on quality criteria

              MonTI 12 (2020: 108-143) | ISSN-e: 1989-9335 | ISSN: 1889-4178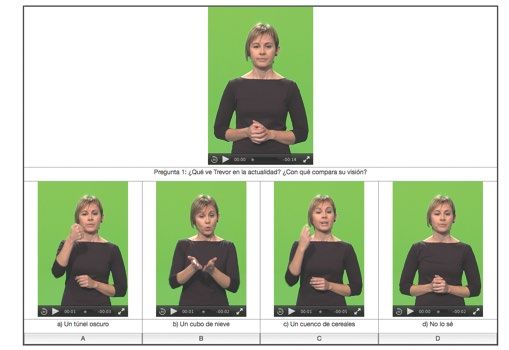
Sign language interpreting on TV: a reception study of visual screen exploration... 113

has gradually been introduced with results coming from both focus groups
and surveys with deaf audiences (Bosch-Baliarda, Orero & Soler-Vilageliu
forthcoming; DTV4ALL 2008; Gil Sabroso & Utray 2016; HBB4ALL 2017;
Kyle 2007; Steiner 1998; Xiao & Li 2013). In this respect, there are still central
questions to be answered in order to find quality criteria, which will establish
a good standard definition of SLI and offer an optimal service to the signing
audiences. Which parameters are chosen by different broadcasters to deploy
the SLI service? How can we define them? And, which are the best to deploy
an optimal service?
     In a survey carried out at our university, Redón (2014) found remarkable
differences between 100 different broadcasters all over the world regarding
size, shape and position on screen of the sign language interpreter. Soler-
Vilageliu, Bosch-Baliarda & Orero (2015) identified within this sample sev-
eral format parameters that differed among broadcasters: type of on-screen
insertion (picture-in-picture / half screen (split screen) / Chroma key); shot
size (long shot / medium long shot / mid shot / medium close-up; interpreter’s
clothing colour (plain light colour / plain dark colour / patterned or multi-
coloured); size of the interpreter’s screen (small / medium / large); on-screen
positioning of the interpreter (right / left, top / centre / bottom); position of
the interpreter (standing / seated).
     Subsequently, these authors surveyed two focus groups in order to find
out which parameters were relevant for the consumers of TV sign language
interpreting (Bosch-Baliarda, Orero, Soler-Vilageliu forthcoming). The par-
ticipants were deaf sign language users that belonged to various Catalan
Deaf Associations. All participants felt that sign language access services on
Catalan/Spanish TV did not meet quality standards, as they understood them,
in order to guarantee accessibility. It was their belief that Spanish broadcasters
simply included sign language in their programmes in order to comply with
regulations but had no interest in providing accessibility to sign language
users.
     This survey clarified the relevance of some parameters, while others were
considered irrelevant in terms of usability and quality of the SLI access ser-
vice. For example, users considered gender, age, appearance and position of
the interpreter to be of least importance. Whereas speed, size and colour com-
binations were the parameters that had a greater impact on screen legibility.

               MonTI 12 (2020: 108-143) | ISSN-e: 1989-9335 | ISSN: 1889-4178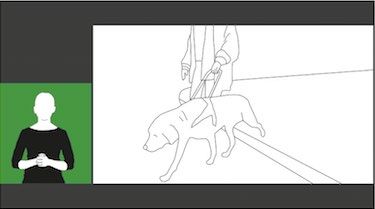
114                         Bosch-Baliarda, Marta; Olga Soler-Vilageliu & Pilar Orero

In order to guarantee a good contrast with the background, most participants
considered embedding the interpreter in a sub-screen with borderlines to be
better than chroma keying. Using this technique, the background colour can
be set to contrast with clothing and skin colour so that all three-dimensional
language details can be perceived accurately, prevent eye-fatigue and enhance
legibility.
    All participants considered that the most important on-screen parameter
to grant accessibility was the size of the interpreter’s window. Most of them
agreed that taking roughly a third of the split screen and using a medium
shot or a medium-large shot would be ideal for news broadcasts. However,
they acknowledged that it would not be appropriate for other television pro-
grammes, such as interviews, films or documentaries where a larger scene
screen was preferred.
    There was no agreement among the participants regarding the on-screen
position of the interpreter: some participants indicated that they did not
consider it to be an important parameter, some preferred left positioning over
right. This result contrasted with previous findings in which users reported to
prefer the interpreter to be located on the right side of the screen (DTV4all,
2008; Gil Sabroso & Utray, 2016). These contrasting results could be due to
frequency of exposure or the viewers’ habits. According to Gil Sabroso and
Utray, Spanish TV on-screen presentation is in the bottom right position in
90% of programmes, whereas the Catalan public broadcaster inserts the SLI
screen in a left position for its daily news programme. Catalan signers could
therefore be accustomed to reading the split screen including the SLI in both
on-screen positions. This result raised the question of whether on-screen
position user preferences were influenced by culture and consumption habits
or by more general, visual attentional behaviours. This information was used
to set up our experiment, which we describe in section 2. Before that, we
report briefly on previous research into eye movements and visual attention
in sign-language users.

1.3. Information processing in sign language perception
Watching TV with a split screen for SLI is a demanding task requiring skilled,
divided attention, that is, distributing attention between the two simultaneous

             MonTI 12 (2020: 108-143) | ISSN-e: 1989-9335 | ISSN: 1889-4178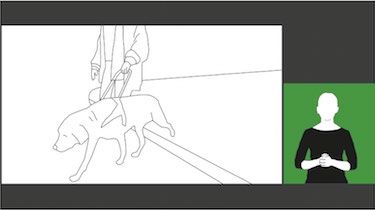
Sign language interpreting on TV: a reception study of visual screen exploration... 115

stimuli (Nebel et al. 2005: 760). Visual attention not only needs to be dis-
tributed between the two composites of the split screen, but also within the
SLI screen. Sign languages embody a complex, visual language input using
different body parts as active articulators to convey meaning, namely the
hands, facial features, the head and movable upper body parts (Sandler 2013).
The existence of two identical, active articulators is a unique characteristic of
the sign language modality. However, the hands exhibit different articulatory
behaviours and do not tend to act independently. One hand is the dominant
hand and is used as the manual, active articulator in one-handed signs an in
two-handed signs in which only one hand moves. The dominant hand is gen-
erally the preferred hand of the signer. The other hand, commonly referred to
as the non-dominant hand, may concur in the signal with different linguistic
domains (Sandler 2013). When used as a phonological unit in two-handed
signs, the non-dominant hand is either redundant or largely restricted in the
hand-shapes and movements it can exhibit (Battison 1978). Therefore, the
most visually salient articulators attracting visual attention would be the face
and the dominant hand.
     As Siple (1978) noted in her seminal paper ‘Visual constraints for Sign
Language Communication’, sign language users tend to fixate on the face of
their interlocutor. Although the hands carry the main lexical information in
sign language, the face conveys very important cues to the meaning of signed
utterances (Siple 1978: 96). Thus, according to Siple, signers look at the face
during their communication and follow hand movements with peripheral
vision. Later research in the literature was consistent with Siple’s previous
reports. Bavelier’s (2001) research supported the idea that deaf individu-
als rely more heavily on monitoring peripheral, visual space to detect new
information in their environment. Her results showed that deaf individuals
displayed a bias towards better performance in the peripheral field than the
central field, whereas hearing controls and hearing signers displayed the
opposite bias (Bavelier et al. 2001: 8934).
     Another visual processing feature that constitutes a specific, visual explo-
ration pattern for the deaf is found in the lateralisation of motion processing.
Bavelier et al.’s (2001) research showed left-hemisphere enhancement in the
deaf. Behavioural studies of motion processing indicated that deaf individuals
performed better in the right visual field (left hemisphere) than the left visual

               MonTI 12 (2020: 108-143) | ISSN-e: 1989-9335 | ISSN: 1889-4178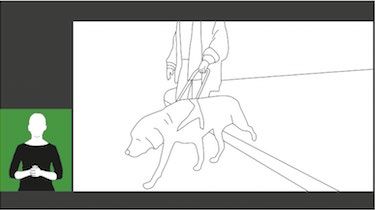
116                          Bosch-Baliarda, Marta; Olga Soler-Vilageliu & Pilar Orero

field (right hemisphere), whereas hearing individuals showed the opposite
pattern (Bavelier et al. 2001: 8937).
     More recent papers using eye-tracking devices also confirm Siple’s obser-
vations. Agrafiotis, Canagarajah, Bull & Dye (2003) studied the eye move-
ments of 11 British Sign Language users while watching four short narratives.
Their goal was to optimise the signal coding of the interpreter’s recording by
reducing the bit rate needed to transmit the video signal. They found that
users consistently focused their attention on the face and mouth of the inter-
preter and did not focus on their hands. This finding helped them to adopt a
foveated approach to sign language video coding that prioritises the quality of
the important areas (the interpreter’s head and mouth) and diminishes the bit
rate of the surrounding areas. Left-hemisphere superiority was also reported
for peripherally presented stimuli (Parasnis & Samar 1985).
     The finding of Agrafiotis et al. (2003) has been replicated by some other
studies. Letourneau & Mitchell (2011) compared the ocular fixations of hear-
ing people and deaf people, who tried to identify identity and emotions on
expressive faces. They were presented complete faces as well as upper halves
and lower halves of faces. These authors found that hearing people devoted
more attention to the upper halves in order to identify identity and emotion,
but deaf people devoted an equal amount of attention to the upper and lower
halves of the faces. Therefore, they concluded that deaf people develop a
specific visual exploration pattern.
     This finding has been replicated in a recent study by Dye, Seymour and
Hauser (2016), who pointed out that sign language users’ attention shifts to
the lower part of a visual scene. In their paper, the authors re-analysed the
data from a former experiment (Dye et al. 2009). Dye et al. (2009) found
evidence that both deaf adults and children (7-10 years of age) direct their
visual attention to the periphery of the visual field. The new data analysis of
2016 suggests that users of a visual-gestural language (both deaf and hear-
ing), favour a redistribution of visual attention to the inferior half of the
visual field. The authors claim that this redistribution of visual attention is an
adaptation that allows signers to focus their attention to the face in order to
gather important information about meaning and intention of the utterances
while, simultaneously following the information conveyed by the signing
hands with peripheral vision.

              MonTI 12 (2020: 108-143) | ISSN-e: 1989-9335 | ISSN: 1889-4178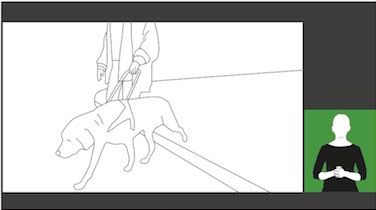
Sign language interpreting on TV: a reception study of visual screen exploration... 117

    However, these studies did not address the specifics of signing individuals
watching contents with a split screen. Wehrmeyer’s research (2014) pioneers
the use of eye tracking metrics. Her study describes the viewing patterns of
deaf and hearing users whilst they watch news broadcasts in a split screen
showing both sign language, in a right position, and subtitles, in a central
bottom position. As a main finding, her data indicates that deaf sign language
participants focus their attention primarily on the interpreter and secondly
on the imagery footage, but that they do not use subtitles or lip-reading to
access the news contents.

1.4. Study overview
The goal of this present research is to contribute towards establishing quality
criteria to help advance the deployment of SLI access services on TV in terms
of perception and usability. The study explores whether or not there is an
on-screen format, regarding size and position of the SLI split screen, that can
enhance screen legibility and content comprehension, or one that is preferred
or perceived as optimal by the users. To study this particular situation in
sign language, users could contribute to bettering the development of sign
language services offered by broadcasters.
     This experiment is part of the sign language pilot tests developed within
the European project Hybrid Broadcast Broadband for All (HBB4ALL) on
media accessibility. Our experiment was designed to parallel the pilots with
user tests on subtitling within the project (HBB4ALL 2017; Oliver Moreno
2017). In our experiment we wanted to explore whether watching SLI in
different, split screen configurations has any effect on information access.
     In the experiment the signing users watched four different parts of a doc-
umentary film that were edited using four controlled formats of split screen
configuration. The different formats varied on two counts regarding size and
position of the SLI sub-screen as independent variables: two sub-screen sizes
(Small: 1/5 of the screen width; Medium: 1/4 of the screen) and two positions
(right/left). See Figures 1 - 4 below.
     In addition, we recorded participants’ eye movements in order to collect
data from deaf signing users’ behavioural patterns regarding attention dis-
tribution, perception and information processing of stimuli on a split screen

               MonTI 12 (2020: 108-143) | ISSN-e: 1989-9335 | ISSN: 1889-4178
118 Bosch-Baliarda, Marta; Olga Soler-Vilageliu & Pilar Orero
displaying two types of information on each screen: (1) The sign language
interpreted, textual content on a sub-screen, and (2) the documentary scene
with non-verbal content on the main screen. After each clip, participants
responded to three sets of questions on visual, verbal memory (language
recall), visual, non-verbal memory (scene recall) and user preferences. The
scope of this present article focuses on the results from the eye tracking
measures and the recall tests only.
With these questionnaires we wanted to test user comprehension and
recall of language content and visual information from the clips, and check if
screen configuration had any effect on them. Is there any difference regarding
visual exploration and attention allocation on the screen in the four different
conditions? Do differences in attention allocation affect visual recall results
(both language and scene)? Do SLI size and/or position affect how users read
the on-screen sign language or comprehension and recall tasks? Are user
preferences affected by visual exploration behaviours?
Regarding eye tracking measures, we want to investigate if there are any
differences in visual behavioural patterns (number and duration of fixations
and visits), and in turn, between the four format conditions (size and posi-
tions). We predict that there is a difference in the eye tracking metrics between
the two parts of the split screen, SLI and Content screen. As previously found
in Wehrmeyer (2014), we predict that deaf users will focus their attention
primarily on the interpreter. Thus, the number and duration of fixations and
visits will be higher on the SLI screen than on the documentary scene screen.
As for the format conditions, we do not expect to find significant differences
in eye tracking metrics between the four formats; in this respect our study
is exploratory.
Although previous literature shows that attention is focused on the face
and meaningful information is accessed from the hands through peripheral
vision (Dye et al. 2009), we want to explore whether the visual, attentional
patterns within the SLI area differ in the right and left position conditions.
Left and right positions do not differ in the relative distance between the scene
and the face, as a source of linguistic information. However, when a right-
handed interpreter is displayed on the right side of the screen, their dominant
hand (the right hand) is more proximal to the scene screen whereas the left
hand is more proximal in the left conditions. We hypothesise that this will
MonTI 12 (2020: 108-143) | ISSN-e: 1989-9335 | ISSN: 1889-4178Sign language interpreting on TV: a reception study of visual screen exploration... 119
have an effect on the distribution of visual attention between the dominant
and non-dominant sides of the SLI. If the professional interpreter is right-
handed, we hypothesise that the number and duration of fixations and visits
will be higher on the ipsilateral SLI area, the side of the body including the
dominant hand (or H1).
Regarding the information recall measures, we want to explore if the
recall tests produce different scores, according to the different conditions. We
hypothesise that the size of the stimuli will produce differences. Our study
is exploratory on this matter.
As for the on-screen position, we hypothesise that there will be a differ-
ence in recall scores between right and left positions. We predict that our
participants will obtain higher visual recall scores when the scene screen is
located in the right visual field. This would be consistent with the reported
enhanced performance during motion visual tasks in the right visual field,
left-hemisphere bias (Bavelier et al. 2001).
2. The experimental reception study
2.1. Method
2.1.1. Participants
Participants in this study were 32 deaf sign language users (16 men/16 women)
from the metropolitan area of Barcelona. Their ages ranged from 17 to 76 years
(mean 40, STDEV 15). All of them reported using Catalan Sign Language
(Llengua de signes catalana, LSC) to communicate in everyday life. They were
recruited through the mailing list and social media of the National Association
of the Deaf (Federació Catalana de Persones Sordes, FESOCA) via a written and
signed video message with the help of deaf research facilitators. Two users
were removed from the experiment due to technical malfunctioning.
2.1.2. Material
2.1.2.1. Apparatus
An eye tracker, a Tobii T60 integrated into a 17-inch monitor run by a Toshiba
Portable personal computer was used to display the stimuli and record the
participants’ eye movements while watching the four picture-in-picture sign
MonTI 12 (2020: 108-143) | ISSN-e: 1989-9335 | ISSN: 1889-4178120 Bosch-Baliarda, Marta; Olga Soler-Vilageliu & Pilar Orero
language video clips. The Tobii T60 screen has a resolution of 1280x1024. It
has a sampling rate of 60Hz. The Tobii Pro Studio software for screen-based
eye trackers was used to prepare, administer and record the experiment and
for calculating eye tracking metrics and statistics. For statistical analysis and
data preparation we used SPSS.
In the analysis, two areas were taken into account in the eye tracking (ET)
metrics for the full duration of the clips: the area of interest (AOI) was drawn
on the full SLI rectangle area and the remainder of the screen was considered
scene (Not AOI). The SLI screen AOI was further divided into symmetrical
areas on a vertical axis, either side of the interpreter: namely the ipsilateral
side of the torso for the dominant side (H1) and the contralateral side of the
torso for the non-dominant side (H2).
Additionally, a MacBook Air personal computer was used to administer
and record the cross-modal, bilingual questionnaires.
2.1.2.2. Stimuli
Four clips were extracted from the English documentary film “Joining the
Dots” by Pablo Romero Fresco (2012). The rationale behind this choice was
that all selected clips would have a similar format, the same subject, and the
same characters. Each video clip lasted between 2 and 3 minutes (see Table
1). The clips were selected on the basis of meaningful content in the scene.
The translation/adaptation of the language content into LSC was carried out
by a small team which comprised three members: a deaf native signer and
two hearing, non-native, qualified signers. The Spanish subtitles created for
the subtitling pilot were used as the source text for the translation/adaptation
into LSC to allow full access to all team members (See Oliver Moreno (2017:
55) for a full description of the settings and design parameters for the source
subtitles).
The translation procedures included two translations made by the hearing
members which were later reviewed by the deaf consultant, who fine-tuned
them and indicated which clips should be further adapted. The final edit was
approved by all three members. The signing model for the translated docu-
mentary clips was a professional hearing interpreter, and a hearing signer, to
parallel the most common use signed content on TV. The sign language clips
were filmed following professional studio standards by the partner project
MonTI 12 (2020: 108-143) | ISSN-e: 1989-9335 | ISSN: 1889-4178Sign language interpreting on TV: a reception study of visual screen exploration... 121
organisation RTVE (Corporación de Radio y Televisión Española, the Spanish
public broadcaster). The signed version of the clips was recorded over the
voiced version of the subtitles to control the signing pace and later help with
synchronisation in post-production.
Number Words Words
Start and end Number
Clips Duration of per per
times of words
subtitles subtitle second
clip 1 00:00 - 03:10 03’ 08’’ (188’’) 297 47 6,31 1,58
clip 2 03:10 - 05:50 02’ 40’’ (160’’) 328 46 7,13 2,05
clip 3 05:50 - 08:50 03’ 00’’ (180’’) 289 45 6,42 1,61
clip 4 08:50 - 11:10 02’ 20’’ (140’’) 227 36 6,31 1,62
Table 1. Stimuli clips design from the documentary “Joining the dots”
The UPM partner team edited the clips and synchronised the sign language
interpretation clip with the documentary scene clip. Later they generated the
16 different clip stimuli combining the four split screen configuration formats
(see Figures 1 - 4) for the four video clips.
Figure 1. Illustration of the split screen configuration small size (1/5 of width screen)
and right position of SLI screen (format 1)
MonTI 12 (2020: 108-143) | ISSN-e: 1989-9335 | ISSN: 1889-4178122 Bosch-Baliarda, Marta; Olga Soler-Vilageliu & Pilar Orero
Figure 2. Illustration of the split screen configuration small size (1/5 of width screen)
and left position of SLI screen (format 2)
Figure 3. Illustration of the split screen configuration medium size (1/4 of width
screen) and right position of SLI screen (format 3)
MonTI 12 (2020: 108-143) | ISSN-e: 1989-9335 | ISSN: 1889-4178Sign language interpreting on TV: a reception study of visual screen exploration... 123
Figure 4. Illustration of the split screen configuration medium size (1/4 of width
screen) and left position of SLI screen (format 4)
2.1.2.3. Other
Informed consent forms and image release forms were available in video
format in LSC signed by a deaf, native signer to grant accessibility and in writ-
ing (Catalan and Spanish versions available) to be signed by the participant.
Four cross-modal, bilingual questionnaires (LSC / written Spanish) were
designed to be administered by the interviewer, using an innovative web-
based application developed in collaboration with the UPM partner team
(see Figure 5). This data collection tool was innovative because it used sign
language as the main language for accessing, understanding and evaluating
the information. The cross-modal, bilingual questionnaire was designed to
avoid subordination of sign language with respect to the written language so
that the same social and linguistic statuses were given to both modalities in
the experiment materials. Additionally, this design enhanced validity and reli-
ability of the results because it didn’t require the participants to sight-translate
the questionnaires in situ. It also gave a much more accurate and consistent
variety of language use between participants and throughout the experiment,
thus making it possible to obtain more reliable results.
MonTI 12 (2020: 108-143) | ISSN-e: 1989-9335 | ISSN: 1889-4178124 Bosch-Baliarda, Marta; Olga Soler-Vilageliu & Pilar Orero
Figure 5. Screenshot of a multiple-choice question from the web-based, cross-modal,
bilingual questionnaire.
The four questionnaires included: (1) the demographic data questionnaire,
including basic personal information, and data on language skills and TV
access service uses; (2) the sign language recall test (visual verbal memory),
including five questions on sign language content comprehension and recall
for each of the clips; (3) the scene/pictorial recall test (visual non-verbal
memory), including five questions on the content recall of the documen-
tary film imagery scene for each of the clips; and (4) user preference test,
including questions about the usability and user experience of each of the
conditions. The contents of the questionnaires were adapted from the sub-
titling pilot tests within the project (HBB4ALL 2017; Oliver Moreno 2017).
The translation/adaptation approach for the questionnaire items was a mixed
approach similar to the one described for the stimuli. However, the signing
model for the LSC was the deaf member of the translation team in order to
provide a better cultural and language concordance with the target language
users. For a more detailed description of the questionnaire design and the
MonTI 12 (2020: 108-143) | ISSN-e: 1989-9335 | ISSN: 1889-4178Sign language interpreting on TV: a reception study of visual screen exploration... 125
translation and adaptation approach of the survey items, see Bosch-Baliarda,
Soler-Vilageliu & Orero (2019).
2.1.3. Design
In this intra-subject study, each participant was shown four video clips from a
set of sixteen. The four clips were presented in the four conditions. The order
of presentation was varied randomly for the different participants, following
a latin-square design. After watching each clip, the participant was asked
to fill out three questionnaires: two on the clip information contents —one
on the clip scene contents for visual non-verbal recall; and another for the
sign-interpreted, textual contents for visual verbal recall— and one for users’
preferences. The eye movements of the participants were recorded for the
duration of the documentary clips in the different conditions.
The tested independent variables and conditions were:
–– Screen area: SLI versus Main Screen
–– Size of the SLI AOI (small = 1/4 of the total screen width; medium =
1/5 of the total screen width)
–– Position of the SLI AOI (right; left)
–– SLI screen format combination (format 1: small/right; format 2: small/
left; format 3: medium/right; format 4: medium/left)
–– Split SLI screen side: H1, H2
–– The dependent variables used were:
–– ET measures within the SLI AOI (number of fixations, number of
visits; mean duration of fixations, mean duration of visits)
–– Visual recall measures (score on language recall; score on scene recall)
2.1.4. Procedure
Users were individually tested in different local deaf association offices. In
every interview room there was a table and two chairs (one for the interviewer
and one for the interviewee). The participants were first welcomed by one of
the bilingual researchers. She outlined the test components and objectives.
Next, the consent form was signed and the demographics questionnaire com-
pleted using the cross-modal, bilingual, web-based questionnaire on a laptop
computer. The participants sat in front of the eye-tracker at roughly 60 cm
MonTI 12 (2020: 108-143) | ISSN-e: 1989-9335 | ISSN: 1889-4178126 Bosch-Baliarda, Marta; Olga Soler-Vilageliu & Pilar Orero
from the screen. After the standard 9-point calibration procedure, participants
were asked to watch the clips. After each visualisation they answered both
the linguistic and the visual memory questionnaires. The whole procedure
carried out on each participant lasted about one hour.
2.2. Results
In order to analyse our data, we mainly used General Linear Models with
repeated measures, that allowed us to compare the effect of different screen
settings on Eye tracker recorded measures (Fixation Count, Fixation Duration
Mean, Visit Count and Visit Duration Mean), on the Linguistic and Visual
accuracy of recall (tested with questionnaires).
2.2.1. ET measures
2.2.1.1. Effects of screen format and AOI on ET measures
This analysis explores the effect of Format (format 1: SLI screen size 1/5;
right, format 2: SLI screen size 1/5; left, format 3: SLI screen size 1/4; right,
and format 4: SLI screen size 1/4; left) and Area: SLI area (AOI) and Scene
screen area (Not AOI) on the above-mentioned ET measures. A summary of
the data can be found in Table 2.
Fixation Visit
Fixation Fixation Fixation Visit Visit Visit
Duration Duration
Count Count Duration Count Count Duration
Mean Mean
SLI Not AoI Mean SLI SLI Not AoI Mean SLI
Not AoI Not AoI
Format 1
181,3 101,7 ,56 ,18 28,0 28,4 6,64 1,35
Small/Right
Format 2
184,6 100,0 ,43 ,18 28,5 28,7 4,53 1,33
Small/Left
Format 3
Medium/ 164,1 107,8 ,58 ,19 27,8 28,0 4,95 4,01
Right
Format 4
Medium/ 189,5 91,9 ,46 ,19 26,8 27,1 5,31 1,12
Left
Table 2: Mean values of ET measures for SLI screen and Scene screen (Not AOI)
according to Format.
MonTI 12 (2020: 108-143) | ISSN-e: 1989-9335 | ISSN: 1889-4178Sign language interpreting on TV: a reception study of visual screen exploration... 127
The repeated measures analysis shows that the different formats do not
have any effect on the measures Fixation Count (F(3,81)= 342, p= .795; Partial
Eta squared= .12); Fixation Duration Mean (F(3,81)= 1.485, p= .225; Partial Eta
squared= .52); Visit Count (F(3,81)= .090, p= .965; Partial Eta squared= .003)
nor on Visit Duration Mean (F(3,81)= .674, p= .570; Partial Eta squared= .024).
However, there are significant differences for all ET measures in the two
areas (SLI screen /Scene screen): Fixation Count (F(1,27) = 23,231; p= .000;
Partial Eta Squared= . 462); Fixation Duration Mean (F(1,27) = 39,131; p= .000;
Partial Eta Squared= . 592); Visit Count (F(1,27) = 18,875; p= .000; Partial Eta
Squared= .411) and Visit Duration Mean (F(1,27) = 11,935; p= .002; Partial
Eta Squared= .307). No interactions of Format and Area were found for any
of the measures.
2.2.1.2. Effects of size and AOI on ET measures
As our findings did not show an effect on format, we decided to explore the
two components of Format separately: Size of the SLI screen (Medium and
Small) and Position of the SLI screen (Right or Left with respect to the Scene
screen). A summary of this data can be found in Table 3 below.
Fixation Fixation Visit Visit
Fixation Fixation Visit Visit
Duration Duration Duration Duration
Count Count Count Count
Mean Mean Mean Mean
SLI Not AoI SLI Not AoI
SLI Not AoI SLI Not AoI
Size Small 182,9 100,9 ,49 ,18 28,2 28,5 5,60 1,34
Medium 176,8 99,8 ,52 ,19 27,3 27,5 5,13 2,56
Position Right 173,0 104,7 ,57 ,19 27,9 28,2 5,83 2,63
Left 187,0 96,0 ,44 ,18 27,7 27,9 4,91 1,23
Table 3: Mean values of ET measures for SLI screen and Scene screen (Not AoI)
according to Size and Position.
The repeated measures analysis did not show any effect of SLI Size on the
measures Fixation Count (F(1,29)= .141; p= .710;Partial Eta Squared= .005);
Fixation Duration Mean (F(1,29)= .139; p= .712;Partial Eta Squared= .005); Visit
Count (F(1,29)= .937; p= .341; Partial Eta Squared= .031) nor on Visit Duration
Mean (F(3,81)= .347, p= .561; Partial Eta squared= .012).
MonTI 12 (2020: 108-143) | ISSN-e: 1989-9335 | ISSN: 1889-4178128 Bosch-Baliarda, Marta; Olga Soler-Vilageliu & Pilar Orero
The impact Area made was significant in all measures: Fixation Count:
F(1,29)= 21.028; p= .000; Partial Eta Squared= .420; Fixation Duration Mean:
F(1,29)= 37.999; p= .000; Partial Eta Squared= .567; Visit Count: F(1,29)= 12.293;
p= .001; Partial Eta Squared= .353; and Visit Duration Mean: F(1,29)= 15,833;
p= ,000; Partial Eta Squared= ,298. No interactions between Size and Area
were found for any of these measures.
2.2.1.3. Effects of position and area of interest on ET measures
The analysis of the effect of Position of the SLI screen regarding the Scene
screen did not show any significant differences in ET measures: Fixation
Count: F(1,31)= .006; p= .931, Partial Eta Squared= .000; Fixation Duration
Mean: F(1,31)= 3.262; p= .081, Partial Eta Squared= .095; Visit Count: F(1,31)=
.002; p= .961, Partial Eta Squared= .353; and Visit Duration Mean: F(1,31)=
2.266; p= .142; Partial Eta Squared= .068. Area had a clear effect on all meas-
ures: Fixation Count: F(1,31)= 22.984; p= .000, Partial Eta Squared= .426;
Fixation Duration Mean: F(1,31)= 37.137; p= .000, Partial Eta Squared= .545;
Visit Count: F(1,31)= 19.821; p= .000, Partial Eta Squared= .390; and Visit
Duration Mean: F(1,31)= 14.477; p= .001; Partial Eta Squared= .318. No inter-
actions between Position and Area were found for any of these measures.
2.2.1.4. Dominant hand and Position effects within the SLI screen on ET
measures
In order to examine visual attention given to the dominant hand on the visual
exploration of the screen, we split the SLI screen into ipsilateral (the dominant
hand side) and contralateral (the non-dominant hand) areas and compared
the ET measures obtained for both sides in relation to the position of the SLI
screen with respect to the Scene screen.
The repeated measures analysis did not show significant differences
for Fixation Count according to Position (F(1,30)= .174; p= .680; Partial Eta
Squared = .006) nor Dominant Hand side (F(1,30)= .544; p= .467; Partial Eta
Squared= .018). No interaction can be reported either.
Similar results are obtained for Fixation Duration Mean, according to
Position (F(1,30)= .084; p= .774; Partial Eta Squared= .003) and Dominant
MonTI 12 (2020: 108-143) | ISSN-e: 1989-9335 | ISSN: 1889-4178Sign language interpreting on TV: a reception study of visual screen exploration... 129
Hand side (F(1,30)= ,337; p= ,566; Partial Eta Squared= ,011). No interaction
was found either.
However, the analysis of the differences in Visit Count did show the statis-
tical significance of Position (F(1,30)= 4.375; p= .45; Partial Eta Squared= .127).
No effects were found concerning the Dominant/Non-dominant Hand side
(F(1,30)= .009; p= .924; Partial Eta Squared= .000), but there was a significant
interaction between Position and Hand Side (F(1,30)= 4.710; p= .038; Partial
Eta Squared= .136). The Dominant hand side received more visits when it
was placed at the Right of the Scene screen, while the contrary was found
for the Non-dominant hand side. This interaction is depicted in Figure 6.
Figure 6. Interaction between position of the SLI and visits received by each hand-side.
MonTI 12 (2020: 108-143) | ISSN-e: 1989-9335 | ISSN: 1889-4178130 Bosch-Baliarda, Marta; Olga Soler-Vilageliu & Pilar Orero
No effects were found for the Visit Duration mean measure, nor for Position
(F(1,30)= 1.345, p= .255; Partial Eta Squared= .043), nor Hand (F(1,30)= 1.558;
p= .222; Partial Eta Squared= .049.
2.2.2. Effects of format on language and scene recall results
A General Linear Model with repeated measures was carried again to test the
effects of the screen format on the scores obtained in both recall question-
naires. Values can be seen on Table 4.
We did not find effects of Format on Recall: F(3,84)= 1.921; p= .132; Partial
Eta Squared= .064, but we did find significant effects of type of recall: F(1, 28)=
10,783; p= .003; Partial Eta Squared= .278.
Format f1: Small/right f2 small/left f3 medium/right f4 medium/left
Mean St Dev Valid N Mean St Dev Valid N Mean St Dev Valid N Mean St Dev Valid N
Language
2.19 1.45 31 2.60 1.10 30 2.45 1.36 31 2.34 1.15 32
Recall
Scene Recall 1.52 1.06 31 1.73 1.28 30 1.94 1.21 31 2.34 1.18 32
Table 4. Mean scores obtained for the scene recall and language recall according to the
different screen formats.
Since scene recall and language recall are different, according to the repeated
measures analysis, we carried out planned comparisons between both scores
in each format. The results point out that mean scores for the scene recall
and the language recall are significantly different for f1(t(30)= 2.358; p= .025)
and for f2 (t(29)= 3.432; p= .002), in which language recall is better than scene
recall. For the scene recall in format f3 and f4, however, differences are not
significant (f3: t(30)= 1.609; p= .118; f4: t(31)= .000; p= 1).
We also carried planned comparisons within each type of test to com-
pare the results obtained for each format. T-tests show significant differences
between Scene recall scores obtained with Format 1 and Format 4 (t(30)= 3,233;
p= .003) and a trend of significance between Format 3 and Format 4 (t(30)=
1.995; p= .055). That is, Format 4 (medium/left) produces significantly better
results of the scene recall than Format 1 (small/right) and Format 3 (medium/
right). No significant differences were found for Language recall across formats.
MonTI 12 (2020: 108-143) | ISSN-e: 1989-9335 | ISSN: 1889-4178Sign language interpreting on TV: a reception study of visual screen exploration... 131
3. Discussion
Even though sign language access services on TV target hours have not yet
been met, SLI service broadcast hours have been growing over the past few
years. The goal of our study, under the scope of the HBB4ALL project, was to
provide experiments to support recommendations for broadcasters regarding
size and position of the SLI on screen.
In this reception study we researched the user’s visual behaviour and
information processing of sign-interpreted TV access service while watching
video clips in different split screen configurations. We recorded participants’
eye movements and scored their performance on memory questionnaires
about the language and scene content. Our purpose was to explore if differ-
ent split screen formats elicited differences in the way information content
on screen is processed. Although our experimental reception study is largely
exploratory we found some interesting findings that we discuss later.
We also carried planned comparisons within each type of test to com-
pare the results obtained for each format. T-tests show significant differences
between Scene recall scores obtained with Format 1 and Format 4 (t(30)=
3,233; p= .003) and a trend of significance between Format 3 and Format 4
(t(30)= 1.995; p= .055). That is, Format 4 (medium/left) produces significantly
better results for the scene recall than Format 1 (small/right) and Format 3
(medium/right).
Turning first to the ET data, regarding screen exploration in the four
different formats, we found that sign language users spent a longer time
watching the LS screen than the scene screen, independently of the split
screen format, the screen size or the SLI and the side of display. These results
on attention distribution among the different splits screens on the TV are con-
sistent with Wehrmeyer’s findings (2014) with news broadcasts. The repeated
measures analysis showed that the different formats, size and position con-
ditions do not have any effect on the ET measures. Likewise, no interactions
were found for any of the ET measures. We hypothesise that this consistency
among the different split screen variables and conditions might be related to
the nature of the content and also the task in our experiment, which was one
of the controlled variables in our clip design. In all the documentary video
clips, scene content and language content were relevant to task completion
and designed to be balanced among the different conditions.
MonTI 12 (2020: 108-143) | ISSN-e: 1989-9335 | ISSN: 1889-4178132 Bosch-Baliarda, Marta; Olga Soler-Vilageliu & Pilar Orero
Figure 7. Proximal contralateral side (shaded in pink) in format 4
With regard to the visual exploration of ipsilateral (H1) and contralateral
(H2) sides of the SLI area, the results show a difference between attention
distribution in the two position conditions, as predicted. However, our direc-
tional hypothesis is not confirmed: the number and duration of fixations
and visits is not higher for H1 SLI area in any position conditions. Although
the number of visits for H1 and H2 areas is the same, there is an interaction
between right/left positions and dominance side in the number of visits (see
Figure 6). Namely, the visit count is higher on the ipsilateral side (H1) of the
SLI area in the right positions, whereas it is higher on the contralateral side
(H2) of the SLI area for the left positions. Therefore, our results suggest that
deaf participants tend to focus their attention on the side of the SLI screen
that is more proximal to the scene screen, regardless of the hand dominance.
The shaded area in Figure 7 illustrates the proximal part of the SLI screen in
format 4 which is the part receiving most focused attention, in left positions
this side corresponds to the contralateral side of the interpreter. We hypothe-
sise that by focusing their attention on the proximal part of the SLI screen to
the scene screen, participants can include more information content within
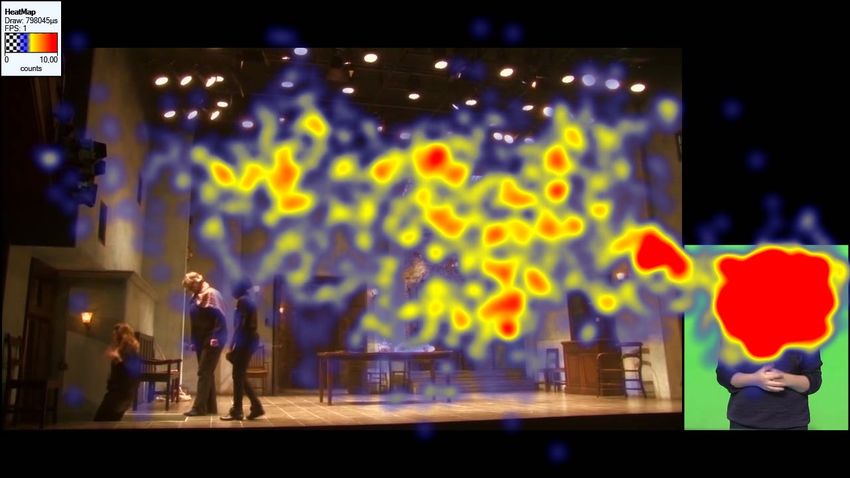
their peripheral visual field. The heat maps below in Figures 8 - 11 illustrate
the different foci of attention for the right/left conditions in the four split
screen formats.
MonTI 12 (2020: 108-143) | ISSN-e: 1989-9335 | ISSN: 1889-4178Sign language interpreting on TV: a reception study of visual screen exploration... 133
Figure 8. Format 1 gaze pattern heat map for all participants in clip 3
Figure 9. Format 2 gaze pattern heat map for all participants in clip 3
MonTI 12 (2020: 108-143) | ISSN-e: 1989-9335 | ISSN: 1889-4178134 Bosch-Baliarda, Marta; Olga Soler-Vilageliu & Pilar Orero
Figure 10. Format 3 gaze pattern heat map for all participants in clip 3
Figure 11. Format 4 gaze pattern heat map for all participants in clip 3
MonTI 12 (2020: 108-143) | ISSN-e: 1989-9335 | ISSN: 1889-4178Sign language interpreting on TV: a reception study of visual screen exploration... 135
Regarding the recall test results, our findings show that the responses to the
language recall tests are significantly more accurate than those of the scene
recall tests when the SLI appears in small formats, formats 1 and 2. However,
when the SLI screen size is medium, in formats 3 and 4, the differences in
scores between language and scene recall are not significant. We assume that
this contrast is associated with the size of the SLI screen. Although the focus
of attention is not evenly distributed between the two split screens, according
to ET metrics, the bigger size of the SLI screen probably allows for visual
attention to absorb the scene details, using the peripheral, visual perception
mentioned above.
Concerning the interaction between the recall scores and the four format
combinations, the results indicate that format is not significantly related to
language recall performance. However, there are differences regarding scene
recall scores, which are the highest in format 4, the format combining the
medium sized SLI screen in the left position, and the lowest in format 1,
combing a small sized SLI in the right position. Specifically, the data anal-
ysis indicates differences between format 4 and both of the other formats,
including the SLI screen on the right position. The results show a significant
difference between format 4 and format 1, and a trend of significance between
format 4 and format 3.
These recall results suggest that the format including an SLI medium
screen on the left is a good split screen configuration that facilitates infor-
mation recall from the scene screen. It is also the format with more balanced
mean scores between the language and scene recall tests. This finding suggests
that right visual field enhancement, or left-hemisphere bias (Bavelier et al.
2001), could also have an effect on complex visual information processing,
such as watching interpreted TV content on a split screen configuration.
However, this finding might also be showing effects of a bias in participant
sample. As our participants are all Catalan sign language users they might be
showing a learning effect, as the medium-size left-position SLI screen is the
format used in the daily news of the Catalan public broadcaster. Even though
this finding is internally valid for our research, more research is needed to
grant the external validity of the results.
MonTI 12 (2020: 108-143) | ISSN-e: 1989-9335 | ISSN: 1889-4178136 Bosch-Baliarda, Marta; Olga Soler-Vilageliu & Pilar Orero
4. Final remarks
This experimental reception study has shown how deaf sign language users
explore a sign-interpreted documentary on TV using a split screen configu-
ration. Although mostly exploratory in nature, the findings suggest that the
format used to deploy the service impacts the accessibility of information
contents, both textual and non-textual. The differences found in accuracy
recall of the documentary content have been associated with format condi-
tions, size and on-screen positioning.
Our findings suggest that including a SLI of medium size (1/4 of the TV
screen width) in a left position can contribute to better content access for
deaf sign language users. The results indicate that this screen configuration
encompasses the optimal formal parameters, enhancing screen legibility and
balancing comprehension to both language and scene content. Broadcasters
deploying SLI services should consider that the formal parameters choices do
not only affect aesthetics but have an impact on content accessibility.
As the application of eye tracking methods in SLI access services is still
fairly unexplored, future studies should endeavor to research other formal
parameters that may affect sign language processing, such as the use of
Chroma key or background colour, which may also impact on perception
and usability of the service. These factors might be crucial to improve media
experience not only for all members of the sign language communities, but
especially for those with a combined sensory loss such as deafblind sign
language users or the elderly.
More research is needed not only in order to study the formal parameters,
but also for different national sign languages, age groups, TV genres, signing
models and newer devices, in order to improve the quality of this access ser-
vice with a view to offering real personalisation options. We believe that to
guarantee equal rights in information accessibility and participation in society
for sign language communities, it is of the utmost importance to strive for
quantity and quality in media access services in sign language.
MonTI 12 (2020: 108-143) | ISSN-e: 1989-9335 | ISSN: 1889-4178You can also read