Software as a Service (SaaS) Report Autumn 2021 - Amazon S3
←
→
Page content transcription
If your browser does not render page correctly, please read the page content below

Software as a Service (SaaS)
Report Autumn 2021
AGENDA

    09.20   Redeye Introduction and Report

    09.30   Impero – Rikke Skov, CEO

    09.50   Penneo – Christian Stendevad, CEO

    10.10   Konsolidator – Claus Finderup Grove, CEO

    10.30   Short break

    10.40   SameSystem – Henrik Salicath, CEO

    11.00   Formpipe Software – Christian Sundin, CEO

    11.20   Mestro – Gustav Stenbeck, CEO

    11.40   Lunch break

    12.30   Litium – Patrik Settlin, CEO

    12.50   Artificial Solutions – Per Ottosson, CEO

    13.10   Modelon – Magnus Gäfert, CEO

    13.30   SleepCycle – Carl Johan Hederoth, CEO

    13.50   Short break

    14.00   Carasent – Dennis Höjer, CEO – Svein Martin Bjørnstad, CFO

    14.20   Safeture – Magnus Hultman, CEO

    14.40   Efecte – Niilo Fredrikson, CEO

    15.00   BIMobject – David Kullander, CRO

    15.20   Short Break

    15.30   Compodium – Charlotte Berg, CEO

    15.50   Hoylu – Stein Revelsby, CEO

    16.10   XM Reality – Jörgen Remmelg, CEO

    16.30   Goalplan – Markus Täkte, CEO

    16.50   The end

                                                                         REDEYE - SAAS REPORT 2021
2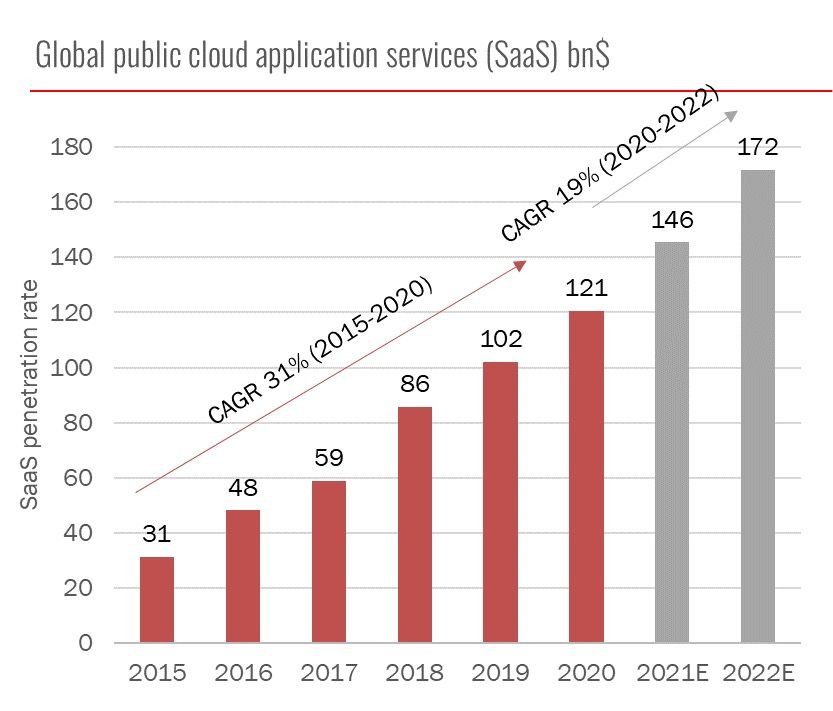
SAAS REPORT 2021

                            Table of contents

                            About Redeye                                            4

                            The Redeye Technology Team                              5

                            Transactions                                           8

                            Why invest in SaaS & the Cloud                         10
                               The BIG one: The shift to the Cloud                 11
                               Consumerization of IT                               11
                               The rise of subscription economy                    11
                               Investors and recurring revenue                     11

                            Software Overview                                      12
                               Large variations in SaaS adoption rates             12
                               Only 30% of IT spend heading for the Cloud          13
                               Solid growth trend expected to continue             13
                               Rule of 40 – when the best metrics are missing      14
                               Time to look at 2023                                15
                               2023E – A better proxy for underlying performance   16
                               Less Correlation as 2022 Approaches                 16
                               Strong Correlation Between EV/S and R40 Persists    17
                               Profitability Important in Lack of Proper Metrics   17
                               Net Revenue Retention                               19

                            SaaS Metrics                                           21

                            Nordic Public Metrics Benchmarks                       22

                            Covered Companies                                      24

                            Currently not covered companies at the event           48

                            Disclaimer                                             51

REDEYE - SAAS REPORT 2021
                                                                                                       3
ABOUT REDEYE RESEARCH-POWERED INVESTMENT BANKING
Leading Nordic Investment Bank
Leading Advisor for Growth Companies
Founded 1999 Corporate Broking 160+
Under supervision of the Swedish FSA 160+ public corporates as clients
Ownership Partner owned Corporate Finance 150+
150+ transactions executed over the last five years
Employees 65+ Key Specialties Tech & Life Science
Analysts: 25
Corporate Advisory: 20
Redeye.se 140,000+ Focused themes 10+
Attracting 140,000+ unique visitors monthly Includes 5G, AI, AR, Autotech, Cybersecurity, Disease of
the Brain, Envirotech, Fight Cancer, Digital Entertainment
and SaaS
Redeye Corporate Advisory
Leading Advisor for Growth Companies
Corporate Broking Corporate Finance
• In-depth research coverage – sector expertise • The go-to adviser for growth companies
• Investor events & activities • One of the most active advisors within the segment
• Create brand awareness, credibility and manage • Leading adviser within private and public transactions
expectations
• Highly skilled team with vast experience from private and
• Stratetgic advise regarding how to create the optimal public transactions
shareholder structure and build a strong and
well-positioned financial brand • Over 150+ executed transactions including IPO:s,
preferential rights issues, directed issues
Certified Adviser ECM
• Requirement for companies listed on Nasdaq First North • The most relevant investor network for growth companies
incl. Premier
• Matching companies with the right investors
• Ensures compliance with Nasdaq Rule Book
• Broad network of investors including institutional investors,
• CA-breakfast seminars and newsletters to ensure client family offices and retail investors
companies are up-to-date with the latest information and
hot topics
REDEYE - SAAS REPORT 2021
4w
THE REDEYE TECHNOLOGY TEAM
Erik Kramming
Client Manager & Head of Technology
Erik has a Master of Science in finance from Stockholm University. His previous work has included a position
at Handelsbanken Capital Markets. At Redeye, Erik works with Corporate Broking for the Technology team.
Greger Johansson
Client Manager & Co-head Technology
Greger has a background from the telecom industry, both from large companies as well as from entrepreneurial
companies in Sweden (Telia and Ericsson) and USA (Metricom). He also spent 15+ years in investment banking
(Nordea and Redeye). Furthermore, at Redeye Greger advise growth companies within the technology sector
on financing, equity storytelling and getting the right shareholders/investors (Corporate Broking). Coder for two
published C64-games. M.Sc.EE and M.Sc.Econ.
Johan Ekström
Client Manager
Johan has a Master of Science in finance from the Stockholm School of Economics, and has studied e-com-
merce and marketing at the MBA Haas School of Business, University of California, Berkeley. Johan has worked
as an equity portfolio manager at Alfa Bank and Gazprombank in Moscow, as a hedge fund manager at EME
Partners, and as an analyst and portfolio manager at Swedbank Robur. At Redeye, Johan works in the Corporate
Broking team with fundamental analysis and advisory in the tech sector.
Erik Rolander
Client Manager
Erik has a Master’s degree in finance from Linköpings Universitet. He has previously worked at Remium as a
tech analyst and product manager for the equity research platform Introduce.se, which today is owned by ABG
Sundal Collier. At Redeye, Erik works with Corporate Broking for the Technology team.
Niklas Blumenthal
Client Manager
Niklas has studied business administration at Uppsala University and has over 20 years of experience in the
financial market. He has previously worked as client manager at Nordnet, CMC Markets, Remium and ABG
Sundal Collier. At Redeye, Niklas works with Corporate Broking in both Technology and Life Science teams.
Gustav Olin Månsson
Client Manager
Gustav has a Master’s degree in business administration from Karlstad University. He has previously
worked at PwC as an auditor towards listed entities. At Redeye, Gustav works with Corporate Broking for
the Technology team.
REDEYE - SAAS REPORT 2021
5THE REDEYE TECHNOLOGY TEAM
Tomas Otterbeck
Head of Research
Tomas gained a Master’s degree in Business and Economics at Stockholm University. He also studied
Computing and Systems Science at the KTH Royal Institute of Technology. Tomas was previously responsible
for Redeye’s website for six years, during which time he developed its blog and community and was editor of its
digital stock exchange journal, Trends. Tomas also worked as a Business Intelligence consultant for over two
years.
Henrik Alveskog
Analyst
Henrik has an MBA from Stockholm University. He started his career in the industry in the mid-1990s.
After working for a couple of investment banks he came to Redeye, where he has celebrated 10 years
as an analyst.
Mattias Ehrenborg
Analyst
Mattias is an equity analyst within Redeye’s technology team, focusing on the renewable energy & cleantech
sector. He holds a BSc in Business and Economics from Uppsala University. Mattias has previously worked at
ABG Sundal Collier as a part of the Capital Goods team, primarily focusing on the renewable energy & cleantech
sector.
Douglas Forsling
Analyst
Douglas is an equity analyst in the technology team with a focus on the online gambling sector and fintech sec-
tor. He holds a Bachelor’s degree in finance and an unfinished Master’s degree in Operational Management and
Control from Stockholm University, School of Business. In addition, he has studied abroad in Hong Kong, Beijing,
and Oxford. He has had positions in SEB, Nordic Capital, and Danone. He has also produced a finance podcast
for nearly two years.
Forbes Goldman
Analyst
Forbes is an equity analyst within the technology team at Redeye. He holds a BSc in Business and
Economics from the Stockholm School of Economics and has also completed an academic exchange
semester in Mexico City.
Jesper Henrikson
Analyst
Jesper is an equity analyst in the technology team with a focus on telecom, automotive tech and more. He
holds a Master’s degree in Industrial Engineering and Management from Lund University, institute of technol-
ogy. In addition, he has studied abroad in Madrid. He has previously worked as an entrepreneur, management
consultant and business development manager at a B2B SaaS company. He has also run a stock-research blog
for nearly five years.
Mats Hyttinge
Analyst
Mats is an equity analyst in the technology & life science team at Redeye. He has an MBA and Bachelor degree
in Finance from USE in Monaco.
REDEYE - SAAS REPORT 2021
6THE REDEYE TECHNOLOGY TEAM
Fredrik Nilsson
Analyst
Fredrik is an equity analyst within Redeye’s technology team. He has an MSc in Finance from
University of Gothenburg and has previously worked as a tech-focused equity analyst at Remium.
Mark Siöstedt
Analyst
Mark has a Master’s degree in Accounting and Finance from Lund University. He has a dual role within
Redeye as an editor (quality assurance and Top Picks) and as an equity analyst on the technology team.
Danesh Zare
Analyst
Danesh has a Master’s degree in mechanical engineering from the Royal Institute of Technology. He has
previously worked as a Calculation Engineer for more than 6 years, holding positions at both Scania and Volvo
Trucks. He also produced a finance podcast for nearly two years. Danesh joined Redeye in 2020 and works as
an equity research analyst, covering companies in the tech-sector, with a focus on gaming companies
Niklas Sävås
Analyst
Niklas has more than ten years experience from the financial industry working within banking and financial
technology. He started his first company in 2016 focused on consultancy and investments. Niklas has a dual
role within Redeye where he splits his time between the podcast Investing By The Books, Redeye Academy and
as an analyst on the technology team. He has a bachelor degree in Business and Economics from SLU.
Hjalmar Ahlberg
Analyst
Hjalmar is an equity analyst within the technology team focusing on gaming and online gambling sectors.
He holds a Master’s degree in finance and has previously worked within the banking industry with focus on
equity research covering various sectors.
Jacob Svensson
Analyst
Jacob Svensson is an equity analyst within the technology team, focusing on software companies. He holds
a BSc in Business Administration and a Master’s in Finance from Lund University and has previously worked
within the banking industry and asset management.
Viktor Lindström
Analyst
Viktor is an equity analyst in the technology team, focusing on gaming and cleantech sectors. He holds a
Master’s degree in Finance from University of Gothenburg. Previously, he held positions at Carnegie Investment
Bank and Consensus Asset Management.
REDEYE - SAAS REPORT 2021
7Technology Selected Transactions
REDEYE - SAAS REPORT 2021
8TECHNOLOGY SELECTED TRANSACTIONS
RECENT
OCTOBER 2021 OCTOBER 2021 JULY 2021
IPO Private Placement Directed Issue
Completed Completed 45 MSEK
65 MSEK 124 MSEK
JULY 2021 MAY 2021 MAY 2021 APRIL 2021 FEBRUARY 2021
Directed Issue Rights Issue IPO Rights Issue Private Placement
15 MSEK 25 MSEK 60 MSEK 55 MSEK 60 MSEK
2017–2020
DECEMBER 2020
Private Placement
52 MSEK
NOVEMBER 2020 OCTOBER 2020 OCTOBER 2020 OCTOBER 2020 MARCH 2020
Directed Issue + Rights Issue Rights Issue Directed Issue Rights Issue Rights Issue
204 MSEK 50 MSEK 66 MSEK 57 MSEK 36 MSEK
DECEMBER 2019 NOVEMBER 2019 OCTOBER 2019 JUNE 2019 MAY 2019
Pre-IPO IPO Rights Issue Rights Issue Directed Issue + Rights Issue
18 MSEK 26 MSEK 51 MSEK 40 MSEK 139 MSEK
MAY 2019 APRIL 2019 APRIL 2019 MARCH 2019 JANUARY 2019
Rights Issue Dual Listing Rights Issue IPO IPO
Co-Lead Manager 10 MSEK 102 MSEK 80 MSEK Joint Bookrunner
135 MSEK 120 MSEK
NOVEMBER 2018 OCTOBER 2018 OCTOBER 2018 OCTOBER 2018 JUNE 2018
Rights Issue Direced Issue Directed Issue Right Issue Private Placement
25 MSEK 43 MSEK 21 MSEK 39 MSEK 108 MSEK
JUNE 2018 JUNE 2018 MAY 2018 APRIL 2018 FEBRUARY 2018
Rights Issue Private Placement IPO Private Placement Private Placement
Join Lead Manager 50 MSEK 30 MSEK 20 MSEK 20 MSEK
127 MSEK
NOVEMBER 2017 NOVEMBER 2017 NOVEMBER 2017 OCTOBER 2017 APRIL 2017
IPO IPO Private Placement 22 MSEK IPO
60 MSEK 180 MSEK 9 MSEK 60 MSEK
REDEYE - SAAS REPORT 2021
9Why invest in SaaS & the Cloud
In this report we dig deeper into:
• SaaS adoption rates by country and application vertical
• Cloud IT spending percentage
• Projected growth rates for SaaS
• Performance and Valuation of Nordic SaaS businesses
• Net Revenue Retention and its Importance
REDEYE - SAAS REPORT 2021
10SOFTWARE OVERVIEW
SaaS and Cloud companies provide investors the opportunity to benefit from ongoing secular growth
trends, including: Shift from on-premise enterprise infrastructure to the Cloud, Consumerization of IT,
and the rise of the subscription economy and investors craving for recurring revenue.
The BIG one: The shift to the Cloud Investors and recurring revenue
The big trend that shapes the Cloud industry is the shift What can be better than always starting with an almost full
from on-premise software spend to Cloud. This is a secular bucket every month? Well, according to investors, nothing
shift that has been ongoing for many years; however, the is better than recurring revenue. The SaaS pricing model
transformation is still in the early days within some verticals. creates:
The Cloud service, with the most substantial revenue, is the
application layer (SaaS). • Stability
• Predictability
Global Cloud Service Revenue (bn$) • High margins
Year ‘19 ‘20E ‘21E ‘22E • Lower business risk
BPaaS 45.21 46.07 51.03 55.54
PaaS 37.51 58.92 80.00 100.64 All the above factors are the reason why investors crave
SaaS 102.06 120.69 145.51 171.92 recurring revenue companies and price them high. In the
CLd. Mng & early days of SaaS, many market participants did not under-
12.84 22.66 25.99 29.74
sec. stand the model, with the argument that it’s better to have the
IaaS 44.46 64.29 91.54 121.62 money in the bank today than in the future. However, it has
DaaS 0.62 1.24 2.08 2.17 become apparent that the Life-time-value is much higher for
T o ta l 242.70 313.85 396.15 482.16 the same type of service when people or companies pay on
a recurring basis over a long time period. If the companies
Source: Gartner
Source: Gartner have the right type of structure on their offering, there will
also be significant upsell possibilities per client, which can be
compared to selling a one-time license to use a software with
Consumerization of IT a small support fee.
Another trend affecting the Cloud service industry is the
consumerization of IT. That means that the applications
used in work more resemble consumer tech products when
it comes to usability, UX and UI. This has also led to another
buying pattern within organizations as the buy decision many
times have become decentralized where the end-user of the
product might be the one who decides which service to use.
The rise of subscription economy
In many ways, Cloud technology is the enabler of the sub-
scription economy, but the consumer and user behavior
fuel the rise of subscription even further. The subscription
economy is a trend both within B2C and B2B but is extremely
apparent within the software market, where a focus has
shifted from providing a product to an ongoing service.
REDEYE - SAAS REPORT 2021
11SOFTWARE OVERVIEW
We have gathered Cloud service market data which highlights that in many areas, the shift to the Cloud is
just in its early days, the transition will continue for many years to come.
Large variations in SaaS adoption rates The difference in SaaS adoption among different types of
The adoption of SaaS among businesses in Europe varies software is even greater than the regional difference. Collabo-
substantially from country to country. The Nordic countries ration, Human Capital Management (HCM), and Customer
are frontrunners in the migration towards SaaS. All Nordic Relationship Management (CRM) are estimated to have a
countries had a penetration rate above 60% in 2018 – almost SaaS penetration of 70-80% this year. Thus, these software
twice the EU-28 average of 36%. Italy has taken a significant segments are arguably close to reaching maturity in terms of
leap in SaaS penetration since 2018 and is now just behind SaaS penetration. At the bottom, with estimated SaaS adop-
the Nordic countries. However, most southern European tion rates of below 10%, we find operations, manufacturing,
countries still have a penetration rate below 30%. and engineering-related software. Thus, industrial software is
lagging in SaaS adoption.
Interestingly, the increase in penetration from 2015 to 2020
Use of cloud computing services in Europe is, on average, expected to be larger in segments that had a
high adoption level in 2015. Thus, similar to the regions, the
2020 2018 gap between early adopters and laggards is expected to have
70%
increased since the mid-10s.
60%
SaaS penetration rate
50%
40% Global SaaS penetrations rate 2015-2020, by application
30%
90%
81% 2020E 2015
20% 80%
71% 69%
70%
SaaS penetration rate
10% 58% 60%
60%
49%
0% 50%
38% 36%
40%
30% 25% 24% 24% 24%
20% 12% 12% 14%
9%
10% 6% 6% 5%
2%
Source: Redeye Research, Eurostat 0%
Source: Redeye Research, Statista, IDC
REDEYE - SAAS REPORT 2021
12SOFTWARE OVERVIEW
Only 30% of IT spend heading for the Cloud Solid growth trend expected to continue
IT Spend
20%
46%
10%
20%
Other On-premises software SaaS IaaS/PaaS
Source: Redeye Research, Flexera, Statista
Source: Redeye Research, Statista, Gartne
While the adoption of SaaS is significant in several regions While Gartner expects a slowdown from an impressive CAGR
and segments, as mentioned before, only 30% of IT spend of 31% 2015-2020 – although, from low levels, SaaS growth
is currently allocated to the cloud (SaaS and IaaS/PaaS), is expected to remain healthy, as Gartner forecasts a 19%
according to Flexera. For comparison, 20% of IT spend is CAGR 2012-2022.
allocated to On-premises software, suggesting that SaaS
still can gain significant market shares. Given a current SaaS adoption of +60% in several software
segments and regions, SaaS has reached a more mature
state and slower – although still substantial – overall market
growth seems reasonable. However, in many software
segments and regions, the SaaS adoption rate is modest.
As mentioned earlier, EU28 had a SaaS penetration rate of
only 36% in 2020. The growth potential going forward is likely
to vary substantially depending on the software segment and
region.
REDEYE - SAAS REPORT 2021
13Rule of 40 – When the Best Metrics are Missing
Like for most companies, there is typically a tradeoff
between sales growth and profitability for SaaS businesses
as well. As a SaaS business has its customer acquisition
costs (CAC) upfront, while the revenues are recognized over
time, sales growth usually hurts margins even more for a
SaaS business. The best way to assess the underlying profit-
ability in growing SaaS businesses is to look at unit econom-
ics such as CAC and CAC-payback period and net revenue
retention. However, most listed Nordic SaaS businesses do
not disclose these figures. Thus, the “Rule of 40” is used
as a proxy for the listed SaaS businesses’ underlying unit
economics. Although, since our first SaaS report the number
of companies disclosing SaaS metrics have increased, and in
this report, we will look at the net revenue retention.
REDEYE - SAAS REPORT 2021
14SOFTWARE OVERVIEW
Time to Look at 2023E Rule of 40 2022E (November 2021)
50%
As we approach the end of 2021, we argue the 2021E figures ADMCM
40% FNOX
are irrelevant. First, it is packed with M&A affecting the
30% SMCRT
numbers. Second, equities are valued on future earnings not CARA
20% LIME
UPSALE PTRK
VITEC
past, and we would argue that professional investors, this FPIP
10%
EBIT margin
ANOD
time of year, are looking at 2022E and 2023E – or preferably EFECTELEADD
MRCEL
LITI
CSAM
VERT
0%
NORDH
on an even longer perspective, however, there are generally
-10%
no forecasts for 2024E and onwards at this time. -20% 247 CHECK
-30% PSKY SFTR XMR
PEXIP
Like regarding 2021E in our last report, the 2022E numbers -40% BIM PENNEO
are boosted by acquisitions in several companies. While -50%
0% 10% 20% 30% 40% 50% 60% 70% 80%
many companies have seen minor revisions only, several
Sales growth
companies that were expected to grow fast with rising
margins have seen its estimates being revised downwards. November 2021, Source: Redeye Research, Company reports, FactSet
In the defense of the analysts, in many cases us, small
changes in expected sales growth have a large impact on Rule of 40 2022E (April 2021)
margins as costs are fixed to a large degree. Thus, even
50%
slight revisions have a significant impact on a company’s
40% ADMCM
R40. FNOX
30%
LIME MRCEL CARA
20% VITEC UPSALE
EBIT margin
FPIP VERT
10% ZETA
ANOD BIM
EFECTELEADD LITI
0% 247
XMR
-10%
ZUTEC
-20%
-30% PEXIP SFTR
-40%
0% 10% 20% 30% 40% 50%
Sales growth
April 2021, Source: Redeye Research, Company reports, FactSet
A few outliers are not included in the figure, as their sales
growth is expected to be very high in percentage terms, main-
ly due to large acquisitions.
REDEYE - SAAS REPORT 2021
15SOFTWARE OVERVIEW
2022E – A better proxy for underlying performance Less Correlation as 2022 Approaches
As the 2023E forecasts, unlike 2022E, do not include any
EV/S vs Growth + EBIT m. 2022E (Nov. 2021)
significant contribution from acquisitions, we believe it is a 30 FNOX
better proxy for the expectations on the companies’ under-
lying sales growth and their performance relative to Rule of 25
40. Interestingly, but not very surprising as analysts, including CHECK
20
ourselves, tend to be optimistic, forecasters expect basically
EV/Sales
all companies to improve their underlying performance in 15
ADMCM
2023 relative to 2022 – this pattern was similar for 2021 VITEC
CARA
UPSALE BUSER
SMCRT
relative to 2022 in our last report. 10
PENNEO LIME
NORDH
R² = 0.1973
SFTR
PTRK
Rule of 40 2023E (November 2021) 5
EFECTE MRCEL CSAM
VERT
XMR LEADD
PEXIP 247 FPIP LITI
ANOD
50%
ADMCM 0
FNOX
40% -10% 10% 30% 50% 70%
SMCRT Sales growth + EBIT margin
30% CARA
LIME
20% VITEC UPSALELITI November 2021, Source: Redeye Research, Company reports, FactSet
FPIPMRCEL VERT
EBIT margin
10% ANOD EFECTE CSAM
LEADD
NORDH CHECK
0%
247 BUILD
SFTR EV/S vs Growth + EBIT m. 2022E (April 2021)
XMR
-10% PEXIP 20
BUSER FNOX
-20% PSKY BUSER
BIM
-30% PENNEO ADMCM
15
-40%
0% 10% 20% 30% 40% 50% 60% 70%
CARA
Sales growth
EV/Sales
10 LIME
UPSALE
November 2021, Source: Redeye Research, Company reports, FactSet
PEXIP VITEC
247 MRCEL
5 BIM
SFTR
ZUTECEFECTE XMR
LITI
FPIP LEADD
VERT
ANOD
ZETA
0
0% 20% 40% 60% 80%
Sales growth + EBIT margin
November 2021, Source: Redeye Research, Company reports, FactSet
While underlying forecasts (excluding M&A) have remained
largely unchanged, as mentioned earlier, valuations have
increased slightly relative to November 2020 for most com-
panies. However, as we are now in April and closer to the
2021 cash flows, a slight increase in valuations is expected,
everything else being equal. Thus, regarding underlying
estimates and valuations, the situation remains largely
unchanged compared to our last SaaS report in November
2020.
REDEYE - SAAS REPORT 2021
16SOFTWARE OVERVIEW
Strong Correlation Between EV/S and R40 Persists Profitability Important in Lack of Proper Metrics
While sales growth arguably is more important than mar-
EV/S vs Growth + EBIT m. 2023E (Nov. 2021) gins, as it compounds and generally results in high margins
25
over time (assuming scalable SaaS businesses), margins
FNOX
remain an important component in Nordic SaaS businesses’
20
valuations. As mentioned earlier, the correlation between
sales growth + EBIT margins and EV/S is significant for
15
Nordic SaaS businesses. However, when comparing only
EV/Sales
CHECK
VITEC
CARA
ADMCM sales growth to EV/S, the correlation is weak, as shown in the
10
SMCRT
UPSALE
LIME
R² = 0.4399
figure below.
NORDH BUSER
PENNEO
5 SFTR
PSKY EFECTE
MRCEL VERT In the US, sales growth tends to be more important, with
247ANOD PEXIPXMRCSAM
BUILD FPIP
LEADD LITI
a higher correlation between EV/S and sales growth. We
0
0% 20% 40% 60% 80% believe one reason for the difference between the US and the
Sales growth + EBIT margin
Nordics is the lack of companies disclosing SaaS metrics.
While almost every unprofitable SaaS business will tell you it
could be profitable if it wanted to, without the right SaaS met-
November 2021, Source: Redeye Research, Company reports, FactSet
rics it is hard for investors to evaluate the statement. Thus,
in the lack of the proper metrics, we believe investors are
As mentioned earlier, we believe 2023E is a better proxy for unwilling to pay high multiples for unprofitable companies.
the underlying performance than 2022E, as 2023E is most-
ly unaffected by M&A. Overall, the picture is similar to the EV/S vs Growth 2023E (November 2021)
2021E figure from our previous SaaS report from April 2021, 25
with a high correlation between EV/S and sales growth + FNOX
EBIT margin. 20
Companies that can combine high growth with decent mar- 15
EV/Sales
gins or vice versa are unsurprisingly valued at high multiples. CHECK
VITEC ADMCM
High growth and margins combined indicate that the compa- 10 CARA
SMCRT
UPSALE
ny can grow its sales efficiently. Companies with a combined LIME
NORDH
R² = 0.0195
PENNEO BUSER
sales growth and EBIT margin of 40% or above are generally 5 SFTR
BIM CSAM
EFECTEPSKY
FPIPMRCEL
considered to be successful SaaS companies – i.e., the “Rule VERT
ANOD 247LEADD BUILD LITI PEXIP
XMR
of 40”. However, several other essential factors determine 0
0% 10% 20% 30% 40% 50% 60% 70%
valuation—for example, company size, competitive advantag-
Sales growth
es, recurring revenue share, and total addressable market.
November 2021, Source: Redeye Research, Company reports, FactSet
The graph above is only a snapshot of the total sales growth
rate and margin, in this case, the estimates for 2021. The
long-term sales growth and margin outlooks are likely more
important to the businesses’ valuation than the 2021E
snapshot. However, there tends to be a high serial correlation
regarding both sales growth and margins over the years in
most SaaS businesses. That is likely one reason behind the
high correlation between EV/Sales multiples and the sales
growth + EBIT margin. Note that most Nordic SaaS compa-
nies are followed only by one or a couple of analysts, which
likely decreases the estimates’ accuracy.
REDEYE - SAAS REPORT 2021
17SOFTWARE OVERVIEW
SaaS EV Sales EV/SALES EV/EBIT (x) Sales growth EBIT margin
Company (SEKm) 21E 21E 22E 23E 21E 22E 23E 21E 22E 23E 21E 22E 23E
24SevenOffice 788 228 3.5 2.8 2.3 neg neg neg 35% 27% 19% -22% -18% -4%
Addnode 12 045 4 008 3.0 2.6 2.4 42 32 27 5% 15% 12% 7% 8% 9%
Admicom 4 124 252 16.4 13.6 11.4 38 31 25 13% 18% 17% 44% 44% 46%
Bambuser 3 495 156 22.3 10.8 7.0 neg neg neg 403% 106% 56% -116% -52% -15%
BIMobject 585 123 4.7 4.3 3.7 neg neg neg -10% 18% 23% -69% -40% -24%
Briox 186 6 31.0 20.0 14.2 neg neg neg 35% 67% 50% -333% -190% -113%
BuildData 307 44 7.0 3.3 2.7 neg neg neg 0% 106% 26% -28% -14% -5%
Carasent 2 545 142 18.0 13.0 10.4 81 51 35 99% 36% 22% 22% 25% 30%
CSAM 1 815 352 5.2 3.8 3.2 neg 53 31 52% 48% 31% -3% 7% 10%
Efecte 861 174 4.9 4.2 3.6 213 65 35 16% 16% 17% 2% 7% 10%
Formpipe 1 675 465 3.6 3.5 3.1 27 25 19 15% 3% 10% 14% 14% 16%
Fortnox 37 931 926 41.0 29.9 22.2 115 74 51 34% 36% 33% 36% 40% 44%
LeadDesk 1 195 262 4.6 3.6 2.9 238 65 40 88% 24% 23% 2% 5% 7%
Lime 4 696 410 11.4 9.4 7.9 54 43 30 21% 19% 17% 21% 22% 26%
Litium 276 62 4.4 3.4 2.6 neg 92 11 28% 29% 31% -19% 4% 23%
Mercell 3 938 741 5.3 4.2 3.6 neg 67 25 136% 26% 15% -6% 6% 14%
NordHealth 2 594 203 12.8 8.4 7.0 neg neg 297 48% 66% 30% -7% -3% 2%
PatientSky 748 209 3.6 3.6 3.2 neg neg neg 48% 15% 22% -30% -32% -20%
Penneo 992 56 12.9 8.8 6.4 neg neg neg 58% 46% 39% -46% -42% -29%
Pexip 3 511 833 4.2 3.5 2.6 neg neg neg 22% 36% 38% -37% -33% -8%
Physitrack 690 76 9.1 5.9 n/a 60 29 n/a n/a 53% n/a 15% 20% n/a
Safeture 264 27 9.9 7.0 4.8 neg neg 698 24% 47% 46% -82% -32% 1%
SmartCraft 3 688 272 13.5 10.9 9.3 46 34 27 nmf 24% 17% 29% 32% 34%
Upsales 1 296 93 13.9 11.1 8.6 99 52 39 24% 24% 26% 14% 21% 22%
Vertiseit 673 127 5.3 3.7 3.0 210 53 20 65% 45% 22% 3% 7% 15%
Vitec 19 366 1 592 12.2 11.6 11.2 62 60 57 21% 4% 2% 20% 19% 20%
XMReality 138 26 5.3 3.5 2.5 neg neg neg 26% 54% 40% -98% -34% -5%
Source:
AverageRedeye Research, Company
3 786 reports, Eikon
410 10.5 7.3 5.9 93 47 78 57% 45% 27% -23% -6% 6%
Median 1 245 189 7.0 4.3 3.6 61 52 30 27% 32% 23% -2% 6% 10%
Source: Redeye, Company reports, FactSet
The peer table above shows the estimated multiples, growth, and EBIT margins for a large portion of the Nordic SaaS businesses.
Some companies are not included in the “Rule of 40” and the “EV/S vs. Sales Growth + EBIT margin” as they are outliers.
REDEYE - SAAS REPORT 2021
18SOFTWARE OVERVIEW
Net Revenue Retention
The Net Revenue Retention (NRR), sometimes called Net While many other factors are important, of course, valuing
Dollar Retention, is the percentage of recurring revenue the 115% NRR business at two times the 95% NRR business
retained from existing customers relative to last year’s would not be unreasonable. As the 115% NRR business is
corresponding period. It considers churn, upsell, and down- likely to be more profitable over time, we believe an even
grades (100% + upsell – churn – downgrades), and an NRR larger difference can be justified in many cases.
>100% means that the existing customer base has grown
year over year. NRR 115% - Ten Cohorts Over Ten Years
2 500
Companies that can maintain an NRR substantially above
2 000
100% over time have a significant advantage. Customer
acquisition costs are typically much higher for new custom-
1 500
ers relative to upselling, making companies with high NRR
Sales
more likely to become profitable over time. Also, a high NRR
1 000
is a sign that customers are satisfied with the product as
they, on average, increase their usage instead of churning. 500
The graph below highlights the significant impact of different 0
1 2 3 4 5 6 7 8 9 10
NRRs for the average customer for five years. After a few
Year
years, the importance of a solid NRR is obvious. Over five 1 2 3 4 5 6 7 8 9 10
years, a 30% difference in NRR results in a >200% difference
in ARPA.
NRR 95% - Ten Cohorts Over Ten Years
NRR - One Cohort Over Five Years 2 500
250
2 000
200
1 500
150
Sales
ARPA
1 000
100
500
50
0
0 1 2 3 4 5 6 7 8 9 10
1 2 3 4 5 Year
Year 1 2 3 4 5 6 7 8 9 10
120% 110% 100% 90% 80%
The importance of NRR becomes even clearer when adding
several cohorts. In the examples below, we assume 100 in
annual new sales, increasing by 5% per year, and an NRR of
115% and 95%, respectively. Over ten years, the company
with 115% in NRR will have almost 2.5x the sales of the 95%
NRR company. Thus, investors should value companies
that can sustain a high NRR over time at higher multiples.
REDEYE - SAAS REPORT 2021
19SOFTWARE OVERVIEW A few Nordic SaaS businesses are reporting their NRR, and the graph below shows their numbers for 2021 so far. Basically, all companies reporting their NRR have an NRR in line with or above 100%. However, we would assume these numbers are not representative of the Nordics, as we believe companies with decent NRRs and above are more likely to disclose their numbers. Note that some companies naturally should have a higher NRR than others. For example, we expect enterprise SaaS solutions with large customers to have a higher NRR than SaaS targeting SMEs. Also, companies typically starting out selling to only a fraction of a large corporation should gener- ally have a higher NRR than companies selling to the whole corporation up-front. Among Nordic SaaS businesses reporting its NRR, Penneo is the star, with an NRR hitting 130% in H1 2021. While Penneo targets a large corporations, the solid NRR indicates custom- ers are satisfied with the solution, significantly increasing their usage of Penneo’s offering. Carasent, on the other hand, with an average NRR of ~120% in 2021 so far, mainly has its expansion driven by customers using additional integrations from Carasent’s ecosystem. Also, both companies have low churn rates (
SAAS METRICS
There are many metrics to use when evaluating the strength of a SaaS business. Data on CAC, retention,
and churn are crucial
REDEYE to look at. Public SaaS companies in the USA most
Equity Research often
Redeye SaaS report their
report 2020 14 AprilCAC,
2020 ARR,
REDEYE Equity Research Redeye SaaS report 2020 14 April 2020
gross margin,REDEYE
andEquity
retention
Research
rates. Sadly in the Nordic’s, we are not awareRedeye of any publicly listed companies
SaaS report 2020 14 April 2020
SaaS
reporting bothSaaS Metrics
theirMetrics
CAC and retention rates. We hope we will see an improvement in metric disclosure.
SaaS
The tables below
There areMetrics
explain different
many metrics kinds
to use when of SaaS
evaluating the metrics
strength ofand
a SaaSprovide
business.benchmarks to look
Data on CAC, retention, and at
churnwhen
areThere
evaluating recurring aretomany
crucial revenue metrics
look at. toSaaS
use when
business.
Public evaluating
companies in thethe
USA strength of a SaaS
most often reportbusiness. Data
their CAC, ARR,ongross
CAC, margin,
retention, and churn
and
There are many
are crucial metrics
to Sadly
look at. to use when evaluating in the strength ofoften
a SaaS business. DataARR,
on CAC, retention, and churn
retention rates. in Public SaaS
the Nordic’s companies
only one, Agillicthe(AGILIC:CHP)
USA most report
of the theirlisted
publicly CAC, gross
companies margin,
report andtheir
both
are crucialrates.
to look at. Public SaaS companies inAgillic
the USA most oftenofreport their CAC, ARR, gross margin, and
CAC and retention rates. We hope we will see an improvement in metric disclosure. In the tables below we explaintheir
retention Sadly in the Nordic’s only one, (AGILIC:CHP) the publicly listed companies report both
retention
CAC and rates. Sadly
retention in the
rates. WeNordic’s
hope weonly
willone,
see Agillic (AGILIC:CHP)
an improvement of the disclosure.
publicly listed companies report
weboth their
different kinds of SaaS metrics and provide benchmarks to look atinwhen
metric In the
evaluating recurring tables below
revenue explain
business.
CAC and retention
different rates.metrics
kinds of SaaS We hope
andweprovide
will seebenchmarks
an improvementto look in at
metric
whendisclosure.
evaluatingIn the tables
recurring belowbusiness.
revenue we explain
different kinds of SaaS metrics and provide benchmarks Key SaaStoMelook
tricsat when evaluating recurring revenue business.
Metric Definition
Key SaaS Metrics Calculation
Metric Definition Key SaaS Metrics Calculatio
MRR = Number of customers * n(ARPU / Month)
MRR & Implied ARR Measurment of monthly/annual recurring revenue.
Metric Definition MRR I=mNumber ofC=customers
plied ARR aActual n * (ARPU
lculatioMRR * 12 / Month)
MRR & Implied ARR Measurment of monthly/annual recurring revenue.
Impliedof
MRR = Number AR R = Actual*MRR
customers * 12
(ARPU / Month)
MRR & Implied ARR Measurment of monthly/annual recurring revenue.
Customer Acquisition Implied ARR = Actual MRR * 12
All S&M costs for new customers. S&M / Number of new customers
CuCsotosm
t (eCrAACc)quisition
All S&M costs for new customers. S&M / Number of new customers
Custom CoesrtA(cCqAuCis) ition
All S&M costs for new customers. S&M / Number of new customers
CustomerCLoisfet t(iC
mAeCV) alue CLTV is the net present value of the recurring profit streams of a given customer less the
(ARPU * Gross margin) / Churn
Custom
(CeLrTLVi)fetime Value CLTV is the net present value of the recurringcost.
acquisition profit streams of a given customer less the
(ARPU * Gross margin) / Churn
Customer(C LiLfeTtVim
) e Value acquisition
CLTV is the net present value of the recurring cost.
profit streams of a given customer less the
(ARPU * Gross margin) / Churn
Customer(C ALcT quVi)sition acquisition
The CAC payback period is a statement in months,cost.
of the time to fully payback sales and Total S&M costs last quarter / (New MRR added last quarter *
CoCstuP
staoymbaecr kAPcqeruiiosdition The CAC payback period is a statement
marketingin months, of the time to fully payback sales and
investment. Total S&M costs lastGross
quarter / (New MRR added last quarter *
margin)
CC
uostsot m
Paeyr bAaccqkuPiseitriioond marketing investment.
The CAC payback period is a statement in months, of the time to fully payback sales and Gross
Total S&M costs last quarter margin)
/ (New MRR added last quarter *
CusCto
osmt ePraGyb
roascsk/LPoegriood
This is a percentage calculation of allmarketing customerinvestment.
names (“logos”) that have churned over the Gross margin)
Customers lost over time period / Customers at the beginning
CustoCm huernGross/Logo This is a percentage calculationmeasured of all customer names (“logos”) that have churned over the
time period. Customers lost over time period
of time / Customers at the beginning
period
CustomeC rhGurornss/Logo
This is a percentage calculation of all measured
customer time period.
names (“logos”) that have churned over the Customers lost over timeofperiod
time period
/ Customers at the beginning
Churn Gross Dollar Retention: Looks at howmeasured much of the timecustomer
period. ARR are kept over the measured of –time period
ARR – downgrades churn / Beginning ARR
Gross Dollar Retention : Looks
time at how
period. much
As such it’sofalways
the customer ARR are kept over the measured
below 100%.
Retention ARR – downgrades – churn / Beginning ARR
NGetroDsosllaDroRlla
etreRnetitoenn:tiAs
o n : time but
above,
Looks period.
at how As such
including
much of it’s
upgrades.
thealways below
As such
customer ARR100%.
it’s can
are be higher
kept over than
the 100%
measured
Retention (ARR + upgrades – downgrades
ARR – downgrades – churn)
– churn / Beginning
/ Beginning ARRARR
Net Dollar Retention: Astime above,
(and but including
should
period. be such
As upgrades.
for a it’s
healthy As such
business).
always below it’s can be higher than 100%
100%.
Retention (ARR + upgrades – downgrades – churn) / Beginning ARR
Source: Redeye Research Net Dollar Retention: As above, (andbutshould be forupgrades.
including a healthy Asbusiness).
such it’s can be higher than 100%
(ARR + upgrades – downgrades – churn) / Beginning ARR
Source: Redeye Research (and should be for a healthy business).
Source: Redeye Research SaaS Metrics for different customer segments
SaaS Metrics for different customer segments
SaaS Metrics for different customer segments
SMB Midmarket Enterprise
SMB Midmarket Enterprise
ARR growth 40-5S0M
%+B 5M
0i-d
60m
%a+rket 3E0n-5te
0%rp+rise
ARR growth 40-50%+ 50-60%+ 30-50%+
GrosAsRRRetgernotw
iotn
h 704-08-05%
0%+ 805-09-06%
0%+ 9300%-5+0%+
Gross Retention 7 0 -8 0 % 8 0 -9 0 % 90%+
NGertoRsestR
enetieonntion 80-7100-08%
0% 90-8102-09%
0% 1109%
0%++
Net Retention 8 0 -1 0 0 % 9 0 -1 2 0 % 110%+
N
LTeV
t /RCeAteCntion 8
30-5-1
x 00% 9
40-6-1
x 20% 41-61x0%+
LTV/CAC 3 -5 x 4 -6 x 4 -6 x
CAC PayLbTaVc/kCP
AeCriod 3-o5sx
3 -6 M 12 M4-o6sx 18-244M
-6oxs
CAC Payback Period 3-6 Mos 12 Mos 18-24 Mos
CG
ArCosPsayMbarcgkinPeriod 3-6 Mos 50-1725%
M+os 18-24 Mos
Gross Margin 50-75%+
Source: Redeye Research
GroRedeye
Source: ss MarResearch
gin 50-75%+
BeSource:
ssemeRedeye
r VentuResearch
re Partners Efficiency Score (< $30 million ARR)
Bessemer Venture Partners Efficiency Score (< $30 million ARR)
Bessemer Venture Partners Efficiency Score (< $30 million ARR)
Source: Bessemer Venture Partners
Source: Bessemer Venture Partners 13
Source: Bessemer Venture Partners 13
13
REDEYE - SAAS REPORT 2021
21Nordic Public Metrics Benchmarks
In this section, we present different valuation and operational
metric benchmarks. Data from Redeye and FactSet (Novem-
ber 2021).
EV/Sales
30 2022E 2023E
30
25
22
21
20
20
14 14
15 13 13
11 1211 11 11 11
10
9 9 9
10 9 8 8
7 6 7 7
6
5 44 44 44
5 4 43 43 43 33 3 3 3 33
3 2 3 32 32
11
0
Sales growth (%)
2022E 2023E
100
90
80
70
67 66
70 62
60 56 54 53
50 48 4746 46
50 45
40 39
40 36 3638 36
33
30 31 2931 27 26
30 26
22 22 24 2426 2423 23 22
19 17 1917 1817 18
20 15 1617 15 15
12 10
76
10 42 3
0
REDEYE - SAAS REPORT 2021
22EV/EBIT
2022E 2023E
80 74
70 67
65 65
60
57
60 53
51 52 52 51
50 43
40 39
40 35 35 34
31 30 32 31
27 27 29
30 25 25 25
20 19 17
20
12
7 8
10 6
0
LITI FNOX MRCEL LEADD EFECTE VITEC CSAM VERT UPSALE CARA LIME SMCRT ANOD ADMCM PTRK FPIP IRIST MNTR
Sales growth + EBIT margin
EBIT margin (%)
2022E 2023E
50 46
44 44
45
40
40
34
35 32
30
30 25 26
23
25 22 21 22 20 19 20 20
20 17 16
14 15 14
15 10
10
10 8 9 7 7 7
7 6 5
4
5
0
ADMCM FNOX SMCRT CARA LIME UPSALE PTRK VITEC MNTR FPIP ANOD CSAM VERT EFECTE MRCEL LEADD LITI
G+P Ratio (%)
2022E 2023E
100 92
90
80 7676
73
70 63 65
6263 62
57 55 54
60 52 51 52 52 54
48 47
50 45
41 41 4143
37 35
40 32 33 33
29 2930 27 27
30
30 24 2322 23 2320
20 20
17 15 15
20
10 9
10 4 3
0
REDEYE - SAAS REPORT 2021
23Covered Companies
REDEYE - SAAS REPORT 2021
24COVERED COMPANIES
Addnode Group 26
Artificial Solutions 28
BIMobject 30
Carasent 32
Formpipe Software 34
Fortnox 36
Penneo 38
Safeture 40
Speqta 42
Vertiseit 44
XMReality 46
REDEYE - SAAS REPORT 2021
25Addnode Group ANOD B
Company page Publication date
https://www.redeye.se/company/addnode- November 10 2021
group
Redeye Rating
COMPANY QUALITY FAIR VALUE RANGE TIMELINESS
Last price
349.5
6
5 5 4 Base
Bear Bull
People Business Financials 170.0 305.0 410.0
Snapshot Financials
Addnode Group Redeye Estimates
OMXS30
2019 2020E 2021E 2022E 2023E
400
350 Revenue, MSEK 3,434 3,807 4,182 4,867 5,322
300 Growth 16.7% 10.9% 9.9% 16.4% 9.3%
250
EBITDA 413 444 414 596 572
200
EBITDA margin 12.0% 11.7% 9.9% 12.2% 10.8%
Volume EBIT 218 229 307 392 430
500k
EBIT margin 6.4% 6.0% 7.4% 8.1% 8.1%
0
Jan Mar May Jul Sep Nov Pre-tax earnings 175 211 290 378 417
Net earnings 128 163 225 295 325
Marketplace NASDAQ Stockholm Net margin 3.7% 4.3% 5.4% 6.1% 6.1%
CEO Johan Andersson Dividend/Share 2.50 2.50 3.00 3.50 4.00
Chairman Staffan Hanstorp EPS adj. 3.83 4.85 6.68 8.78 9.66
P/E adj. 46.6 77.1 55.9 42.6 38.7
Share information
EV/S 1.8 3.3 3.1 2.6 2.4
Share price (SEK) 349.5
EV/EBITDA 15.1 28.5 31.2 21.6 22.6
Number of shares (M) 33.6
Market cap (MSEK) 11,754 Last updated: 2021-07-22
Net debt (MSEK) 0
Owner Equity Votes
Analyst
SEB Fonder 10.3% 8.1%
Swedbank Robur Fonder 8.9% 7.0%
Fredrik Nilsson
fredrik.nilsson@redeye.se ODIN Fonder 6.5% 5.2%
Handelsbanken Fonder 5.6% 4.4%
Staffan Hanstorp & Jonas Gejer 5.4% 15.1%
Conflict of interests
Lannebo Fonder 5.0% 4.0%
Fredrik Nilsson owns shares in Addnode Group: No
Fjärde AP-fonden 4.4% 3.5%
Redeye performs/have performed services for the Company and receives/have
received compensation from the Company in connection with this. Andra AP-fonden 4.4% 3.4%
Nordea Fonder 4.3% 3.4%
AMF Pension & Fonder 3.6% 2.9%
REDEYE - SAAS REPORT 2021
26COVERED COMPANIES
Company description
Addnode Group was established in 2003 and is listed on Nasdaq OMX Counter-Thesis – Bear points
Stockholm. In 2019 Addnode had a turnover of SEK 3.4 billion, with an EBITA of
Dependent on the economy and the willingness to invest
SEK 327million. Addnode Group is divided into three divisions: Design
In recent years, Addnode has had a favorable demand from manufacturing
Management, Product Lifecycle Management, Process Managemen. The
industries, as well as the construction and property sector. During the last
business segments operate in different regions with about 25 different brands.
quarters, some smaller and specialized companies in the real estate industry
Operating margin varies considerably between the various business areas
appear to have problems. However, Addnode’s direct exposure to housing
where the most profitable can perform up to 20 percent. Addnode Group uses a
developers is low, and it should therefore not be concluded that Addnode will
very decentralized management model where the individual subsidiaries are
face lower demand in the coming quarters. Even so, we will follow the
run by management teams to maintain an entrepreneurial spirit. A key growth
development of the Design Management business area as well as the
strategy in Addnode Group is to grow through acquisitions, which they
underlying industry.
managed to do successfully in recent years. The company's own financial
goals is to reach a growth of 10% per year (both organically and through Acquisition-led growth always risky
acquisitions), an EBITA margin of 10% and at least 50% of profit after tax will be Organic growth can be slow, international expansion is complex and
distributed to shareholders. acquisitions tend to be difficult. Despite Addnode’s successful acquisition
history, acquiring companies takes time and poses a risk. Nevertheless, we
Investment case have confidence in the management team.
• Has evolved into becoming a software company
• Interesting acquisition history Catalyst types
• Well-diversified in three different divisions
Increase in SaaS orders
The shift towards more SaaS orders may affect sales and earnings negatively
Investment case in the short run. However, we believe that the shift will have a positive impact
Has evolved into becoming a software company. Today, only about 25% of on profitability in the long term.
Addnode’s sales are related to services, and most of these services are related
to the implementation of the company’s software solutions. Moreover, the Economic downturn
company has a strong focus on recurring revenues, and today more than 60% While we believe Addnode diversification in terms of markets and regions as
of sales are recurring revenues. These qualities make us believe the company well as the digitalization help making the company rather resilient to economic
should be valued at a premium compared to the IT-consultants. More precisely, downturns, software revenue is generally related to the number of users. Thus,
we claim Addnode should be valued in line with comparable software layoff of engineers likely has a negative effect on Addnode’s revenue and profit.
companies.
Interesting acquisition history. Addnode has for a long been one of our
favorites in its sector. The company has a successful acquisition history, which
driven by its focus on fair price, good people, and management in place. As a
result of the completed acquisitions, Addnode has increased its debt. However,
we claim that the leverage is healthy and that the acquisitions have been value-
creating. Since 2013, Addnode has acquired about 30 businesses, adding a
total of over SEK 2 000m in sales. Historically, the company has acquired at 6x
EBITA, way below Addnode’s valuation. We believe the prospects for additional
value-adding acquisitions is good, however, it is partly already priced in
according to us.
Well-diversified in three different divisions. To sum up, Addnode is well
diversified in three different divisions with interesting niches. Further, the
company has taken a leading Nordic position in most of its niches, which also
is the ambition for all of its business areas.
REDEYE - SAAS REPORT 2021
27Artificial Solutions ASAI
Company page Publication date
https://www.redeye.se/company/artificial- November 10 2021
solutions
Redeye Rating
COMPANY QUALITY FAIR VALUE RANGE TIMELINESS
Last price
7.2
5
4 3 1 Base
Bear Bull
People Business Financials 2.0 11.0 36.0
Snapshot Financials
Artificial Solutions Redeye Estimates
OMXS30
2019 2020 2021E 2022E 2023E
14
12 Revenue, MSEK 49 54 40 57 80
10 Growth 9.1% 9.6% -24.7% 41.3% 40.4%
8
EBITDA -134 -85 -60 -52 -39
6
EBITDA margin Neg Neg Neg Neg Neg
Volume EBIT -146 -97 -73 -65 -52
2M
EBIT margin Neg Neg Neg Neg Neg
0
Jan Mar May Jul Sep Nov Pre-tax earnings -181 -154 -75 -88 -78
Net earnings -181 -154 -75 -88 -78
Marketplace First North Stockholm Net margin 0.0% 0.0% 0.0% 0.0% 0.0%
CEO Per Ottosson Dividend/Share 0.00 0.00 0.00 0.00 0.00
Chairman Åsa Hedin EPS adj. -9.33 -3.62 -1.15 -1.35 -1.20
P/E adj. -0.7 -3.2 -6.6 -5.6 -6.3
Share information
EV/S 6.9 12.4 15.4 12.4 9.8
Share price (SEK) 7.2
EV/EBITDA -2.5 -7.8 -10.3 -13.5 -20.1
Number of shares (M) 65.7
Market cap (MSEK) 476 Last updated: 2021-11-01
Net debt (MSEK) 166
Owner Equity Votes
Analyst
Scope 25.6% 25.6%
UBS Switzerland AG 9.0% 9.0%
Forbes Goldman
forbes.goldman@redeye.se Banque Cantonale Vaudoise 6.9% 6.9%
Nice & Green 5.6% 5.6%
AFA Försäkring 5.0% 5.0%
Conflict of interests
SEB-Stiftelsen 4.4% 4.4%
Forbes Goldman owns shares in Artificial Solutions: No
ATS Finans AB 3.0% 3.0%
Redeye performs/have performed services for the Company and receives/have
received compensation from the Company in connection with this. JP Morgan Bank Luxembourg S.A. 2.6% 2.6%
C WorldWide Asset Management 2.6% 2.6%
Avanza Pension 2.6% 2.6%
REDEYE - SAAS REPORT 2021
28COVERED COMPANIES
Company description Catalyst types
Founded in 2001, Artificial Solutions is best known for Teneo, its flagship Early Signs of Significant Usage Revenue Potential
product. Teneo is an Azure-based (Microsoft) development platform for The SaaS model launched in 2021 could turn out to be highly scalable.
Conversational Artificial Intelligence (CAI). Essentially, Teneo appeals to However, it is still early days, and the model remains unproven. Early signs of
developers - both independent and at large corporations - to program scalability, such as steady sequential usage growth, should inspire confidence
conversational applications. About 90% of the use cases regard customer- in its long-term potential.
facing services. In 2020, Artificial Solutions appointed Per Ottosson as CEO
Significant ARR and Top-Line Growth
and initiated its transition to a SaaS business and delivery model shortly after
Solid quarterly reports demonstrating significant top-line growth, and thus a
that. The company is listed on First North and has around 60 employees.
path to profitability should positively impact the share price.
Investment case Lighthouse Customer Agreements
• Scalable SaaS Business Model We see great potential in large corporations choosing to implement Teneo and
• Major Partners to Drive Growth Conversational AI for an increasing number of use-cases. Apart from yielding a
• Attractive Exposure to the Conversational AI Market significant ARR at high margins, it could indicate that its industry is truly ready
to adopt the technology on a larger scale.
Scalable SaaS Business Model
Artificial Solutions announced its transition to a SaaS business and delivery
model in Q1 2021. In contrast to its previous model, the SaaS model is
inherently scalable, owing to its usage-based revenues. Additionally, the
company expects to transition most of its installed base from the legacy to the
SaaS model in 2022, representing a SEK >75m ARR opportunity.
Major Partners to Drive Growth
Since Q3 2021, Artificial Solutions has an IP Co-Sell Incentivized Partnership
with Microsoft. Essentially, it means that Microsoft's sales team is incentivized
through commissions to promote Teneo to enterprise clients on Microsoft
Azure. The agreement marks a vote of confidence in Teneo and could enable
significant lead-generation among the 1,700+ organizations using Microsoft
Azure and LUIS.
Artificial Solutions relies on systems integrators and channel partners such as
Tech Mahindra, CGI, and Deloitte to drive sales and usage. These partners have
a global profile and could reach many potential customers at a limited
customer acquisition cost.
Attractive Exposure to the Conversational AI Market
The Conversational AI Market is a $50B industry, while its software segment
represents a $14B opportunity growing at a 22% CAGR. As one of the leading
companies in this space, and one of the only publicly listed peers, Artificial
Solutions provides attractive exposure to this sought-after market.
Solid Financial Position
In Q3 2021, Artificial Solutions agreed to a long-term SEK 250m financing
agreement with Capital Four, a leading credit asset management firm in the
Nordics (€15 billion AUM). Essentially, the company will not need to make cash
interest payments during the five-year tenure, in addition to interest expenses
decreasing by 7ppts. Near- and mid-term financing issues are out of the
picture, providing management ample room to execute on its SaaS model and
sales ramp-up.
REDEYE - SAAS REPORT 2021
29BIMobject BIM
Company page Publication date
https://www.redeye.se/company/bimobject November 10 2021
Redeye Rating
COMPANY QUALITY FAIR VALUE RANGE TIMELINESS
Last price
6.6
5
4 5 2 Base
Bear Bull
People Business Financials 4.5 11.0 22.5
Snapshot Financials
BIMobject Redeye Estimates
OMXS30
2019 2020 2021E 2022E 2023E
15 Revenue, MSEK 134 137 127 157 193
Growth 15.7% 2.0% -7.3% 24.3% 22.2%
10
EBITDA -123 -63 -60 -30 -13
5
EBITDA margin Neg Neg Neg Neg Neg
Volume EBIT -132 -72 -67 -37 -20
10M
5M EBIT margin Neg Neg Neg Neg Neg
0
Jan Mar May Jul Sep Nov Pre-tax earnings -131 -82 -64 -37 -20
Net earnings -127 -82 -64 -37 -15
Marketplace First North Stockholm Net margin Neg Neg Neg Neg Neg
CEO Carl Silbersky Dividend/Share 0.00 0.00 0.00 0.00 0.00
Chairman Johan Svanström EPS adj. -1.06 -0.59 -0.47 -0.27 -0.11
P/E adj. -8.9 -23.9 N/A N/A N/A
Share information
EV/S 7.7 11.9 N/A N/A N/A
Share price (SEK) 6.6
EV/EBITDA -8.4 -25.6 N/A N/A N/A
Number of shares (M) 139.3
Market cap (MSEK) 914 Last updated: 2021-08-08
Net debt (MSEK) -343
Owner Equity Votes
Analyst
Euroclear Bank S.A/N.V 13.5% 13.5%
EQT 11.1% 11.1%
Fredrik Nilsson
fredrik.nilsson@redeye.se Swedbank Robur Fonder 8.6% 8.6%
Avanza Pension 7.9% 7.9%
TIN Fonder 7.4% 7.4%
Conflict of interests
Stefan Larsson 5.0% 5.0%
Fredrik Nilsson owns shares in BIMobject: Yes
Handelsbanken Fonder 3.9% 3.9%
Redeye performs/have performed services for the Company and receives/have
received compensation from the Company in connection with this. Berenberg Funds 3.5% 3.5%
Nordnet Pensionsförsäkring 2.7% 2.7%
Phillippe Butty 2.5% 2.5%
REDEYE - SAAS REPORT 2021
30COVERED COMPANIES
Company description
BIMobject's mission is to digitalize construction for a more sustainable future. High earnings potential
It's a global marketplace for the construction industry that provides architects With i) attractive sales growth opportunities, ii) a competitive product offering
and engineers with the information and inspiration they need to design for manufacturers and iii) a scalable business model with a high degree of
buildings faster, smarter and greener. recurring revenues, we argue that BIMobject is well-positioned for high
profitability in the long-term. As the global leading BIM-library provider, acting
With 2000+ building product brands and 100 of the world’s top 100 architect
as the market consolidator, growth will be the main focus in the next coming
firms among its users, it power digital building design worldwide. In 2019, the
years.
company had annual net sales of SEK 134 million.
Investment case Catalyst types
• Set to capture market share Continued growth in recurring revenues
• Global potential The recurring platform sales remain BIMobject's primary focus going forward.
• Strategic shift – fueling path to black numbers The growth rate of ARR will be key to its path of market dominance and
• High earnings potential profitability. Even if the indicator is lagging, we believe the metric will be critical
for the development of the stock. In the following quarterly reports, keep an eye
Set to capture market share
on the ARR but also on the net added manufacturers/brands to its client base,
With slim margins, the construction industry is urging for increased efficiency
which will be leading.
as it has been lagging significantly in the last decade compared to the rest of
the world. At the same time, we expect Building Information Modelling (BIM) to Profitable growth
be one of the main efficiency drivers in the industry going forward. In a Historically, BIMobject has been growing sales significantly but also raised its
fragmented market with high underlying growth, we believe that BIMobject, as OPEX at the same pace. The company is now at a point where increased sales
the leading global BIM-library provider, is set to capture a significant market can emerge into improved profitability, and later on to black numbers. Turning
share. the trend around in a first step, and secondly reaching above breakeven should
increase the investor sentiment in the stock.
Global potential
Compared to most of the Swedish listed Software as a Service (SaaS)
companies, BIMobject has global potential and is on a good way to becoming
the global leader within its niche. The market, who yet is in the early stage,
offers solid growth prospects of >10% yearly with an estimated TAM larger
than SEK >3.2bn at this point.
Strategic shift – fueling path to black numbers
Historically, BIMobject has had an opportunistic strategic approach, not
utilizing its full potential as a software company. Its new management, which
shows a good understanding of the business and market, has put several new
strategic initiatives into place, adapting its strategy to SaaS-based metrics,
while having its own skin in the game further adds to our positive view.
The most important initiatives include;
• Restructuring of the sales team and processes to accelerate ARR growth,
decrease the CAC payback period, reducing lead times, and improve
onboarding
of new customers from 90 to 30 days
• Improving its product offer and changing its pricing to a value-based
model, which we expect will impact ARPB.
• Establishing a customer success team to reduce churn and increase
customer satisfaction, reducing churn from historically high levels of 12%
toYou can also read