State of the Epidemic in Scotland - 10 June 2022
←
→
Page content transcription
If your browser does not render page correctly, please read the page content below
State of the Epidemic in Scotland – 10 June 2022
Scottish Government Central Analysis Division

Background
This report summarises the current situation of the Covid-19 epidemic in Scotland. It
brings together the different sources of evidence and data about the epidemic in
Scotland at this point in time, why we are at that place, and what is likely to happen
next. This updates the previous publication published on 26 May 20221. The
information in this document helps the Scottish Government, the health service and
the wider public sector respond to the epidemic and put in place what is needed to
keep us safe and treat people who have the virus.

This edition of the State of the Epidemic summarises current data on Covid-19 at a
national and local level, and how Scotland currently compares to the rest of the UK.
It looks at the vaccination program in Scotland and its impact. Information is provided
about variants of concern and what impact these may have. Bringing this information
together in one place gives the opportunity to better understand the current state of
the epidemic in Scotland.

The State of the Epidemic report this week will summarise the situation up to and
including 8 June 2022. Due to changes in reporting and testing, certain data sources
will have earlier cut-off dates than 8 June. This is highlighted throughout the report in
the footnotes of the relevant sections. Additionally, changes in testing policy across
Scotland since early April have reduced the availability and reliability of Covid-19
data and indicators that rely on testing, including cases data, hospital admissions
and occupancy data. Affected indicators have been marked out and highlighted
throughout the report.

1   Scottish Government: Coronavirus (Covid-19): state of the epidemic - gov.scot (www.gov.scot)
                                                                                                   1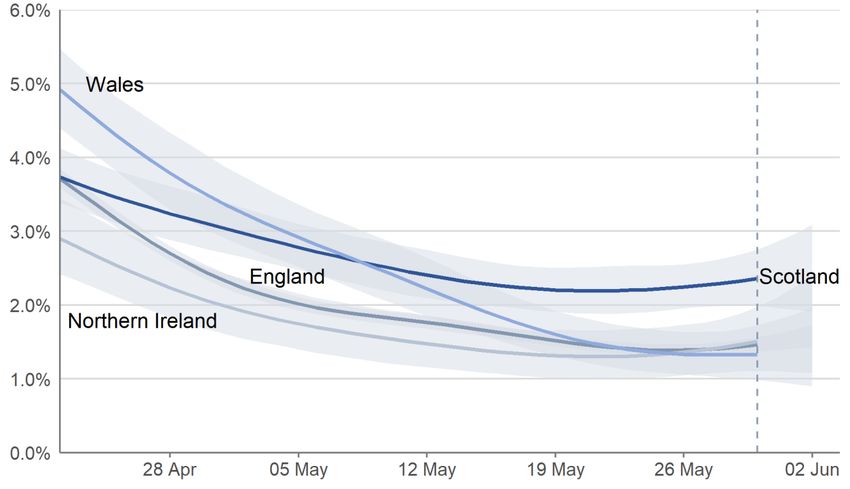
Publication Notice

The fortnightly State of the Epidemic report will be discontinued after this publication
on 10 June 2022. Analysis of the latest Covid-19 data for Scotland can now be found
in the weekly Covid-19 Statistical Report by Public Health Scotland. The Modelling
the Epidemic publication, which summarises the main modelling outputs for
Scotland, will continue to be published on a fortnightly basis. In the future, State of
the Epidemic reports may be published on an ad hoc basis.

We would like to thank those who have read and used the report in their personal
and professional lives, and provided feedback on its format and content.

                                                                                       2
Contents
Summary .................................................................................................................... 4
Key Points .............................................................................................................. 4
Method.................................................................................................................... 5
Covid-19 Prevalence .................................................................................................. 6
R value, Growth Rate and Estimated New Daily Infections .................................... 6
Covid-19 Infection Survey – Headline Estimates .................................................... 6
Covid-19 Infection Survey and New Variants ......................................................... 8
Covid-19 Infection Survey – Regional Analysis ...................................................... 9
Covid-19 Wastewater Estimates ........................................................................... 11
Reported Covid-19 Cases .................................................................................... 12
Covid-19 Related Severe Illness and Death ............................................................. 15
Hospital and ICU Occupancy ................................................................................ 15
Hospital and ICU Admissions ............................................................................... 16
Covid-19 Related Deaths and Excess Mortality .................................................... 19
Resilience: Vaccine Uptake, Antibody Estimates, and Vaccine Effectiveness ......... 22
Vaccine Uptake..................................................................................................... 22
Covid-19 Antibody Estimates ................................................................................ 22
Vaccine Effectiveness Against Omicron ............................................................... 23
Looking ahead .......................................................................................................... 24
Scottish Contact Survey ....................................................................................... 24
Modelling the Epidemic ......................................................................................... 24
Long Covid-19 ...................................................................................................... 25
Additional data sources ............................................................................................ 25
Next steps ................................................................................................................ 26
Technical Annex ....................................................................................................... 27
Please note that State of the Epidemic report no longer includes a section on
LFD testing or reinfection cases (commentary on this can still be found in the
section), and no commentary on Covid-19 cases in different age groups, cases
among care home residents, or case rates in Scottish local authorities. This is
due to data availability following the implementation of testing policy changes in
Scotland.
This edition of the State of the Epidemic Report does not include the estimates of
R, growth rate or incidence. Updated figures will be published in the Modelling
the Epidemic publication scheduled for 23 June.
3Summary
The trend in the positivity estimates from the Covid-19 Infection Survey (CIS) for
Scotland was uncertain in the most recent week to 2 June. There has been variability
in Covid-19 wastewater levels since early May and the trend is uncertain in the week
to 1 June. According to the CIS, the estimated percentage of people testing positive
was uncertain among most ages in recent week, but there are possible signs of an
increase among those aged around 30 to 40. The CIS estimates that the percentage
of people testing positive for Covid-19 compatible with Omicron sub-variants BA.1,
BA.4 and BA.5 increased in the most recent week to 2 June.
Covid-19 related daily hospital occupancy appears to have increased slightly in the
week to 5 June, after showing a decreasing trend since the start of April 2022. The
number of Covid-19 related hospital admissions have also increased slightly in the
week to 3 June. However, trends in hospital admissions and occupancy data are to
be interpreted with caution due to recent changes in testing policy. There were 20
deaths where Covid-19 was mentioned on the death certificate in the week to 5
June, a further decrease from the week before.
Key Points
As determined through the latest weekly ONS Covid-19 Infection Survey (CIS),
in Scotland, the percentage of people living in private residential households
testing positive for Covid-19 was uncertain in the week ending 2 June 2022. In
the latest week, the estimated percentage of people testing positive was 2.36%
(95% credible interval: 1.99% to 2.75%)2, equating to around 1 in 40 people
(95% credible interval: 1 in 50 to 1 in 35).
In the most recent week (27 May to 2 June 2022), estimates for the percentage
of people testing positive were similar for all CIS Regions in Scotland and ranged
from 2.32% in CIS Region 126 (NHS Lothian) (95% credible interval: 1.90% to
2.81%) to 2.55% in CIS Region 128 (NHS Ayrshire & Arran, NHS Borders and
NHS Dumfries & Galloway) (95% credible interval: 2.11% to 3.12%).
Omicron sub-lineage BA.2 remains dominant in the United Kingdom (UK) based
on sequencing data. Some diversity is developing within this variant, and two
Omicron sub-lineages BA.4 and BA.5 have been elevated to variants of concern
(VOCs) due to their apparent growth advantage over Omicron BA.2.
The Covid-19 infection survey estimates that the percentage of people in
Scotland testing positive for Covid-19 compatible with Omicron variants BA.1,
BA.4 and BA.5 increased in the week 27 May to 2 June.
2 A credible interval gives an indication of the uncertainty of an estimate from data analysis based on a sample
population. 95% credible intervals are calculated so that there is a 95% probability of the true value lying in the
interval.
4 Nationwide, Covid-19 wastewater levels have remained between 50 and 100
million gene copies per person per day (Mgc/p/d) since the start of May 2022,
but there is variability in the data and the trend is uncertain.
Please note that due to testing policy changes, reported cases will no longer be
representative of all COVID-19 cases in Scotland, and caution is advised when
comparing trends in cases over time. By specimen date, there were 138 weekly
combined PCR and LFD cases (including reinfections) per 100,000 population in
the week to 3 June. Following a period of sharply decreasing case rates since
mid-March, this represents a slight increase from the previous week.
Over the week to 5 June, daily Covid-19 hospital occupancy slightly increased;
however, this is to be interpreted with caution due to recent testing changes.
NHS boards reported 637 patients in hospital or in short stay ICU on 5 June with
recently confirmed Covid-19, compared to 590 on 29 May.
In the week to 3 June, Covid-19 admissions to hospital in Scotland appear to
have increased slightly, with NHS boards reporting 425 admissions to hospital
compared to 411 admissions the previous week ending 27 May. Admissions to
ICU continue to fluctuate, with 12 patients admitted to ICU in the week to 5 June.
These figures are to be interpreted with caution due to recent testing changes,
and may be subject to revisions.
There was a total of 20 deaths where Covid-19 was mentioned on the death
certificate in the week to 5 June, compared to 46 in the week leading up to 29
May.
In the week ending 5 June, the total number of deaths registered in Scotland
was 836. This was 18% below the five-year average for this week.
Method
This report brings together a wide range of publicly available figures from a range of
data sources. These include publications by Scottish Government, Public Heath
Scotland, National Records of Scotland and Office for National Statistics along with
scientific publications and SAGE and UKHSA summaries where appropriate to
summarise the state of the epidemic in Scotland in a given week. We also provide
information from the Scottish Contact Survey.
5Covid-19 Prevalence
R value, Growth Rate and Estimated New Daily Infections
This edition of the State of the Epidemic Report does not include the estimates of R,
growth rate or incidence. UKHSA is publishing R and growth rates next on 24 June
2022 as indicated here. These results will also be summarised in the Modelling the
Epidemic Report publication scheduled for 23 June.
Covid-19 Infection Survey – Headline Estimates
The Covid-19 Infection Survey is a UK wide study carried out by the Office for
National Statistics (ONS) and the University of Oxford. The survey invites people
living in private households to test whether they have the infection, regardless of
whether they have symptoms, using a PCR test. This means the study is
unaffected by testing policy changes. Participants are also asked to provide a
blood sample to test for antibodies.
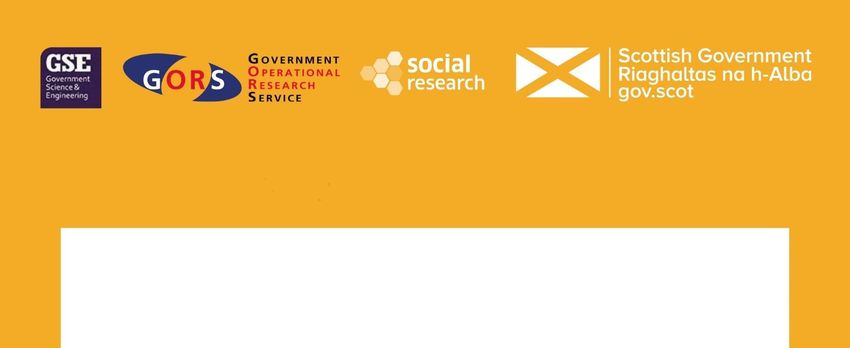
In Scotland, the trend in the percentage of people living in private households testing
positive for Covid-19, as estimated by the Covid-19 Infection Survey, is uncertain in
the most recent week (27 May to 2 June), as seen in Figure 13. The estimated
percentage of people testing positive in Scotland had been decreasing since late
March. This follows a peak in the week 14 to 20 March 2022 which saw the highest
estimate for Scotland since the survey began. The estimated percentage of people
testing positive for Covid-19 in the week 27 May to 2 June in Scotland is 2.36% (95%
credible interval: 1.99% to 2.75%)4, equating to around 1 in 40 people (95% credible
interval: 1 in 50 to 1 in 35).
In the week 27 May to 2 June 2022, there were early signs of a possible increase in
the estimated percentage of people testing positive for COVID-19 in England and
Northern Ireland due to increases in infections compatible with Omicron variants
BA.1, BA.4 and BA.5; the trend was uncertain in Wales, as in Scotland.
In the same week, estimates for the other nations of the UK are as follows and can
be seen in Figure 1:
3 Scottish Government: Coronavirus (COVID-19): ONS infection survey - Headline Results (published 10 June
2022)
4 A credible interval gives an indication of the uncertainty of an estimate from data analysis based on a sample
population. 95% credible intervals are calculated so that there is a 95% probability of the true value lying in the
interval.
6 In England, the estimated percentage of people testing positive for COVID-19
was 1.46% (95% credible interval: 1.37% to 1.56%), equating to around 1 in 70
people (95% credible interval: 1 in 75 to 1 in 65).
In Wales, the estimated percentage of people testing positive for COVID-19 was
1.33% (95% credible interval: 0.99% to 1.73%), equating to around 1 in 75
people (95% credible interval: 1 in 100 to 1 in 60).
In Northern Ireland, the estimated percentage of people testing positive for
COVID-19 was 1.51% (95% credible interval: 1.11% to 1.97%), equating to
around 1 in 65 people (95% credible interval: 1 in 90 to 1 in 50).
Figure 1: Modelled daily estimates of the percentage of people living in private
households testing positive for COVID-19 in the four UK nations, between 22
April to 2 June 2022, including 95% credible intervals5.
The estimated percentage of people living in private households in Scotland testing
positive for Covid-19 is uncertain for most age groups in the most recent week, but
there are possible signs of an increase among those aged around 30 to 40 years6.
5 Scottish Government: Coronavirus (COVID-19): ONS infection survey - Headline Results (published 10 June
2022)
6
Scottish Government: Coronavirus (COVID-19): ONS infection survey - Headline Results (published 10 June
2022)
7Covid-19 Infection Survey and New Variants
VOC-22JAN-01 (Omicron sub-lineage BA.2) remains dominant in the United
Kingdom (UK) based on sequencing data7. There is some diversity developing within
this variant. The UKHSA has elevated classification of two Omicron sub-lineages
BA.4 and BA.5 to variants of concern (VOCs) naming them VOC-22APR-03 and
VOC-22APR-04 respectively8. This change was introduced on the basis of the
growth advantage of BA.4 and BA.5 over currently dominant Omicron BA.2. There
can be several reasons for growth advantage, but in the case of BA.4 and BA.5,
laboratory data suggests a degree of immune escape is likely to contribute9. Small
numbers of BA.4 and BA.5 sequences continue to be detected in the UK10. There is
currently insufficient data to draw conclusions on the disease severity of BA.4 and
BA.511.
In response to an increase in the COVID-19 Omicron variants BA.4 and BA.5, the
ONS has reintroduced its main variant analysis. The following main variant analysis
is not based on genome sequencing but is based on whether the S gene is detected
in the swab tests. It measures the estimated percentage of the population with a
positive test compatible with the Omicron BA.1, BA.4 and BA.5 variants or BA.2
variants. For more information, see the Covid Infection Survey Headline Estimates
publication.
In Scotland, the percentage of people testing positive for COVID-19 compatible with
Omicron variants BA.1, BA.4 and BA.5 increased in the week 27 May to 2 June
2022. In the same week, the trend in the percentage of people testing positive for
COVID-19 compatible with the Omicron variant BA.2 was uncertain in Scotland
(Figure 2) 12.
7 UK Health Security Agency: Variants: distribution of case data, 7 June 2022 - GOV.UK (www.gov.uk)
8 SARS-CoV-2 variants of concern and variants under investigation (publishing.service.gov.uk)
9 SARS-CoV-2 variants of concern and variants under investigation (publishing.service.gov.uk)
10 UK Health Security Agency: Variants: distribution of case data, 20 May 2022 (published 10 June 2022)
11 Risk assessment for SARS-CoV-2 variants V-22APR-03 and V-22APR-04 (publishing.service.gov.uk)
12
Scottish Government: Coronavirus (COVID-19): ONS infection survey - Headline Results (published 10 June
2022)
8Figure 2: Modelled daily estimates of the percentage of the population in
Scotland testing positive with infections compatible with Omicron BA.1, BA.4
and BA.5 and compatible with Omicron BA.2 between 22 April and 2 June
2022, including 95% credible intervals13.
Covid-19 Infection Survey – Regional Analysis
The ONS have created sub-regions across the UK for the purposes of providing
Covid-19 positivity estimates for the residential populations on a lower level than
the four nations. In Scotland, these sub-regions are comprised of Health Boards
(for an overview on how these align with local authorities, please see Table 1 in
the Technical Annex).
In the most recent week (27 May to 2 June 2022), estimates for the percentage of
people testing positive were similar for all CIS Regions in Scotland and ranged from
2.32% in CIS Region 126 (NHS Lothian) (95% credible interval: 1.90% to 2.81%) to
2.55% in CIS Region 128 (NHS Ayrshire & Arran, NHS Borders and NHS Dumfries &
13
Scottish Government: Coronavirus (COVID-19): ONS infection survey - Headline Results (published 10 June
2022)
9Galloway) (95% credible interval: 2.11% to 3.12%) (Figure 3)14 15. Figure 3 is also
available as a dynamic map.
Figure 3: Modelled estimates of the percentage of people living in private
households within each CIS sub-region who would have tested positive for
COVID-19 in the week 27 May to 2 June 202216.
14 Scottish Government: Coronavirus (COVID-19): ONS infection survey - Headline Results (published 10 June
2022)
15 Sub-regional estimates are based on a different model to the national headline estimates, and should not be
compared to headline positivity estimates. The sub-regional figures may differ from the headline estimates
because they are averaged over a longer time period. The number of people sampled in each sub-regional area
who tested positive for COVID-19 is lower relative to the respective overall national samples. This means there is
a higher degree of uncertainty in these estimates; caution should be taken, and the uncertainty of the estimates
and wide credible intervals taken into account, when interpreting or ranking them.
16
Scottish Government: Coronavirus (COVID-19): ONS infection survey - Headline Results (published 10 June
2022)
10Covid-19 Wastewater Estimates
The Scottish Government has been working with the Scottish Environment
Protection Agency (SEPA) to detect and analyse fragments of Covid-19 virus
RNA in wastewater. The levels of SARS-CoV-2 in wastewater are monitored at
141 sites around Scotland. In contrast to Covid-19 case records, virus shedding
into wastewater is a biological process. This means that wastewater data is
unaffected by factors that impact whether testing is done.
Nationwide, Covid-19 wastewater levels have remained between 50 and 100 million
gene copies per person per day (Mgc/p/d) since the start of May 2022, but there is
variability in the data and the trend is uncertain. Figure 4 shows an apparent
increase in viral levels in the most recent set of samples that were collected on 1
June and analysed on 2 June. However, this may be attributable to the variability in
the data17.
Although overall wastewater Covid-19 levels have remained at a similar level in
Scotland over the last two weeks, 7 local authorities have decreased their levels over
the past week. Decreases were reported in Aberdeenshire, Argyll and Bute,
Clackmannanshire, Dumfries and Galloway, Orkney Islands, Shetland Islands and
Stirling. Please note that comparisons for Na h-Eileanan Siar and Perth and Kinross
are not possible due to sampling coverage.
17 Scottish Government: Coronavirus (Covid-19): modelling the epidemic (Issue 101, published 9 June 2022)
11Figure 4: National running average trends in wastewater Covid-19 from 31
December 2021 to 1 June 2022, and CIS positivity estimates from 31
December to 21 May 202218 19 20.
Reported Covid-19 Cases
The LFD Universal Offer for asymptomatic testing came to an end on 18 April
2022. In addition, on 1 May 2022 the purpose of COVID-19 testing shifted from
population-wide testing to reduce transmission, to targeted testing and
surveillance. Reported cases will no longer be representative of all COVID-
19 cases in Scotland, and caution is advised when comparing trends in
cases over time. For more information, see the Scottish Government Covid-
19 Test and Protect Transition Plan.
Please note that due to testing policy changes, reported cases will no longer be
representative of all COVID-19 cases in Scotland, and caution is advised when
18 Scottish Government: Coronavirus (Covid-19): modelling the epidemic (Issue 101, published 9 June 2022)
19 The Omicron variant emerged in Scotland around mid-December 2021. After the end of 2021, S-gene dropout
testing data suggest that nearly all cases are from the Omicron variant. During the period of change in the
dominant variant, a change in the relationship between the wastewater SARS-CoV-2 RNA levels and case
numbers was observed and postulated to be due to different levels of virus shed by the two variants. If this
assumption is true, and there is no further change in shedding following the emergence of the Omicron variant
BA.2, then from early January 2022, wastewater SARS-CoV-2 RNA levels should have a consistent relationship
with the underlying Covid-19 prevalence.
20 There was a reduction in the number of samples collected and a delay in analysing samples due to the recent
public holiday. For the same reason, the most recent update to the ONS Coronavirus Infection Survey (CIS) is
the one published on 27 May covering the period up to 21 May.
12comparing trends in cases over time. The regular analyses on case rates in different
age groups and among care home residents are no longer included in this report. By
specimen date, there were 138 weekly combined PCR and LFD cases (including
reinfections) per 100,000 population in the week to 3 June (Figure 5)21. Following a
period of sharply decreasing case rates since mid-March, this represents a slight
increase from the previous week.
Figure 5: Seven-day combined PCR and LFD case rate (including reinfections)
per 100,000 for Scotland by specimen date. Data to 3 June 202222 23.
Cases include Cases include PCR Change in
only PCR and LFD confirmed Testing
confirmed cases cases Policy
2,500
Seven-Day Case Rate per 100,000
2,000
1,500
1,000
500
0
May 2020
Nov 2021
Jul 2020
Nov 2020
Dec 2020
May 2021
Jul 2021
Dec 2021
May 2022
Mar 2020
Jun 2020
Aug 2020
Sep 2020
Jan 2021
Feb 2021
Mar 2021
Jun 2021
Aug 2021
Sep 2021
Jan 2022
Feb 2022
Mar 2022
Oct 2021
Oct 2020
Apr 2020
Apr 2021
Apr 2022
The proportion of reinfections among the total weekly cases has decreased in the
most recent week. By specimen date, there was a total number of 902 reinfection
cases confirmed by either a PCR or LFD test in the week leading up to 3 June. This
represents 12.0% of reported cases24. However, this number is likely affected by
testing changes and this figure may no longer be comparable over time. The
21 Public Health Scotland: Covid-19 Daily Dashboard (accessed 8 June 2022)
22 Public Health Scotland: Covid-19 Daily Dashboard (accessed 8 June 2022)
23 Before 5 January 2022, the case rate includes only positive laboratory confirmed PCR tests. After 5 January
2022, the case rate includes PCR and LFD confirmed cases. From 18 April 2022, the Universal LFD Offer for
asymptomatic testing is no longer available. In addition, on 1 May 2022 the purpose of COVID-19 testing shifted
from population-wide testing to reduce transmission, to targeted testing and surveillance. Reported cases will no
longer be representative of all COVID-19 cases in Scotland, and caution is advised when comparing trends in
cases over time.
24 Public Health Scotland: Covid-19 Daily Dashboard (accessed 8 June 2022)
13proportion of reinfections have increased rapidly since December 2021 and the
emergence of the Omicron variant.
While the LFD Universal Offer for asymptomatic testing came to an end on 18 April
2022 in Scotland, 90,574 LFD tests were reported in the week to 5 June. This is a
3% decrease from the week previously (week to 29 May), when 92,923 LFD tests
were reported. This compared to a peak of 865,561 tests being reported in the week
to 26 December 2021, while the LFD Universal Offer was still in place25.
The Scottish Contact Survey26 continues to ask whether people use LFD tests and if
so how often. Approximately 37% of individuals had taken at least one lateral flow
test within the last 7 days for the survey pertaining to the period 26 May to 1 June,
decreasing from 40% two weeks prior27.
Antimicrobial Resistance and Healthcare Associated Infection Scotland (ARHAI
Scotland) provide analyses on hospital onset acquired Covid-19 infections, where
patients are likely to have been infected after being admitted to hospital, based
on the date when the sample was collected for a first positive Covid-19 test.
Cases where the sample was collected before a hospital admission are
considered community onset cases, while samples collected on day eight or later
are considered nosocomial cases, or cases likely to have been acquired in a
hospital setting. For more information, see this ARHAI weekly publication.
According to data from ARHAI Scotland, 105 nosocomial Covid-19 cases were
reported in the week ending 15 May28. The total number of COVID-19 cases
reported to ARHAI Scotland this week (week ending 15 May 2022) was 341. The
number of nosocomial cases peaked in early January and again in late March, and
has since been decreasing29.
In line with recent changes to testing policy and transitions to long term
strategies in the four UK nations, cases comparison between countries will
no longer be included in the report. For more information see following links for
England, Scotland, Wales, and Northern Ireland.
To compare trends in estimated infection levels in private residential households
across the UK, please see the previous section on the Covid-19 Infection
Survey.
25 Public Health Scotland: Covid-19 Statistical Report Dashboard (published 8 June 2022)
26 The sample is demographically representative of adults aged 18 and older across Scotland, with circa 1500
responses. This is modelled to represent the Scottish population.
27 Scottish Government: Coronavirus (Covid-19): modelling the epidemic (Issue 101, published 9 June 2022)
28 Nosocomial cases include cases where the onset is either probable or definite hospital onset (where the
sample was collected on day eight of hospital cases or later.
29 ARHAI: Hospital onset COVID-19 cases in Scotland (published 8 June 2022)
14Covid-19 Related Severe Illness and Death
Please note that patient testing requirements changed on 1 April 2022, which will
mean a reduction in asymptomatic cases of Covid detected and a corresponding
decrease in ascertained Covid-19 related occupancy and admissions. In addition,
from 1 May 2022, testing changed from asymptomatic population-wide testing, to
targeted testing for clinical care and surveillance. Therefore, data should be
interpreted with caution and over time comparison should be avoided. For more
information, please see this resource from the NHS.
Please note that hospital admissions data in Scotland is dynamic and subject to
daily revisions. We continue to see a large number of mostly upward revisions
which is likely due to infections being identified after patients have been admitted
to hospital. The greatest revisions are likely to impact the latest two weeks of
data and we advise caution in interpreting the latest trends.
Covid-19 occupancy and admissions figures presented in this section may
include patients being admitted and treated in hospital or ICU for reasons other
than COVID-19.
Following changes in the Covid-19 Case definition and changing testing policies
on 5 January 2022, hospital and ICU occupancy figures include patients with
Covid-19 cases confirmed by either PCR or LFD from 9 February and onwards.
Prior to this date, it only included cases confirmed by a PCR test. Hospital and
ICU occupancy include reinfection cases.
Covid-19 admissions to hospital (including for children and young people) include
patients with Covid-19 cases confirmed either by PCR or LFD from 5 January
and onwards. Prior to this date, it only included cases confirmed by a PCR test.
Hospital admissions include reinfection cases. Admissions to ICU only include
PCR confirmed Covid-19 cases.
Hospital and ICU Occupancy
Over the week to 5 June, daily Covid-19 hospital occupancy slightly increased;
however, this is to be interpreted with caution due to recent testing changes. NHS
boards reported 637 patients in hospital or in short stay ICU on 5 June with recently
confirmed Covid-19, compared to 590 on 29 May. This follows a period of
decreasing hospital occupancy numbers after peaking on 2 April with the highest
figure seen throughout the pandemic at 2,406 patients (Figure 6)30.
30 Public Health Scotland: Covid-19 Daily Dashboard (accessed 8 June 2022)
15NHS boards also reported 11 patients in short-stay or long-stay ICU on 5 June,
compared to 8 on 29 May. Due to the changes in testing policy, any interpretations of
trends need to be made with caution (Figure 6).
Figure 6: Patients in hospital (including short stay ICU), and patients in
combined ICU with recently confirmed Covid-19, data up to 5 June 202231 32.
Patients Patients include Changes to
include only PCR and LFD testing in
PCR confirmed cases hospital
settings
3,000 250
Daily Hospital Occupancy
Daily Combined ICU Occunapcy
2,500 200
2,000
150
1,500
100
1,000
500 50
0 0
Nov 2020
Jul 2021
Nov 2021
May 2021
May 2022
Sep 2020
Mar 2021
Sep 2021
Mar 2022
Jan 2021
Jan 2022
Date
Hospital and short stay ICU Combined (short and long stay) ICU
Hospital and ICU Admissions
In the week to 3 June, Covid-19 admissions to hospital33 in Scotland appear to have
increased slightly; however, this is to be interpreted with caution due to recent testing
changes. NHS boards reported 425 weekly admissions to 3 June, compared to 411
31 ICU includes combined ICU/HDU figures and both patients with length of stay 28 days or less and with length
of stay more than 28 days. Please note that only patients with length of stay 28 days or less in ICU were
recorded until 20 January 2021. From 20 January 2021 ICU short and long stay includes both ICU or combined
ICU/HDU with length of stay 28 days or less and with length of stay more than 28 days.
32 Before 9 February 2022, patients were only included if they had a recent positive laboratory confirmed PCR
test. Hospital and ICU occupancy includes reinfections from 7 March 2022 onwards. Patient testing requirements
changed on the 1 April 2022 and population wide testing policy changed on 1 May 2022, which may mean a
reduction in asymptomatic cases of Covid-19 detected and a corresponding decrease in Covid-19 related
occupancy.
33 Covid-19 related admissions have been identified as the following: A patient’s first positive test for Covid-19 up
to 14 days prior to admission to hospital, on the day of their admission or during their stay in hospital. If a
patient’s first positive test is after their date of discharge from hospital, they are not included in the analysis. An
admission is defined as a period of stay in a single hospital. If the patient has been transferred to another hospital
during treatment, each transfer will create a new admission record.
16admissions the previous week ending 27 May. This follows a period of sharply
decreasing numbers of Covid-19 related hospital admissions after reaching the
highest levels seen throughout the pandemic in the week to 18 March 2022 (1,677
admissions)34. As noted above, we are continuing to see a large number of daily
revisions, so figures may change as they are updated35.
In the week to 5 June, the number of new Covid-19 patients admitted to ICU
appeared to fluctuate; however, this is to be interpreted with caution due to recent
testing changes. There were 12 new Covid-19 patients admitted to ICU in the week
to 5 June, compared to 13 in the week to 29 May. This compares to 57 weekly ICU
admissions during the most recent peak in early January 2022. As noted above we
are currently seeing a large number of daily revisions, so the number of admissions
to ICU for the latest two weeks are likely to change (Figure 7)36.
34 Public Health Scotland: Covid-19 Daily Dashboard (accessed 8 June 2022)
35 We have previously not presented data for the last two weeks available due to significant numbers of upwards
revisions to the data. However, as the trend in admissions is changing, more recent data points have been
included. The State of the Epidemic report incorporates hospital admissions data published on 8 June 2022, so
any revisions since then will not be included in this report.
36 Public Health Scotland: Covid-19 Daily Dashboard (accessed 8 June 2022)
17Figure 7: Weekly total of Covid-19 admissions to hospital and ICU with a
positive Covid test in Scotland. Hospital admission data to 3 June 2022 and
ICU admission data to 5 June 202237 38.
Changes to
Hospital Hospital admissions
testing in
admissions include PCR and LFD
hospital
include only PCR confirmed cases
settings
2,000 200
Weekly Total Hospital Admissions
Weekly Total ICU Admissions
1,500 150
1,000 100
500 50
0 0
Nov 2021
Jul 2020
Nov 2020
Jul 2021
May 2020
May 2021
May 2022
Mar 2020
Sep 2020
Jan 2021
Mar 2021
Sep 2021
Jan 2022
Mar 2022
Date of Admission
Hospital Admissions ICU Admissions
The highest number of hospital admissions in the week to 31 May were among those
aged 80 and over. In the same week, approximately 63% of the hospital admissions
related to patients aged 60 or older. This is slightly lower than 67% of admissions in
the week to 24 May. However, the latest data does not have a lag applied to account
for revisions and may be subject to change39.
Average hospital admissions related to Covid-19 in children and young adults data
are no longer updated in the PHS Education Dashboard40 due to a reduction in the
quantity and quality of data available. The last update to the dashboard was on 6
37 Before 5 January 2022, hospital admissions were only included if the patient had a recent positive laboratory
confirmed PCR test. ICU admissions rely on PCR testing only. Hospital admissions data in the chart now
includes reinfections and has been updated to include this methodology retrospectively to the start of the
pandemic. Patient testing requirements changed on the 1 April 2022 and population wide testing policy changed
on 1 May 2022, which may mean a reduction in asymptomatic cases of Covid-19 detected and a corresponding
decrease in Covid-19 related admissions.
38 Public Health Scotland: Covid-19 Daily Dashboard (accessed 8 June 2022)
39
Public Health Scotland: COVID-19 Statistical Report (published 8 June 2022)
40 Public Health Scotland: COVID-19 Education report (published 6 May 2022)
18May 2022 and the latest data was summarised in the State of the Epidemic report
published on 13 May 2022.
In the period 11 May to 24 May 2022, 64% of Covid-19 hospital admissions stayed
longer than 48 hours after being admitted. Analysis from Public Health Scotland on
the same time period shows that length of stay tends to increase with age, as 54% of
hospital stays for those aged 17 or younger had a length of stay of less than 24
hours, while 79% of hospital stays for those aged 80 or older had a length of stay of
over 48 hours41. Please note that length of stay can be influenced by a variety of
factors, and that the figures above may be subject to future revisions due to the
incompleteness of discharge summary information. For more information, please see
the PHS Weekly report.
Please note that patient testing requirements in Scotland and England started
changing from 1 April 2022, with further changes implemented in Scotland on 1
May 2022. Changes covering policies for testing general population and patients
in Wales were set out to start the transition from the end of March. In Northern
Ireland, testing changes in the general population are being phased out from 22
April, with no immediate change to public health advice. For more information see
the following links for England, Wales and Northern Ireland.
Due to the testing differences across the four nations mentioned above, we have
removed the four nations comparisons on hospital admissions and occupancy. From
20 May 2022, Department of Health Northern Ireland stopped reporting data on
cases, deaths and testing. As a result, the four nation comparison will not be
included in this report.
Covid-19 Related Deaths and Excess Mortality
There were 20 deaths where Covid-19 was mentioned on the death certificate in the
week to 5 June. Out of these, there were 13 deaths where Covid-19 was the
underlying cause. The number of deaths where Covid-19 was mentioned on the
death certificate decreased by 57%, or 26 deaths, compared to the previous week
(46 deaths in the week to 29 May).
The 20 deaths where Covid-19 was mentioned on the death certificate in the week to
5 June 2022 is 97% lower than the peak in 2020, when the week ending 26 April
2020 saw a total of 663 deaths where Covid-19 was mentioned on the death
certificate42. This is the lowest number of weekly Covid-19 related deaths since June
2021. The number of deaths continues to be higher among those aged 45 and older,
while Covid-19 deaths among younger age groups have remained at low levels
throughout the pandemic (Figure 8). National Records of Scotland publish a detailed
41
Public Health Scotland: COVID-19 Statistical Report (published 8 June 2022)
42 NRS Scotland: Deaths involving coronavirus (Covid-19) in Scotland (published 9 June 2022)
19analysis on deaths involving Covid-19 in Scotland in their weekly data releases and
monthly report43.
Figure 8: Weekly total number of deaths where Covid-19 was mentioned on the
death certificate, by age group. Data to the week ending 5 June 2022.
Excess deaths are the total number of deaths registered in a week minus the
average number of deaths registered in the same week over the previous five
years (excluding 2020). Measuring excess deaths allows us to track seasonal
influenza, pandemics and other public health threats. Excess deaths include
deaths caused by Covid-19 and those resulting from other causes.
In the week ending 5 June, the total number of deaths registered in Scotland was
836. This was 18%, or 183 deaths, below the five-year average for this week (Figure
9)44 45. In the same week, the number of deaths from cancer was 82 below the
previous five-year average for this week, the number of deaths from respiratory
diseases (not including Covid-19) was 38 below the average, deaths from circulatory
diseases were 23 below the average, and deaths from Dementia and Alzheimer’s
43 NRS Scotland: Deaths involving coronavirus (Covid-19) in Scotland (published 9 June 2022)
44 NRS Scotland: Deaths involving coronavirus (Covid-19) in Scotland (published 9 June 2022)
45 Please note that due to unusual numbers of mortality in 2020, the excess deaths calculation for 2021 use the
average from the years 2015 – 2019. Year 2022 uses data from 2016, 2017, 2018, 2019 and 2021 to calculate
average 5-year period.
20diseases were 15 below the average. Excess deaths from other causes were 36
deaths below the average46.
Figure 9: Weekly deaths from all causes and five-year average weekly deaths
in Scotland. Data to week ending 5 June 202247.
2020 2021 2022
2,100
Weekly number of Deaths
1,900
1,700
1,500
1,300
1,100
900
700
Jul 2020
Nov 2020
Jul 2021
Nov 2021
May 2020
May 2021
May 2022
Sep 2020
Sep 2021
Mar 2020
Mar 2021
Mar 2022
Jan 2020
Jan 2021
Jan 2022
Date (by week ending)
All cause deaths Five-year average
Recent changes to reporting mean that the number of deaths where Covid-19
was mentioned on the death certificate can no longer be compared across the
four nations. In addition, from 20 May 2022, Department of Health Northern
Ireland stopped reporting data on cases, deaths and testing. Therefore, we have
removed the four nations comparisons of death figures. For more information
see the Coronavirus (COVID-19) in the UK dashboard.
46 Please note that Covid-19 deaths are included in all cause deaths, and are counted towards all cause excess
deaths. However, Covid-19 does not yet have a separate category for excess deaths calculation as excess
deaths are compared against a 5-year average. The separate categories of causes of death do not sum to the
total excess due to the omission of a Covid-19 category, and it would not make sense to use the number of
COVID deaths in the previous 5 years as a baseline.
47 NRS Scotland: Deaths involving coronavirus (Covid-19) in Scotland (published 9 June 2022)
21Resilience: Vaccine Uptake, Antibody Estimates, and
Vaccine Effectiveness
Vaccine Uptake
Vaccinations started in Scotland on 8 December 2020 and there has been a very
high uptake. Covid-19 vaccines protect most people against severe outcomes of
a Covid-19 infection, but some people will still get sick because no vaccine is
100% effective. The current evidence suggests that you may test positive for
Covid-19 or be reinfected even if you are vaccinated, especially since the
emergence of the Omicron variant in the UK. The major benefit of vaccination
against Omicron is to protect from severe disease. More information is available
on the PHS website.
By 6 June, over 4.4 million people had received their first dose, an estimated 90.3%
of the population in Scotland aged 12 and older. Over 4.1 million people had
received their second dose, an estimated 86.0% of the population aged 12 and
older. Additionally, over 3.5 million people in Scotland had received a third vaccine
dose, which is an estimated 73.3% of the population aged 12 and older48.
The JCVI now advise a spring booster dose of the Covid-19 vaccine for: adults aged
75 years and over (or who will turn 75 by 30 June 2022), residents in care homes for
older adults, and individuals aged 12 years and over who have a weakened immune
system49. By 6 June, 518,494 fourth dose vaccinations had been administered, with
80.8% of all care home residents having received their fourth dose. It is also
estimated that 88.8% of those aged 75 or older have received their fourth dose50. In
addition, 21,017 fifth doses have been administered.
Covid-19 Antibody Estimates
The analysis of antibody prevalence can be used to identify individuals who have
had Covid-19 in the past or who have developed antibodies as a result of
vaccination. As detailed by the ONS, there is a clear pattern between vaccination
and testing positive for Covid-19 antibodies but the detection of antibodies alone
is not a precise measure of the immunity protection given by vaccination.
According to the ONS Covid-19 Infection Survey, the estimated percentage of adults
(aged 16 years and above) living in private households in Scotland who had
48 Public Health Scotland: Covid-19 Daily Dashboard (accessed 8 June 2022)
49
Coronavirus (COVID-19) booster vaccination | The coronavirus (COVID-19) vaccine (nhsinform.scot)
50 Public Health Scotland: Covid-19 Daily Dashboard (accessed 8 June 2022)
22antibodies against COVID-19 at the 179 ng/mL threshold remained high, at 99.4%
(95% credible interval: 99.1% to 99.6%), in the week beginning 9 May 2022. This
suggests that they had the infection in the past or have been vaccinated51. This
compares to:
99.4% in England (95% credible interval: 99.1% to 99.5%),
99.3% in Wales (95% credible interval: 99.0% to 99.5%),
99.3% in Northern Ireland (95% credible interval: 98.5% to 99.6%)52.
The estimated percentage of adults (aged 16 years and above) living in private
households in Scotland who had antibodies against COVID-19 at the 179 ng/mL
threshold continued to remain high across all age groups, in the week beginning 9
May 2022.
This release of antibody data introduces the reporting of antibody estimates for
children (aged 8 to 15 years) for Great Britain (England, Wales and Scotland) as a
whole. In the week beginning 9 May 2022, the percentage of children in Great Britain
estimated to have antibodies against SARS-CoV-2 at or above the level of 179 ng/ml
was high, at 95.5% for children aged 12 to 15 years (95% credible interval: 91.4% to
97.8%), and 94.6% for children aged 8 to 11 years (95% credible interval: 89.7% to
97.2%).
Vaccine Effectiveness Against Omicron
The UKHSA reported that vaccine effectiveness against symptomatic disease,
hospitalisation, or mortality with the Omicron variant is lower compared to the Delta
variant and that it wanes rapidly. High vaccine effectiveness against all outcomes is
restored after the booster dose, with effectiveness against symptomatic disease
ranging initially from around 60% to 75% and dropping to around 25% to 40% after
15 weeks; however, from 20 or more weeks after the booster dose vaccine,
effectiveness against symptomatic disease has almost no effect. Vaccine
effectiveness against hospitalisation ranged from 85% to 95% up to six months after
the booster dose with little variation between the type of vaccine used for priming or
boost. High levels of protection against mortality were also restored after the booster
dose, with a vaccine effectiveness of 94% two or more weeks following vaccination,
and dropping to around 88% from 10 weeks after the vaccination for those aged 50
and older53.
More data on vaccine effectiveness against the Omicron variant can be found in the
UKHSA vaccine surveillance reports. There is a reduced overall risk of
51 Scottish Government: Coronavirus (COVID-19): ONS Infection Survey - Antibody Data for Scotland (Published
1 June 2022)
52 Office For National Statistics: Coronavirus (COVID-19) Infection Survey, antibody data, UK (Published 1 June
2022)
53 COVID-19 vaccine surveillance report: week 19 (publishing.service.gov.uk)
23hospitalisation for Omicron compared to Delta54 55, with an estimate of the risk of
presentation to emergency care or hospital admission with Omicron approximately
half of that for Delta56. A non-peer reviewed UK study revealed that risk of Covid-19
related death was 67% lower for Omicron when compared with Delta57.
Looking ahead
Scottish Contact Survey
Changes in patterns of mixing will likely impact on future Covid-19 prevalence. The
Scottish Contact Survey measures the times and settings in which people mix where
they could potentially spread Covid-1958. Average contacts from the most recent
wave of the Scottish Contact Survey (26 May to 1 June) indicate an average of 4.9
contacts. This has remained at a similar level compared to the previous wave of the
survey (12 to 18 May).
Mean contacts within the work setting have increased in the last two weeks by 14%
whereas contacts within the other setting (contacts outside home, school and work)
have decreased by 13%. Contacts within the home have remained at a similar level
over the same period.
All age groups with the exception of those within the 50-59 age group have reported
a decrease in contacts.
Modelling the Epidemic
Scottish Government medium-term projections on infections, and hospital and ICU
occupancy are not included in this edition of the report, or the Modelling the
Epidemic Report this week.
54 University of Edinburgh: Severity of Omicron variant of concern and vaccine effectiveness against symptomatic
disease
55 Imperial College Covid-19 response team: Report 50: Hospitalisation risk for Omicron cases in England
56 UK Health Security Agency: SARS-CoV-2 variants of concern and variants under investigation
57 Risk of COVID-19 related deaths for SARS-CoV-2 Omicron (B.1.1.529) compared with Delta (B.1.617.2) |
medRxiv
58 From the 31 March 2022, panels A and B have been merged into one survey and are now run fortnightly.
These data points are reported as at the first day of the survey week. Further details of this are presented in the
Scottish Government: Coronavirus (Covid-19): modelling the epidemic (Issue 101, published 9 June 2022)
24Long Covid-19
According to the Office for National Statistic (ONS), long Covid is defined as
symptoms persisting more than four weeks after the first suspected coronavirus
(Covid-19) episode that are not explained by something else.
The ONS Covid-19 Infection Survey estimated that around 1,988,000 people (95%
confidence interval: 1,938,000 to 2,038,000) in the private residential population in
the UK (3.07% of the respective population; 95% CI: 3.00% to 3.15%) reported
experiencing long Covid of any duration over the four-week period ending 1 May
2022. In Scotland, over the same period, an estimated 155,000 people (95% CI:
142,000 to 169,000) in the private residential population (2.95% of the respective
population; 95% CI: 2.69% to 3.21%) reported experiencing long Covid of any
duration. This compares to:
3.09% in England (95% CI: 3.01% to 3.18%),
3.16% in Wales (95% CI: 2.81% to 3.51%), and
2.71% in Northern Ireland (95% CI: 2.30% to 3.11%)59.
Fortnightly modelled estimates for Scotland are also usually published in the
Modelling the Epidemic report. However, a report on the rate of long Covid-19 has
not been included this week.
Additional data sources
State of the Epidemic report has predominantly focused on the direct impact that
Covid-19 has had on Scotland including infection levels, cases, hospitalisations and
hospital occupancy, deaths, vaccinations, situation across the four nations, as well
as local authorities in Scotland. There are additional sources of data which monitor
wider impacts of Covid-19 on health, societal issues and the economy, which can be
found at the links below. However, please note that these data do not solely
reflect the impact of the Covid-19 epidemic.
PHS wider impacts dashboard. Information presented in the dashboard covers
wider planned and emergency hospital admissions, Accident and Emergency
attendances, NHS 24 contacts, out of hours and Scottish Ambulance Services,
outpatient appointments, as well as various aspects of cardiovascular, cancer,
injuries, mental health, substance use, pregnancy, births and children health.
59
Office for National Statistics: Prevalence of ongoing symptoms following coronavirus (COVID-19) infection in
the UK (published 1 June 2022)
25 NHS Education for Scotland publish weekly data on NHS staff reported as
absent due to COVID-19.
The Care Inspectorate produce weekly data on staff in adult care homes
reported as absent due to COVID-19.
The Scottish Government has published a collection of reports relating to public
attitudes to Covid-19. In addition, school attendance and absence figures are
published here every Thursday afternoon.
The Scottish Government also publish statistics on Scottish Welfare Fund and
Self-Isolation Support Grants, as well as quarterly Scottish Welfare Fund
publication.
Transport Scotland previously published a range of COVID-19 analysis on the
impact on transport and are continuing to monitor transport demand.
Additionally, an annual publication on transport and travel in Scotland is
available here.
For a summary of statistics relating to the economy, please refer to the Monthly
Economic Brief and State of the Economy Reports.
Next steps
As stated above, this report will be discontinued following the publication on 10 June
2022. The PHS weekly report now covers additional content from this report,
including wastewater levels, reproduction (R) number and headline estimates from
the Covid-19 infection survey. However, this report may still be published on an ad
hoc basis when appropriate.
The Scottish Government continues to work closely with Public Health Scotland,
independent academic modelling groups through the UK Health Security Agency
(UKHSA), the Epidemiology Modelling Review Group (EMRG), the Scientific
Pandemic Influenza Group on Modelling (SPI-M), the Office for National Statistics
(ONS), the Scottish Environment Protection Agency (SEPA), Biomathematics and
Statistics Scotland (BIOSS) and YouGov to monitor the Covid-19 situation in
Scotland, as well as the impact of new variants and vaccinations.
The Modelling the Epidemic publication will continue to be published on a fortnightly
basis. This will continue to summarise the main modelling outputs for Scotland,
including the estimates of R, incidence, growth and medium-term projections when
available. The next Modelling the Epidemic publication will be on 23 June 2022.
26Technical Annex
Table 1: The composition of each CIS region in Scotland, by Health Board and
Local Authority area. Local Authority areas map to the Health Board areas.
CIS Region Health Boards Local Authority Areas
Code
123 NHS Grampian, NHS Aberdeen City, Aberdeenshire,
Highland, NHS Orkney, Argyll & Bute, Highland, Moray,
NHS Shetland and Na h-Eileanan Siar, Orkney
NHS Western Isles Islands, Shetland Islands
124 NHS Fife, NHS Forth Angus, Clackmannanshire,
Valley and NHS Dundee City, Falkirk, Fife, Perth
Tayside & Kinross, Stirling
125 NHS Greater Glasgow East Dunbartonshire, East
& Clyde Renfrewshire, Glasgow City,
Inverclyde, Renfrewshire, West
Dunbartonshire
126 NHS Lothian City of Edinburgh, East Lothian,
Midlothian, West Lothian
127 NHS Lanarkshire North Lanarkshire, South
Lanarkshire
128 NHS Ayrshire & Arran, Dumfries & Galloway, East
NHS Borders and NHS Ayrshire, North Ayrshire, Scottish
Dumfries & Galloway Borders, South Ayrshire
27This publication will be available in accessible HTML on the gov.scot website © Crown copyright 2022 You may re-use this information (excluding logos and images) free of charge in any format or medium, under the terms of the Open Government Licence. To view this licence, visit http://www.nationalarchives.gov.uk/doc/open- government-licence/ or e-mail: psi@nationalarchives.gsi.gov.uk. Where we have identified any third party copyright information you will need to obtain permission from the copyright holders concerned. The views expressed in this report are those of the researchers and do not necessarily represent those of the Scottish Government or Scottish Ministers. This document is also available from our website at www.gov.scot. ISBN: 978-1-80435-594-7 The Scottish Government St Andrew’s House Edinburgh EH1 3DG Produced for the Scottish Government by APS Group Scotland PPDAS1103863 (06/22) Published by the Scottish Government, June 2022 ISBN 978-1-80435-594-7 Web Publication PPDAS1103863 (06/22)
You can also read