STEEL MARKET DEVELOPMENTS - Q4 2020 - OECD
←
→
Page content transcription
If your browser does not render page correctly, please read the page content below

STEEL MARKET DEVELOPMENTS

          Q4 2020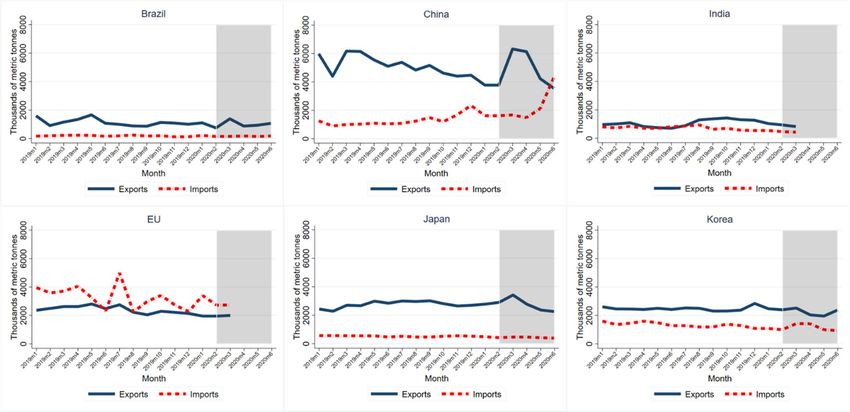
2 STEEL MARKET DEVELOPMENTS – Q4 2020
This paper was authored by Fabien Mercier, Tomohiro Hijikata, Valentina Burrai, Gianpiero Mattera and
Luciano Giua from the OECD Directorate for Science, Technology and Innovation (STI). The paper
benefitted from contributions on COVID-19 and steel value chains from Koen De Backer and the impacts
of COVID-19 on steel demand from Anthony de Carvalho from STI. It was approved and declassified by
written procedure by the OECD Steel Committee on 25 September 2020 and prepared for publication by
the OECD Secretariat.
Note to Delegations:
This document is also available on O.N.E under the reference code:
DSTI/SC(2020)14/FINAL
This document, as well as any data and any map included herein, are without prejudice to the status of or
sovereignty over any territory, to the delimitation of international frontiers and boundaries and to the
name of any territory, city or area.
©OECD (2020)
The use of this work, whether digital or print, is governed by the Terms and Conditions to
be found at http://www.oecd.org/termsandconditions.
________________________________________________________________________
STEEL MARKET DEVELOPMENTS – Q4 2020 3 Table of contents Recent market developments in the global steel industry 5 1. Executive summary 6 2. OECD Economic outlook: the monetary and fiscal responses to the COVID-19 crisis 8 3. Steel consumption 15 3.1. Americas 16 3.2. Africa and the Middle East 16 3.3. Asia and Oceania 16 3.4. Europe and CIS economies 17 3.5. Assessing the impact of COVID-19 on steel demand 17 4. Steel production 22 4.1. Americas 22 4.2. Africa and the Middle East 23 4.3. Asia and Oceania 23 4.4. Europe and CIS economies 23 5. World steel trade 24 5.1. Summary of steel trade developments during the year 2019 24 5.2. Steel trade developments during the first half of 2020 29 5.3. COVID-19 and steel value chains 33 6. Steel and raw material prices 36 6.1. Steel prices 36 6.2. Steel raw material prices 39 7. Financial performance of steel companies 43 7.1. Profitability 43 7.2. Indebtedness 46 8. The global steelmaking capacity situation 51 8.1. Announcements of production cuts, idling and layoffs at steel production plants 52 9. The steel market outlook 57 9.1. The latest professional forecasts and the global steel market outlook 57
4 STEEL MARKET DEVELOPMENTS – Q4 2020 9.2. Regional steel market outlook 57 References 65 Endnotes 74 FIGURES Figure 1. Markit Steel new orders PMI and Steel new export orders PMI 10 Figure 2. Consumption of hot-rolled steel products, major economies (aggregate) 15 Figure 3. World steel apparent consumption 18 Figure 4. Monthly apparent steel consumption by economy 20 Figure 5. Steel demand under COVID-19 compared to a no pandemic counterfactual 21 Figure 6. Trade in goods 30 Figure 7. Global steel production and trade 31 Figure 8. Steel trade, major steel traders 32 Figure 9. The composition of global production 34 Figure 10. Origin of international sourcing in steel 35 Figure 11. Aggregate flat and rebar steel price averages (latest July 2020) 36 Figure 12. Steel price for flat products, by region 37 Figure 13. Steel price for rebar products, by region 38 Figure 14. Steel futures prices (as of 28th August 2020) 39 Figure 15. Prices for key steel-making raw materials (as of June 2020) 41 Figure 16. The upward trend in Chinese scrap prices has recently stabilised (last data point is 27 August 2020) 41 Figure 17. Margin between steel and raw material prices 42 Figure 18. Evolution of operating profits between 1998 and 2019 44 Figure 19. Evolution of net profit margin between 1998 and 2019 45 Figure 20. Distribution of net profits in selected years 46 Figure 21. Evolution of indebtedness between 1998 and 2019 47 Figure 22. Ratio of short term debt over long term debt of steel firms 48 Figure 23. Evolution of interest paid on total debt from 1998 to 2019 49 Figure 24. Ratio of steel firms’ liabilities over assets 50 Figure 25. Evolution of crude steelmaking capacity in OECD/EU economies and non OECD/EU economies 51 Figure 26. Global crude steelmaking capacity and crude steel production 52 Figure 27. Auto sales have dramatically fluctuated in China in 2020 62 TABLES Table 1. OECD Economic Projections of the September 2020 Interim Economic Outlook 9 Table 2. World crude steel production developments in 2019 22 Table 3. Steel trade developments across major steel-producing economies 25 Table 4. Steel exports from the five largest exporting economies 26 Table 5. Steel exports of other major steel producing economies 27 Table 6. Steel imports in the five largest importing economies 28 Table 7. Steel imports of other major steelmaking economies 29

STEEL MARKET DEVELOPMENTS – Q4 2020 5
Recent market developments in the global steel industry
This document is part of a regular monitoring exercise to provide the Steel Committee with
timely information on steel market developments during the year 2020. It provides an
update on recent developments in steel markets, based on the latest information available
at the time of writing (as of July 2020), and as such does not reflect the World Steel
Association’s October 2020 Short Range Outlook (SRO) for steel demand. The section on
the economic outlook has been revised to include information available until September
2020.
6 STEEL MARKET DEVELOPMENTS – Q4 2020
1. Executive summary
Steel market fundamentals continued to worsen in 2019. Steel production growth turned
negative in all regions, with the exception of Asia and the Middle East. Weakening global
economic activity, uncertain prospects for steel demand growth, and the upturn in new
capacity investments in some regions risking to exacerbate supply-demand imbalances are
long-term factors that have been weighing on steel markets. The first half of 2020 was
dramatically impacted by the COVID-19 outbreak, which started in the People’s Republic
of China (hereafter “China”) but quickly spread to the whole world, causing large demand
and production shocks that impacted all economic sectors including steel. Steel production
declined in all regions (in aggregate terms) during the first half of 2020. The reduction in
steel production was however uneven across jurisdictions as production even grew in a
number of some jurisdictions, such as China and Viet Nam. Although the demand and
production shocks caused by the COVID-19 outbreak began to abate in the second half of
2020, the crisis risks resulting in long-lasting and significant impacts on the steel sector.
Digitalisation, new technologies and innovations helped the steel industry minimise the
negative consequences of the pandemic, including through numerous initiatives such as
those described in Box 1. Assessment of the impact of the COVID-19 pandemic are included
in sections 3.5, 5.3 and 8.1.
This document provides an overview of recent steel market developments—including
demand, supply, and prices—and the outlook by region based on information available until
July 2020. The report also incorporates the impact of the COVID-19 pandemic on the steel
industry during the first half of 2020. To summarise, the following key developments are
discussed in this report.
The economic situation: In its June 2020 Economic Outlook, the OECD forecasts
that world GDP will drop by 6%-7.6% in 2020 and rebound by 2.8%-5.2% in 2021,
depending on whether the global economy faces a second wave of the COVID-19
epidemic by the end of 2020. In addition, downside risks to GDP include a further
escalation of trade and cross-border investment restrictions, and financial
vulnerabilities stemming from slowing economic growth and high corporate
indebtedness with deteriorating credit quality.
Steel consumption: According to the World Steel Association (worldsteel)’s Short
Range Outlook released in June 2020, global steel consumption picked up by 3.4%
in 2019. The largest increases were recorded in Viet Nam (9.0%), China (8.5%)
and Russia (5.0%). The largest decreases were observed in Turkey (-15.4%) and
Germany (-12.0%). Steel consumption growth turned negative in the first three
months of 2020 due to the initial impact of COVID-19 on the global economy.
Total steel consumption decreased by 2.4% in this period compared to the same
period one year earlier, with the largest drop year-over-year being in March 2020
(-7.7%). Assessments of the impacts of COVID-19 on steel consumption suggest
that the steel market could face a prolonged period of weak demand.
Steel production: All regions saw declining steel production during the first half
of 2020. Compared to the first half of 2019, crude steel production was more
resilient in the Middle East region (-0.5%), in Asia (-2.3%), in Oceania (-3.3%), in
the CIS (-4.1%) and in Other Europe (-6.3%). In contrast, steel production dropped
sharply in the European Union (-17.9%), in North America (-17.6%), in South
America (-19.9%), in Africa (-20.9%).
STEEL MARKET DEVELOPMENTS – Q4 2020 7
World steel trade: Steel exports continued to decline for most economies in 2019.
Steel export decreases were observed in the United States (-15.7%), Russia (-
11.7%), and Japan (-7.6%) during this period. On the other hand, steel export
growth in India remained strong in 2019 (+21.6%).
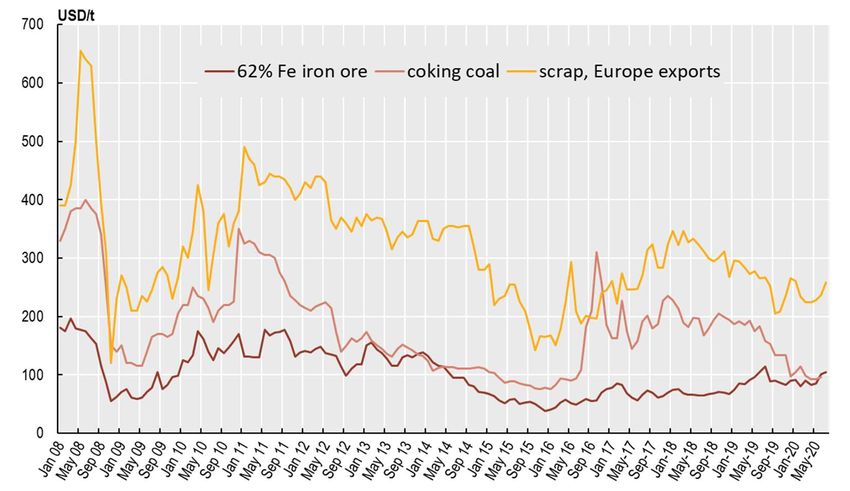
Steel and steelmaking raw material prices: Steel prices continued to decline
during the first half of 2020, and in July 2020 world average prices for both flat and
long (rebar) products were 16% below their levels one year earlier. As of July 2020,
iron ore, coking coal and scrap prices were 9%, 4% and 3%, respectively, lower
than one year earlier. Coking coal prices might currently face more upside than
downside risks, because producers successfully downsized their production. Iron
ore prices are driven to a large extent by Chinese demand. Scrap prices are expected
to remain volatile.
Capacity: Global steelmaking capacity could increase to 2 455.8 mmt at the end of
2020, i.e. by 1.7% (41.8 mmt) from the level at the end of 2019, according to the
available information as of June 2020. World steel production as a share of capacity
is expected to fall from 76.6% in 2019 to 71.2% in 2020.
Steel demand outlook: The June 2020 forecasts of worldsteel points to a decrease
in global steel consumption of 6.4% in 2020, erasing the 3.4% increase registered
in 2019 and most of the gains of 2018. 1 Steel demand is expected to decline
significantly across most economies in 2020, as a result of the COVID-19 crisis.
Chinese steel demand could increase by 1.0% due the faster-than-expected
recovery, according to worldsteel. Other major steel consuming economies like
India, Japan, the European Union and the United States however are projected to
experience demand declines of 18.0%, 19.1%, 15.8% and 22.9%, respectively.
8 STEEL MARKET DEVELOPMENTS – Q4 2020
2. OECD Economic outlook: the monetary and fiscal responses to the
COVID-19 crisis2
Global growth prospects have collapsed following the implementation of stringent
containment measures by governments as they tried to limit or slow down the spread of the
COVID-19 epidemic, which started in Wuhan, China but quickly spread to the rest of the
world. Lockdowns and restrictions placed on economic activity affected almost all sectors,
with travel and leisure being the hardest hit.
In its September 2020 Interim Economic Outlook, the OECD forecasts world GDP to drop
by 4.5% in 2020 and rebound by 5.0% in 2021. Those growth rates are significantly lower
than those of the 2008-2009 global financial crisis. Fiscal balances are set to deteriorate
drastically, as governments around the world launched important support measures in an
attempt to mitigate the damage to the corporate sector and workers caused by the lock-
downs. Fiscal deficits could be 9% of GDP in the median OECD economy, which is around
three times higher than during the 2008-2009 financial crisis. Fiscal balance positions could
turn out even worse than expected due to large uncertainties about the economic impact of
the restrictions, the use of support measures, and the realisation of contingent government
liabilities (e.g. corporate sector loan guarantees). Other risks to the outlook include the
possibility of an escalation of trade tensions, and the financial stability risks stemming from
collapsing corporate earnings and a highly indebted corporate sector.
Table 1 below presents GDP growth forecasts according to the September 2020 Interim
Economic Outlook. Newer updates of the OECD forecasts that take into account the
evolving impact of the COVID-19 pandemic on growth worldwide are regularly updated on
the OECD website.3 In many countries, monetary and fiscal policy stances had remained
largely accommodative prior to the crisis. Central banks who had previously favoured a
normalisation of their balance sheets had already reversed course prior to the pandemic,
albeit with moderate apparent impact on real growth. Following the COVID-19 crisis, fiscal
and monetary stances became even more lenient: central banks around the world cut rates
further, introduced new quantitative easing programmes, and governments devised new
fiscal measures directed towards providing relief to households, SMEs, and corporations.
Disruptions in supply chains due to the COVID-19 pandemic also impacted economic
activity world-wide. Downward pressure on current demand exerted by the lockdowns, as
well as the suspension of medium-term investments, further slowed economic activity,
weighing on an already low investment level, which could become entrenched.4
STEEL MARKET DEVELOPMENTS – Q4 2020 9
Table 1. OECD Economic Projections of the September 2020 Interim Economic Outlook
Real GDP growth (%)
2017 2018 2019 2020 2021
World 1 3.7 3.4 2.6 -4.5 5.0
United States 2.4 2.9 2.2 -3.8 3.5
Euro area 2.7 1.9 1.3 -7.9 5.1
Germany 2.8 1.5 0.6 -5.4 4.6
France 2.4 1.8 1.5 -9.5 5.8
Italy 1.7 0.7 0.3 -10.5 5.4
Japan 2.2 0.3 0.7 -5.8 1.5
United Kingdom 1.9 1.3 1.5 -10.1 7.6
Mexico 2.1 2.1 -0.3 -10.2 3
Korea 3.2 2.9 2.0 -1.0 3.1
Canada 3.2 2.0 1.7 -5.8 4
Turkey 7.5 2.8 0.9 -2.9 3.9
Australia 2.5 2.8 1.8 -4.1 2.5
China 6.9 6.7 6.1 1.8 8.0
India 2 7.0 6.1 4.2 -10.2 10.7
Russia 1.7 2.4 1.4 -7.3 5.0
Brazil 1.3 1.3 1.1 -6.5 3.6
Indonesia 5.1 5.2 5.0 -3.3 5.3
South Africa 1.4 0.8 0.1 -11.5 -4
Note: 1. Moving nominal GDP weights using purchasing power parities.
2. Fiscal years starting in April.
Source: OECD Economic Outlook, Interim report, September 2020, available at:
http://www.oecd.org/eco/outlook/economic-outlook.
Manufacturing activity worldwide has continued to decelerate significantly. Data on global
industrial production show a sharp slowdown in the growth rate in recent months, and the
IHS-Markit index for new export orders of steel intensive sectors, which is a forward-
looking component of the overall Purchasing Managers’ Index (PMI), indicated that a
contraction in global manufacturing activity was expected by large steel buyers (Figure 1).
As of June 2020, all the new orders indices, with the exception of the E.U. index, stand at
50, indicating that there are as many purchasing managers that expect the contraction in steel
demand to continue as there are managers that expect steel demand to increase. In contrast,
all the IHS-Markit PMI indices related to new export orders are still below 50, indicating
that the majority of purchasing managers of steel-intensive industries are still expecting the
contraction in export orders to continue to worsen in the following months (Figure 1).
10 STEEL MARKET DEVELOPMENTS – Q4 2020
Figure 1. Markit Steel new orders PMI and Steel new export orders PMI
Latest data point July 2020
Note: An index reading of less than 50 indicates that more purchasing managers expect a decrease over the next
month than an increase. The last data point represents expectations for the month of July 2020 (and collected
in June 2020 through surveys).
Source: Markit economics, via Datastream
Prior to the COVID-19 crisis, the euro area economy was already suffering from weak
growth in external demand, global trade tensions and policy uncertainty that limited exports
and business investment, according to the Economic Outlook. Real GDP is now expected to
decrease by 7.9% in 2020 and to increase by 5.4% in 2021. The European Central Bank
(ECB) had already been pursuing an accommodating monetary policy in the euro area prior
to the COVID-19, for example introducing, a two-tier system for reserve remuneration5 and
more attractive conditions for longer-term refinancing operations. Since March 2020, the
ECB launched new non-targeted longer-term refinancing operations, lowered twice theSTEEL MARKET DEVELOPMENTS – Q4 2020 11 interest rate applied in targeted longer-term refinancing operations, and eased collateral standards in an attempt to cushion the impact of the crisis and avoid liquidity shortages. In addition, the ECB and regulators provided temporary capital relief to banks, relaxing the rules concerning the provisioning of non-performing loans, inter alia. Furthermore, the ECB has expanded its asset purchase programme by an overall EUR 1 470 billion (12.3% of the euro area 2019 GDP). This mainly consists of the EUR 1 350 billion “Pandemic Emergency Purchase Programme”, which essentially extends previous asset purchases to other asset types.6 National governments of the euro area were allowed a temporary exception from the Stability and Growth Pact budget deficits constraints. Measures with a direct impact on the budget balance represent a discretionary stimulus in 2020 of about 3.5% of euro area GDP in the single-hit scenario. The European Investment Bank also expanded its guarantee schemes to mobilise funding for SMEs. More recently, the European Commission proposed the “Next Generation EU” plan to address the consequences of the COVID-19 crisis. The plan foresees the EU borrowing EUR 750 billion (5.4% of the EU 2019 GDP) on financial markets using the EU credit rating in order to finance grants (about half of the total), but also loans and guarantees, with a focus on. This plan, which is not specific to steel but is directed towards the hardest hit countries and sectors, was adopted on 21 July 20207 and will come into force in January 2021. Government debt in the euro area (Maastricht definition) could increase to 110% of GDP in 2020, from 86% in 2019. In the United States, the economic expansion, which had become the longest on record, was abruptly ended by the COVID-19 crisis and the associated containment restrictions. The OECD expects US GDP to fall by 3.8% in 2020 and to recover by 4.0% in 2021. The Federal Reserve dropped interest rates to 0-0.25% and announced the resumption of (unlimited) large-scale asset purchases, while introducing a number of credit lines to avoid credit drying up. The fiscal response entailed one-off payments to all families and higher unemployment insurance payments (an additional USD 600 per week) in order to shield households from the impacts of the shutdown. The Payroll Support Program, established under Title IV of the Coronavirus Aid, Relief and Economic Security Act (CARES) Act, made funds available to the aviation industry (passenger air carriers, cargo air carriers, and certain contractors) for the continuation of payment of employee wages, salaries, and benefits. 8 t. For SMEs, government loans can become grants if mainly used to support payrolls, in an attempt to minimise the negative impact on employment. Besides the possibility of a second wave, risks to the outlook stem from possible large scale company bankruptcies, given the high built-in of debts and solvency concerns. Financial stability risks already present pre-COVID have worsened, stemming from a combination of historically high asset valuations, a large amount of non-financial corporate debt of decreasing credit quality, and the relative ease to obtain credit at historically low interest rates. The government fiscal balance could reach 132% of GDP in 2020 and 140% of GDP in 2021, from 109% in 2019. In Japan, economic activity has plummeted in the first half of 2020, reflecting the impact of incrementally stepped-up confinement measures, as well as lower external demand. GDP is expected to fall by 5.8% in 2020 and to rebound by 1.5% in 2021. The Bank of Japan has stepped up purchases of various assets, including exchange-traded funds, commercial paper and corporate bonds, and introduced a new operation to provide loans using private debt as collateral at a 0% interest rate. It also decided to purchase government bonds in order to suppress the 10-year maturity government bond yields and target the government 10-year maturity yield around 0%. Regulatory authorities also allowed banks to draw on their regulatory capital and liquidity buffers to support lenders affected by the pandemic. In early April 2020, the government launched a wide range of measures to support households and protect businesses and employment, including cash handouts of JPY 100 thousand (around USD 1 000) to every resident, cash transfers to heavily affected business owners, a rent subsidy to help heavily affected firms, and further financing support for special paid leaves.
12 STEEL MARKET DEVELOPMENTS – Q4 2020
Additional government spending amounted to 4.7% of (annual) GDP during the first half of
2020, and to an additional 5.8% in the second half. The government debt could reach 247%
of GDP in 2020 and 257% of GDP in 2021, from 225% in 2019.
In the People’s Republic of China (hereafter “China”), GDP growth is expected to grow by
1.8% in 2020 and by 8% in 2021. While it started very locally in the Hubei province, the
COVID-19 outbreak disrupted economic activity across the country. Even though lockdown
measures have now been lifted, some businesses have remained shut, and tourism-related
industries and firms heavily dependent on foreign demand have not yet recovered. The
pandemic triggered an increase in precautionary saving and eroded consumer confidence,
thus weakening short-term consumption prospects. Subdued domestic and external demand
is likely weigh on the recovery while also the collapse in world trade is affecting the
economy.
On 11 February 2020, China Iron and Steel Association (CISA) submitted a letter to the
National Development and Reform Commission, to the Ministry of Industry and Information
Technology and to a number of other ministries, highlighting the difficulties faced by the
Chinese steel sector during the pandemic. The letter pushed towards new measures to be
drawn in order to “organize upstream and downstream enterprises to resume work”,
“increase the supply of raw and auxiliary materials such as coking coal”, “increase export
tax rebate rate”, “ease the pressure on the domestic market by providing fiscal and tax policy
support”, and “make loose credit policies to help steel enterprises” (Csteelnews, 2020[1]).
The proposals put forward by the China Iron and Steel Association received positive
responses from relevant ministries and commissions, which proceeded to release a series of
national policy documents for resuming work and production, starting downstream demand,
adjusting taxes and fiscal measures, and lowering corporate loan interest rates (Csteelnews,
2020[1]). During the pandemic, many policies focused on supporting downstream demand.
In order to support the construction sector many local governments introduced real estate
rationalisation control policies and delayed land transfer fees, related taxes and fees, reduced
housing purchase restrictions and lowered payment ratios, which helped the real estate
industry boost sales and increase new construction (China Galaxy Security, 2020[2]). In the
first quarter of 2020, the State Council released a series of construction projects in rural and
urban areas to support the construction industry and promote downstream demand (Lianhe
Credit Rates, 2020[3]).
Infrastructure investment thus held up growth amid collapsing private investment and
foreign demand. The monetary and banking regulation authorities took a host of measures
to mitigate the crisis’ impact on liquidity: it lowered the reserve ratio requirement, reduced
the interest paid on excess reserves, cut the loan prime rate9 and rates on the medium-term
lending facility and on open market operations. Strong credit growth indicated that those
measures were effective in promoting banks to lend. The central bank measures are credited
with helping demand recover and the consequential destocking of the large Chinese steel
inventories (China Galaxy Security, 2020[2]). In March the Ministry of Finance established
a fund to provide financial discount support for loans to key enterprises to ensure prevention
and control of the epidemic. As of June 2020, the fund provided a total of RMB 3 billion in
loan discount to national key enterprises (Ministry of Finance of the PRC, 2020[4]).
Furthermore, it is reported that based on the financial data of large and medium-sized key
steel companies, the steel industry is expected to enjoy supportive dividend policy of about
RMB 17 billion throughout the year 2020 (State Council, 2020[5]).
In India, GDP is projected to drop by 10.2% in 2020 and by 10.7% in 2021. A large support
package representing about 10% of GDP has been introduced, and includes fiscal and
monetary support, as well as guarantee schemes. The Reserve Bank of India cut policy rates,
injected liquidity and softened prudential norms. The government introduced a number ofSTEEL MARKET DEVELOPMENTS – Q4 2020 13 measures to mitigate the impact on the most vulnerable people, including transfers in-kind and cash transfers to about 200 million rural women with basic bank account. It also introduced several measures to reduce financial stress and ease access to funding for various entities, including non-bank financial corporations, micro, small and medium enterprises, farmers, street vendors, firms of the energy sector and real estate companies. The government further announced several structural reforms to encourage investment, including partial deregulation of the agricultural sector and a revision of enterprise size thresholds to reduce incentives for companies to remain small. In Brazil, growth is projected to drop by 6.5% in 2020 and to recover by 3.6% in 2021. Unemployment will likely reach historically high levels before receding gradually. External financing conditions had been deteriorating for Brazil already before the spread of COVID 19 within the country, as international investors’ flight for safe heaven assets increased domestic portfolio outflows and put downward pressure on the real exchange rate and on Brazilian equity prices. Although prices of exported commodities have seen a minor decline since the beginning of the year, driven by sharp declines in oil prices that decreased export revenues, this was compensated by rising agriculture and mineral prices. Monetary policy support in Brazil has taken the form of two interest rate reductions amounting to a joint 1.25% rate cut, combined with prudential and regulatory measures that would allow additional credit extension of up to 17% of GDP. Fiscal policy responses to the pandemic have been sizeable, with a total fiscal impact exceeding 6% of GDP and a strong focus on the low income earners, including workers in the informal economy. Income- support for low income earners amounting to about 2% of GDP includes a temporary benefit of USD 120 per month for informal or unemployed workers earning less than half the Brazilian minimum wage (which is set at about USD 220).10 The benefit is doubled for single parents. Policy support for SMEs amounting to about 1.4% of GDP includes a low- interest credit line to cover wages for employees earning up to two-times the minimum wages. Additional new corporate credit lines will be created by the national development bank. Tax liabilities and other charges on firms are being postponed, particularly for SMEs. The government also increased, by 2% of GDP, its direct spending in health and transfers to states and municipalities, which are responsible for financing the public healthcare services on which two third of the population depend. The temporary increases in government spending, as well as the missed revenues from taxation due to job losses, lower hours worked, and lower corporate and SMEs revenues, are expected to push the country debt to GDP to exceed 90% at the end of 2020, from 75% in 2019. Negative confidence effects upon international and domestic investors as well as higher interest rates are also risks to the Brazilian economy outlook in the medium term.
14 STEEL MARKET DEVELOPMENTS – Q4 2020
Box 1. The steel industry’s innovative responses to the COVID-19 crisis
Security measures and management plans, including the extensive use of teleworking,
were swiftly implemented by the steel industry to protect their employees and minimise
the disruption of the COVID-19 crisis on their business.11 However, steel is not a sector
that can work wholly virtually. Many steel workers need to be physically present in the
plants to operate large equipment in order to make steel. Nevertheless, teleworking was
used to the extent possible. For example, JFE steel does not allow more than 50% of its
workers to come physically to their head office, and promotes teleworking for the
others.12
The industry also responded to the COVID-19 crisis by providing some innovative
solutions to protect employees and limit the spread of the virus. For example, the
company Evraz used a smart phone application, based on the “Stopp Corona”
application developed by Accenture and the Austrian Red Cross, to detect the symptoms
of a potential COVID-19 infection at an early stage and to automatically alert all
employees having been in contact with a person presenting those symptoms to self-
isolate preventively, in an attempt to stop the spread of the virus.13
Furthermore, the industry has also made funds available for medical research on
COVID-19. For example, a team of scientists of the Pohang University of Science and
Technology (POSTECH), a private university established and funded by POSCO,
managed to develop an innovative way to quickly test for viral infections, reducing the
time needed from about six hours to a mere 15 minutes (POSTECH, 2020[6]).
Other industry initiatives include gathering funding for setting up video call facilities
for medicalised patients not being able to physically meet with their friends and family,
and providing information to the most disfavoured communities in terms of prevention
and practical measures to adopt.STEEL MARKET DEVELOPMENTS – Q4 2020 15
3. Steel consumption
Steel consumption growth has turned negative in the first three months of 2020 due to the
initial impact of COVID-19 on the global economy.
Figure 2. Consumption of hot-rolled steel products, major economies (aggregate)
Figure 2 below presents the year-on-year (y-o-y) percentage change in the combined
consumption of hot-rolled steel products for 10 of the world’s largest steel-consuming
economies in Asia, the CIS region, Europe, North America and South America, based on
data published by the International Steel Statistics Bureau (ISSB). Together, these
economies account for approximately 75% of global steel demand. The y-o-y growth figure
chartered into negative territory and it is likely to further deteriorate in the first half of 2020
in light of the diffusion of COVID-19 and the associated containment measures. While ISSB
has not yet published the monthly steel consumption figures for the most recent months, the
Secretariat has calculated various indicators of steel consumption to shed light on the
possible impact of COVID-19 on global steel demand (see Section 3.5).
Figure 2. Consumption of hot-rolled steel products, major economies (aggregate)
Y-o-y % changes
15%
10%
5%
0%
-5%
-10%
Note: Total represents the combined consumption of hot-rolled steel products of the following economies: Brazil, China,
Germany, India, Italy, Japan, Korea, Mexico, Russia and the United States.
The consumption of hot-rolled products is defined as the sum of production and net imports (Platts, 2020[7]).
Sources: OECD calculations based on data from ISSB (International Steel Statistics Bureau).16 STEEL MARKET DEVELOPMENTS – Q4 2020
3.1. Americas
Worldsteel noted that steel demand in the North America region decreased 4.0% to 135.0
mmt in 2019 (worldsteel, 2020[8]). Steel demand in the United States dropped by 2.1% to
97.7 mmt in 2019 (worldsteel, 2020[8]), whereas steel demand in Mexico shrank by 5.5% to
24.2 mmt in 2019, continuing the downward trend of 2018 (worldsteel, 2020[8]). In the first
three months of 2020 the United States monthly steel consumption indicator decreased by
2.1% y-o-y.
According to the Latin American Steel Association (Alacero), consumption of finished steel
products in Latin America fell by about 5% from 67.6 mmt to 64.2 mmt in 2019. Alacero
attributed part of the decrease to the global economic slowdown, lower commodity prices,
the decrease of world trade and political uncertainties and their effects on investment in Latin
America (Platts, 2020[9]). In Brazil, the largest steel-consuming economy in the region,
apparent use of finished steel decreased by 2.7% to 20.6 mmt in 2019 while crude steel
production recorded the lowest figure since 2016 according to Aço Brasil (Platts, 2020[10]).
3.2. Africa and the Middle East
In Africa, apparent use of finished steel (ASU) slightly recovered by 0.4% y-o-y to 36.4 mmt
in 2019 (worldsteel, 2020[8]). By country, apparent use of finished steel in Egypt, the largest
steel consumer in the region, dropped by 6.3% to 10.4 mmt in 2019 (World Steel
Association, 2020[11]). Also, apparent steel consumption in South Africa, another major
consumer, decreased for the second year in a row, from 4.7 mmt to 4.5 mmt in 2019
according to ArcelorMittal South Africa (ArcelorMittal South Africa, 2020[12]). However,
steel demand increased in other African countries (worldsteel, 2020[8]).
ASU in the Middle East contracted by 2.3% to 48.7 mmt in 2019 (worldsteel, 2020[8]). Iran,
by far the largest steel consumer in the region, saw apparent finished steel use decrease by
5.6%, from 19.6 mmt to 18.5 mmt in 2019 (World Steel Association, 2020[11]). The
performance of the automotive sector, where production declined by 24.8% from April to
December 2019 (y-o-y), due to economic sanctions, explains part of the steel demand decline
(Platts, 2020[13]).
3.3. Asia and Oceania
According to worldsteel, steel consumption in China increased by 8.5% y-o-y to 907.5 mmt
in 2019. However, the growth rate probably still incorporates the effect of the closure of
some of the remaining unauthorised induction furnaces that were previously catering to an
unaccounted share of steel demand in China. Without this statistical effect, worldsteel
estimates steel demand growth in China in 2019 to be much lower at 4.0% (worldsteel,
2020[8]). According to CISA, steel demand rose by 6% to 875.3 mmt in 2019 (Platts,
2020[14]). Steel demand growth was mainly driven by the construction sector, where demand
increased by 8% to 486 mmt in 2019. In addition, steel consumption in the machinery,
shipbuilding and household appliance sectors rose respectively by 3%, 3% and 5%.
However, steel demand from the automotive industry suffered a 5% reduction to 52 mmt in
2019 (Metal Expert, 2020[15]). During the first three months of 2020, the monthly steel
consumption indicator for China, which accounts for around half of global steel demand,
registered a y-o-y growth rate of 2.3%.
In India, steel demand continued to grow in 2019 (4.9%), reaching 100 mmt for first time
(worldsteel, 2020[8]). Therefore, India became the second largest steel-consuming economy,STEEL MARKET DEVELOPMENTS – Q4 2020 17
surpassing the United States. However, in the first three months of 2020, monthly
consumption in India decreased by 4.8%.
In Japan, apparent use of finished steel decreased by 3.4% y-o-y to 63.2 mmt in 2019,
according to worldsteel (worldsteel, 2020[8]). Data for 2020 suggest that the contraction of
steel demand has intensified: the monthly steel consumption indicator decreased by 13.9%
y-o-y in the first three months of 2020.
Steel consumption in Korea decreased by 0.9% y-o-y to 53.2 mmt in 2019. Although the
construction sector contributed to demand growth — benefiting from the government’s
temporary stimulus package on residential and public sectors, shipbuilding orders weakened
and automotive production slightly decreased (KOSA, 2020[16]).
According to the South East Asia Iron and Steel Institute (SEAISI), apparent steel
consumption in the Association of Southeast Asian Nations region (ASEAN-6)14 increased
by 1.2% to 81 mmt in 2019 (SEAISI, 2020[17]).
3.4. Europe and CIS economies
According to worldsteel, steel consumption in Europe contracted by 5.6% to 158.1 mmt in
2019 (worldsteel, 2020[8]). This was mainly due to the sustained manufacturing recession
(worldsteel, 2020[8]). The contraction accelerated during the second quarter of 2019, notably
because of the automotive industry, and continued in the fourth quarter. However, the
construction sector has continued to record growth in output and has outperformed other
steel-using sectors (Eurofer, 2020[18]).
In the “Other Europe” region, steel demand decreased by 10.0% to 33.8 mmt in 2019.
Apparent use of finished steel in Turkey dropped by 15.4% to 26.0 mmt in 2019 due to a
slowdown in construction and manufacturing (worldsteel, 2020[8]) (Metal Expert, 2020[19]).
In the Commonwealth of Independent States (CIS) region, apparent steel use (ASU) of steel
increased by 5.6% to 58.8 mmt in 2019 (worldsteel, 2020[8]). Russian ASU of steel products
grew by 5.0% to 43.5 mmt in 2019, compared with the previous year (worldsteel, 2020[8]).
According to the steel company Evraz, this was driven by higher construction activity, amid
changes in the regulations regarding the financing of real estate (EVRAZ, 2020[20]). In
Ukraine, apparent steel consumption increased by 2.1% to 4.8 mmt in 2019. According to
the Ukrainian steel company Metinvest, demand growth was supported by the construction
industry (METINVEST, 2020[21]).
3.5. Assessing the impact of COVID-19 on steel demand
The coronavirus (COVID-19) pandemic that emerged in early 2020 is leading to the steepest
decline in steel demand since the global financial crisis of 2008-09. The speed, scale and
geographic breadth of the downturn is without precedent. The lockdowns implemented in
China in January, and in subsequent months in countries across the world, as well as the
restrictive measures on the movement of people and goods that were necessary to limit the
spread of COVID-19, led to a collapse in sales of goods made out of steel, such as cars,
household appliances and many other durable goods. They also led to a virtual halt in
manufacturing and construction activity around the world, reducing temporarily the demand
for steel, given the steel-intensive nature of these sectors’ production activities.
Figure 3 presents world apparent steel consumption since 1980. As a result of COVID-19,
steel consumption in 2020 is forecast by worldsteel to fall by 6.4%, with partial recovery in
2021 of 3.8% growth (see Section 9 for the market outlook).15 Large reductions in steel
demand were also observed during the financial crisis just over a decade ago, with steel18 STEEL MARKET DEVELOPMENTS – Q4 2020
consumption falling by 7.7% in 2009. Prior to that, the early 1990s was also a period of
significant steel demand contraction, owing to economic recessions across the OECD area
and the severe impacts that the dissolution of the Soviet Union had on steel demand in that
region. Comparable percentage declines in steel demand were also experienced in the early
1980s in the wake of the second global oil shock and the consequent economic recessions.
Figure 3. World steel apparent consumption
Source: worldsteel, Statistical Yearbook, various years
Sectoral differences between the current downturn and previous recessions may determine
the extent to which steel demand declines during the current global recession. Earlier
business cycle downturns have typically been driven by fluctuations in the capacity
utilisation of the steel-intensive industrial sector. The COVID-19 downturn was initially
driven by a collapse in services, notably transport, hospitality, recreational facilities and
segments of retail trade, which are somewhat less steel intensive. However, steel intensive
industrial sectors were also severely affected by lockdowns during the spring months, and,
although some recovery has taken place in recent months as indicated by developments in
the IHS-Markit PMIs, there are risks of renewed weakness as the macroeconomic effects of
slower consumer spending and business investment are transmitted to industrial activity over
time. Furthermore, the resilience of the steel sector towards the COVID-19 pandemic shock
is also likely to be affected by the difficult conditions the steel industry was already
experiencing prior to the pandemic, as opposed to the comparatively better position the steel
industry enjoyed when it was hit by the 2008-2009 financial crisis. Section 0 provides
various indicators on the financial health of the steel industry, and shows, for example, that
the steel sector enjoyed considerably higher operating profits prior to the 2008-2009
financial crisis than prior to the pandemic (Figure 18).
To assess the initial impacts of COVID-19 on steel demand it is perhaps useful to look at
recent monthly steel consumption indicators. Using the most recently available data on steel
production and trade, Figure 4 presents indicators of apparent steel consumption up until
June 2020 for some major steel economies for which such data are available. The indicator
is based on crude steel equivalents, using crude steel production and adding net imports of
steel, the latter being converted from finished products to crude steel equivalent.
In the world’s largest steel-consuming economy, China, the indicator fell in January and
February 2020, but then began to recover in March, with further growth in April to June.STEEL MARKET DEVELOPMENTS – Q4 2020 19 However, it is important to note that apparent consumption is relatively high because production has been running at very high rates in China. In June, China’s daily crude steel output reached an all-time high of 3.053 million tonnes per day, annualised at 1.114 billion tonnes, according to National Bureau of Statistics data (Zhang, 2020[22]). Moreover, apparent steel consumption reflects so-called “real steel use” (a concept that is usually measured by production activity in steel-using sectors) plus the net increase in consumer and merchant inventories of steel. Such inventories have been growing significantly in China recently. Indeed, monetary policy and credit easing may have boosted expectations of future growth in demand for property and infrastructure, spurring growth in inventories and thus boosting the figures of apparent steel consumption growth since last spring (Zhang, 2020[22]). Turning to other economies, the monthly indicators suggest a more modest picture of steel demand and no signs of recovery yet, with the exception of a small uptick in Turkey in June. For example, in the United States the apparent consumption indicator was down by 41% in June compared to January’s level. In Japan the corresponding decline was 38%. In Brazil it was down 33%, in Russia 31%, Mexico 22%, Canada 19%, Korea 17%, Chinese Taipei 13% and in Turkey it was down 10% during the same period. Data for the EU and India are only available until March, when the indicators were down by 11% and 13%, respectively, relative to January levels 2020. These figures do not give fully accurate representations of the impacts of COVID-19 on steel demand, because other factors would have to be distinguished from those related to the coronavirus and its impacts. Many countries have adopted significant stimulus packages to offset the negative impacts of the pandemic on their economies and labour markets, and seasonal and other structural factors may be at play as well. Several economies in Figure 4 experienced declining steel consumption in the corresponding period of 2019, and the seasonal or other factors contributing to those declines may also have been at play after the pandemic emerged in 2020. Thus, COVID-19 might explain somewhat less of the decline suggested by the monthly steel consumption indicators during the first half of 2020. Conversely, several other economies experienced positive growth in the first half of 2019, possibly reflecting structural demand factors, meaning that the COVID-19 impact might be larger than the percentage decline in demand observed after the pandemic, if those structural factors are still at play. Such issues would have to be examined carefully in the future to get more accurate insights on the impacts of COVID-19 on steel demand.
20 STEEL MARKET DEVELOPMENTS – Q4 2020
Figure 4. Monthly apparent steel consumption by economy
mmt mmt
Monthly indicators of apparent steel consumption
18 100
16 90
80
14
70
12
60
10
50
8
40
6
30
4
20
2 10
0 0
IND EU JPN USA RUS KOR CHN (RHS)
Source: OECD
An alternative way to shed light on the impacts of the pandemic on steel demand over a
slightly longer time horizon is to estimate an indicator of steel demand based on the notion
of “real steel use” noted above, which measures production activity in downstream steel-
using sectors weighted by their shares of steel consumption. Real steel use can be estimated
using the Steel Weighted Industrial Production (SWIP) approach, which can be calculated
by using global steel consumption weights and the most recent professional assessments of
production activity in the main steel-using downstream industries.16 To gauge the potential
impacts of COVID-19, steel demand based on the current outlook (taking into account
COVID-19) is compared with a counter-factual based on assessments of production activity
made just before the emergence of the pandemic and subsequent global recession.
Assessments of steel demand based on the SWIP approach should ideally be based on the
most recently available figures for production activity in steel-using sectors. IHS-Markit, a
global economic analysis group, provides the most recent data and projections. In this
analysis, July 2020 sectoral projections by IHS-Markit are used to calculate SWIP, which is
compared to a counter-factual SWIP constructed by using the pre-COVID-19 projections
released in January 2020.
It is important to note that such calculations involve a high degree of uncertainty, and depend
on the assumptions made regarding the economic outlook. Just before the COVID-19
pandemic emerged, IHS-Markit expected world real GDP growth to stabilise at around 2.5%
in 2020, and then recover gradually towards 3% by 2024, reflecting the lagged effects of
central banks’ reflationary policies. The forecast at the time suggested average annual GDP
growth of 2.7%, globally, between 2020 and 2024.
The latest sectoral projections by IHS-Markit released in July 2020 benefit from several
months of observation of the impacts of COVID-19 and policy responses in differentSTEEL MARKET DEVELOPMENTS – Q4 2020 21
jurisdictions. World real GDP is now expected to contract by 5.5% in 2020, followed by a
partial recovery of 4.4% in 2021. The pattern of recovery underlying the forecast is that of
“bounce and fade,” with consumers and businesses remaining cautious. The recent rise in
COVID-19 virus infection rates in several large countries highlights the fragility of the
recovery. World real GDP growth averages only 1.7% during 2020-24. Real fixed
investment, which is a key macroeconomic component that drives steel demand, contracts
by nearly 6% in 2020, with gradual recovery to a growth rate of 3-4% per annum over the
next few years.
Figure 5 compares steel demand under COVID-19 and a hypothetical counterfactual based
on pre-COVID-19 assumptions, in terms of annual per cent changes and index levels in the
SWIP real steel use indicator. The comparisons suggest that the COVID-19 impacts on
demand are significant. For example, the difference in demand growth between the COVID-
19 and the pre-pandemic situation is minus 9.7 percentage points in 2020. In volume terms,
global steel demand in the COVID-19 pandemic is 183 million tonnes lower in 2020 than it
would have been absent the pandemic, using the growth rates suggested by the SWIP
indicator calculated here. Although the annual difference in demand gradually declines after
2020, it remains high and well above 100 million tonnes annually in the period until 2025.
Even in 2025, steel demand is still 114 million tonnes lower compared to what it might have
been absent the COVID-19 pandemic, suggesting significant long-term impacts.
While obviously surrounded by much uncertainty, these estimates highlight the risks for
potentially very weak steel demand in times of COVID-19. Investments in new capacity
should therefore be considered carefully, not least because the demand situation may not be
strong enough in the coming years to absorb even current levels of capacity, which could
pose risks for returns on new capacity investments that are taking place in various economies
around the world. Importantly, governments should not encourage capacity expansion that
would exacerbate the already difficult supply-demand imbalance now facing the global steel
sector.
Figure 5. Steel demand under COVID-19 compared to a no pandemic counterfactual
Annual per cent change Index level
% Ind. 2010=100
8 160
6 SWIP SWIP (pre-Covid-19) 150 SWIP SWIP (pre-Covid-19)
4 140
2 130
0 120
-2 110
-4 100
-6 90
-8 80
-10
Notes: The SWIP index provides an indicator of real steel use. The dark line takes into account COVID-19
while the lighter line is based on the pre-COVID-19 assumptions for production in steel-using sectors. The
SWIP indicator shown in this figure was calculated based on the real sectoral value added of seven major steel-
using sectors, namely, construction (with a weight of 52%), domestic appliances (2%) and electrical
engineering (3%), mechanical engineering (16%), metal goods (10%), automotive (12%) and other transport
equipment (5%).
Source: OECD based on IHS-Markit forecasts for real sectoral value added.22 STEEL MARKET DEVELOPMENTS – Q4 2020
4. Steel production
The COVID-19 pandemic has led to a reduction in world steel production. Overall, world
crude steel production decreased by 5.4% during the first half of 2020 compared to the same
period one year earlier. However, the effects were different across regions, probably due to
the different measures taken by governments and the different degrees and timing to which
the COVID-19 pandemic affected each economy. Table 2 below highlights significant
differences across regions. According to the data provided by worldsteel, compared to the
first half of 2019, crude steel production during the first half of 2020 seemed more resilient
in the Middle East region (-0.5%), in Asia (-2.3%), in Oceania (-3.3%), in the CIS (-4.1%)
and in Other Europe (-6.3%). In contrast, steel production dropped sharply in the European
Union (-17.9%), in North America (-17.6%), in South America (-19.9%), and in Africa (-
20.9%).
Table 2. World crude steel production developments in 2019
Level, thousand tonnes % change, year-on-year
Jan-Jun 2020
Jun 2020 2019 Jun 2020 2019 / 2018
/Jan-Jun 2019
EU 10,301 157,232 -23.4 -17.9 -6.6
Other Europe 3,014 37,333 0.6 -6.3 -8.1
CIS 7,949 100,387 -5.0 -4.1 -0.5
North America 6,651 119,683 -32.2 -17.6 3.4
South America 2,561 41,656 -30.4 -19.9 -4.6
Africa 875 13,530 -21.3 -20.8 -0.5
Middle East 3,264 39,685 -8.5 -0.3 23.9
Asia, of which: 113,297 1,324,832 -2.3 -2.3 11.9
China 91,579 992,869 4.5 2.2 14.9
Oceania 528 6,160 -1.0 -3.3 2.9
World 148,440 1,840,498 -6.9 -5.4 8.0
Source: worldsteel data, as released on July 26, 2020. Data are based on monthly production data and can differ
from annual data published after December of each year. Furthermore, monthly data production can be revised
at any time.
4.1. Americas
In North America, total crude steel production collapsed by 17.6% during the first half of
2020 y-o-y, mainly driven by the decline in the United States, where steel production
contracted by 18.3%. However, the Mexican and Canadian steel industries also experienced
sharp declines in steel production (15.8% and 15.5%, respectively).
In South America, steel production contracted by 19.9% in the first half of 2020, in y-o-y
terms. Production declined sharply in Argentina (-36.6%), Colombia (-29.4%) and Brazil (-
17.8%), while positive growth of 15.8% was recorded for Chile (albeit from an initially low
level).STEEL MARKET DEVELOPMENTS – Q4 2020 23
4.2. Africa and the Middle East
African steel production decreased by 20.8% y-o-y during the first half of 2020. The
decrease was driven by the halving of South Africa’s steel production (-49.4%) as the
country economy, already in recession, was profoundly hit by the lock-downs (Warwick,
2020[23]). Egypt managed to keep its steel production on par during the period, with even a
slight growth of 0.5%.
In the Middle East, steel production was roughly stable over the first half of 2020 (-0.3%
change y-o-y), but the region’s aggregate steel production growth hides large disparities
among countries. Iran’s steel production increased sharply (10.2%)17, while Saudi Arabia’s
production declined (-12.4%). Other countries in the region also saw sharp declines.
4.3. Asia and Oceania
Crude steel production in Asia decreased by 2.2% y-o-y over the first half of 2020, with a
large divergence between China and the rest of Asia. Changes in steel production were
positive in China (+2.2%), driven by infrastructure and manufacturing, with most steel-using
sectors having already returned to pre-COVID production levels by the end of April 2020.
This might have helped balance the impact of falling export demand and its implications for
the Chinese manufacturing sector (worldsteel, 2020[8]). On the contrary, during the first half
of 2020 steel production collapsed in India (-24.2%) and Japan (-17.4%), and contracted in
Korea (-9.5%), with a more moderate decline observed in Chinese Taipei (-4.1%).
In Oceania, crude steel production decreased by 3.3%, with Australian crude steel
production decreasing by only 0.6% (albeit after a significant decrease of 2.9% in 2019).
New Zealand, a much smaller steel producer, experienced a sharp drop of 25% in its steel
production.
4.4. Europe and CIS economies
European Union steel production experienced a sharp decline of 17.9% y-o-y over the first
half of 2020. Amongst the larger steel producers, the contraction was more profound in
France (-26.6%), Spain (-26.4%) and Italy (-19.7%), followed by Poland (-16.1%), Germany
(-15.7%) and the United Kingdom (-8.7%).
In the “Other Europe” region, steel output declined by 6.3% y-o-y over the first half of 2020,
which was less than its 8.5% decline in 2019. Turkish steel output decreased by 4.1%. In the
CIS region, steel output declined by 4.1%; the decline in Ukraine was 7.6% and in Russia
2.9%. Kazakhstan’s steel production, which amounted to about 4.1 mmt in 2019, decreased
by 15.5% y-o-y over the first half of 2020.24 STEEL MARKET DEVELOPMENTS – Q4 2020
5. World steel trade
5.1. Summary of steel trade developments during the year 2019
Global steel trade (defined as global exports, excluding intra-E.U. 27 trade) declined for the
fourth consecutive year in 2019 and amounted to 308 mmt, which represents a 63% decline
compared to 2018.
Trade data suggest that steel exports have continued to decline for most regions in 2019.
Table 4 and Table 5 present data on steel trade developments in the 10 largest steel-
producing economies. Exports from China decreased by 7.4% in 2019 compared to the
previous year, reaching a level of 63.0 mmt. Exports from the European Union (external
trade), Japan, United States, Korea, Russian Federation, Turkey and Brazil have also
declined, by 3.8%, 7.6%, 15.7%, 0.4%, 11.7%, 1.0% and 4.3%, respectively. Conversely,
exports from India increased by 21.6%. Iran, which has recently experienced strong steel
export growth (exporting 9.2 mmt of steel in 2018, i.e. an increase by 64.2% compared to
2016), recorded a 15.3% decline in export shipments in the first four months of 2019.
Turning to steel imports, Table 6 and Table 7 display changes in steel imports in the major
producing economies. The European Union and the United States - the world’s two largest
steel-importing economies - saw steel imports decrease by 11.9% and 14.7%, respectively
in 2019 compared to the previous year. The volume of imported steel products in China,
Japan, Korea, Russia and Turkey increased in 2019 by 8.1%, 7.0%, 9.6%, 6.5% and 0.2%,
respectively. In India and Brazil, steel imports declined by 1.1% and 1.6% respectively, in
2019 compared to 2018. Iran recorded a significant decrease in steel imports of 67.1%,
during January-April 2019, reflecting a demand contraction.STEEL MARKET DEVELOPMENTS – Q4 2020 25
Table 3. Steel trade developments across major steel-producing economies
% change (2019
Thousands of metric tonnes 2016 2017 2018 2019 relative to 2018)
China (People’s Republic of) Exports 107 531 74 238 68 107 63 040 -7.4%
Imports 13 467 13 792 14 221 15 378 8.1%
EU Exports 32 876 34 057 32 145 31 194 -3.8%
Imports 41 836 42 241 46 463 40 916 -11.9%
India Exports 9 933 15 964 10 687 12 994 21.6%
Imports 9 857 8 818 8 964 8 869 -1.1%
Japan Exports 40 452 37 408 35 782 33 075 -7.6%
Imports 5 965 6 186 5 992 6 410 7.0%
United States Exports 8 920 10 081 8 476 7 144 -15.7%
Imports 29 918 34 327 30 612 26 099 -14.7%
Korea Exports 30 504 31 254 29 959 29 853 -0.4%
Imports 23 168 19 208 14 818 16 242 9.6%
Russian Federation Exports 31 104 31 087 33 265 29 382 -11.7%
Imports 4 389 6 407 6 282 6 693 6.5%
Turkey Exports 15 117 16 083 19 552 19 358 -1.0%
Imports 15 344 13 352 10 258 10 279 0.2%
Brazil Exports 13 378 15 301 13 903 13 302 -4.3%
Imports 1 827 2 275 2 339 2 301 -1.7%
Iran Exports 5 623 7 336 9 235 2 8981 n.a.
Imports 4 652 3 065 1 757 2631 n.a.
Notes: The economies listed in this table are the major crude steel producing economies by production volume
in 2019 (World Steel Association, 2020[11]). Iran trade data after May 2019 were not available on ISSB:
Definition used for trade figures: HS 7206 to 7302, 7304-7306, and 7307.21-7307.99 excluding some forgings
(7326.19), points and switches/crossings (7302.30 and 7302.90), some forged cold finished sections (7216.69
and 7216.99), some cold formed sections (7216.61 and 7216.91), welded shapes and sections (7301.20) and
steel castings (7325.99).
1Refers to January-April 2019.
Source: OECD calculations based on data from ISSB (International Steel Statistics Bureau).You can also read