Strong full-year results 2020 leading into further growth - encavis
←
→
Page content transcription
If your browser does not render page correctly, please read the page content below
Strong full-year results 2020
                                                   leading into further growth
                                                   Conference Call, March 24th, 2021, Encavis AG

                         Solar park „La Cabrera“

*) Photo: Solarcentury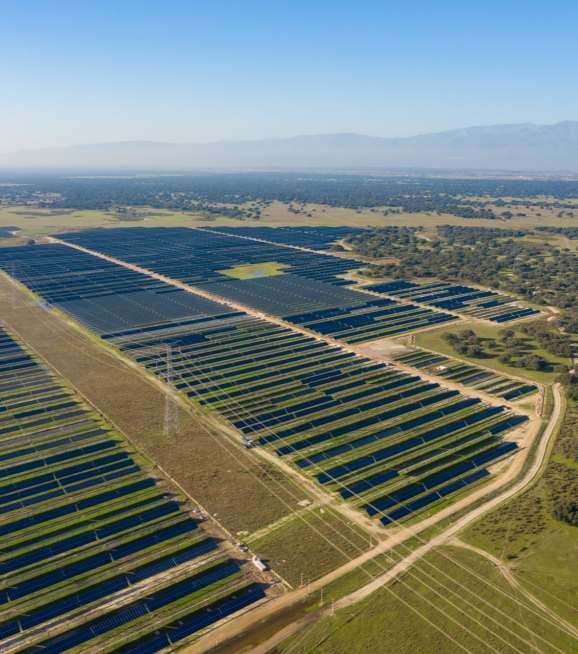
Improving efficiency and cost reduction
trough Economies of Scale and Scope

ENERGY                                                     Encavis Asset
                                                           Management
Energy forms the basis of our
collective activity and work                                     Encavis
                                                     Technical Services /
CAPITAL                                                     Stern Energy
We invest capital to acquire wind farms and
solar parks to generate attractive returns                    Encavis AG

VISION
We are working towards a future with decentralised
power generation from wind power and solar energy

                                                                            2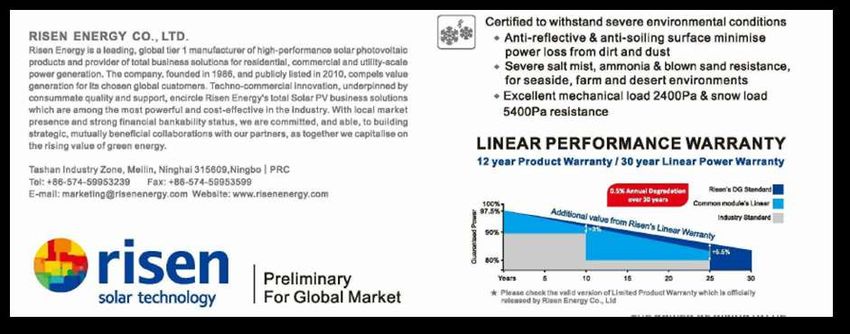
Agenda

1. Encavis at a glance with strong results in FY 2020            04
2. The future of energy is now: Sustainability at Encavis 2020   19
3. Strategic outlook: >> Fast Forward 2025                       26
4. Highlights of 2020                                            33
5. USP of Encavis business model                                 39
6. NO impact of CoVid-19 on the business model                   57
7. New era: PPA – The growing market                             61

Appendix:
I.   The Management                                              70
II. The Encavis Share                                            73

                                                                      Solar park „Talayuela“

*) Photo: Solarcentury
                                                                                       3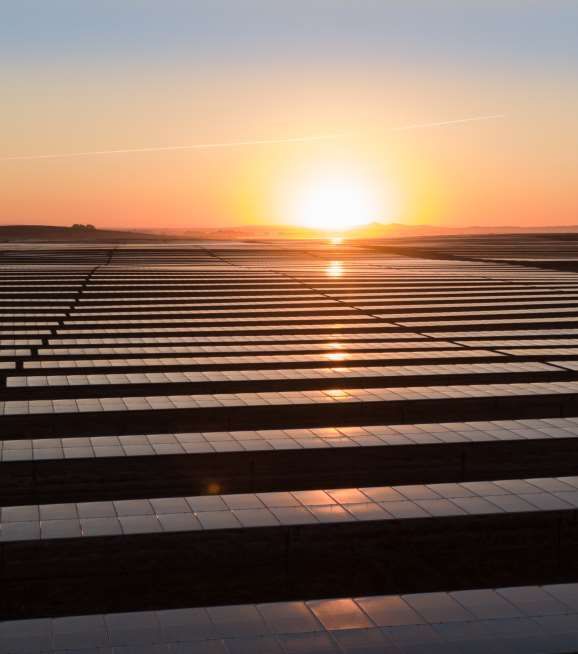
Encavis at a glance
with strong results in 2020

                              4
01    Encavis at a glance

Promise and deliver: Guidance more than fulfilled in FY 2020
with strong growth despite any turbulences and CoVid-19 pandemic obstacles

                                                                                                           Change
                                                                                  Analysts‘
     Operating figures                                             Guidance                               FY 2020/
                            FY 2017    FY 2018       FY 2019                     Consensus      FY 2020
      (in EUR million)                                             FY 2020e                               Guidance
                                                                                  FY 2020
                                                                                                          FY 2020e

 Revenue                    222.4       248.8         273.8         > 280          286.2         292.3     +4%

 Operating EBITDA           166.8       186.9         217.6         > 220          222.7         224.8     +2%

 Operating EBIT             100.4       113.7         132.2         > 130          133.6         132.2     +2%

 Operating Cash Flow        153.0       174.3         189.3         > 200          208.2         212.9     +6%

 Operating EPS in EUR        0.29       0.31           0.43          0.41          0.42           0.43     +5%

Strong growth year-on-year is based on new acquisitions (e.g. Denmark) and parks connected to the grid
(e.g. The Netherlands)

                                                                                                                     5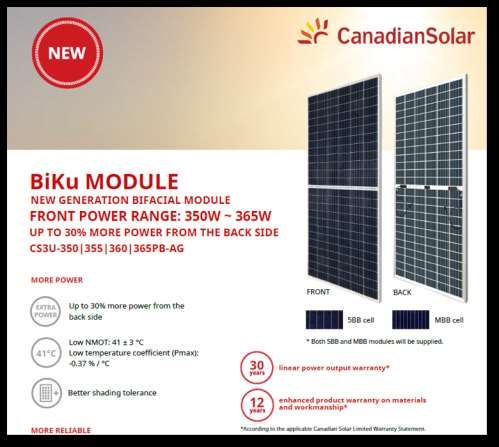
01    Encavis at a glance

Significant revenue growth in 2020 benefitted from new acquisitions /
parks connected to the grid and growing asset management business

     Operating figures
                            Q1 2019   Q1 2020   Q2 2019   Q2 2020   Q3 2019   Q3 2020   Q4 2019   Q4 2020   FY 2020
      (in EUR million)

 Revenue                     59.5      65.2      84.5      89.6      79.5      79.5      50.4      58.0     292.3

 Operating EBITDA            44.7      50.6      76.1      69.0      65.0      61.3      31.8      43.9      224.8

 Operating EBIT              23.4      28.1      54.8      46.5      43.6      38.6      10.4      19.0     132.2

 Operating Cash Flow         15.9      50.8      60.4      64.3      56.4      51.4      56.5      46.4     212.9

 Operating EPS in EUR        0.05      0.08      0.25      0.18      0.19      0.16     – 0.06     0.01      0.43

                                                                                                                      6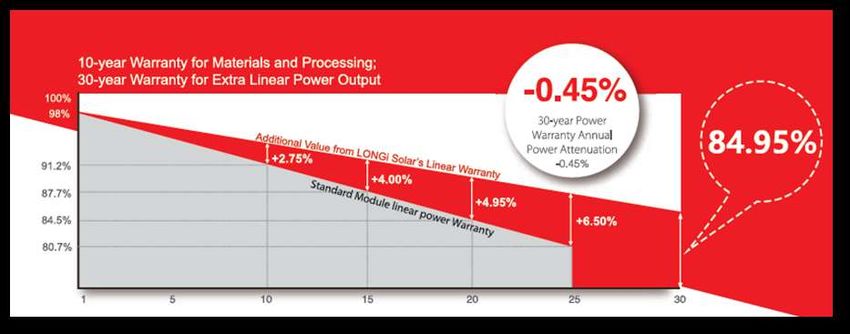
01     Encavis at a glance

Continuously high margins in major operating business segments in FY 2020

                               Solar parks       Wind farms     Technical Services   Asset Management   HQ/Consolidation

      Operating P&L
     (in EUR million)

                             2019      2020    2019      2020   2019       2020      2019      2020     2019      2020

 Revenue                     200.1     198.5   63.1      77.5    4.7         4.6      11.6     16.5       -          -

 Operating EBITDA            167.3     161.0   51.8      62.3    1.5         4.2      5.6       6.7     – 8.6     – 9.4

 EBITDA margin               84 %       81 %   82 %      80 %   32 %        91 %      49 %     41 %       -          -

 Operating EBIT              104.9      95.9   30.4      36.0    1.4         4.2      5.0       6.1     – 9.5     –10.1

 EBIT margin                 52 %       48 %   48 %      47 %   31 %        91 %      44 %     37 %       -          -

Operating expenses distributed among Business Segments
                                                                                                                           7
01     Encavis at a glance

Segment reporting FY 2020 vs Guidance 2020e (in Euro million)

                                Solar parks            Wind farms         Technical Services   Asset Management      HQ/Consolidation

      Operating P&L
     (in EUR million)

                             Actual   Guidance      Actual   Guidance     Actual   Guidance    Actual   Guidance     Actual   Guidance

 Revenue                     198.5      > 190       77.5       > 79   X    4.6        >4        16.5      > 15          -         -

 Operating EBITDA            161.0      > 156       62.3       > 66   X    4.2        >2        6.7       >5         – 9.4      84 % X     91 %        75 %     41 %      41 %           -         -

 Operating EBIT              95.9        > 94       36.0       > 40   X    4.2        >2        6.1       >5         – 10.1    < – 10 ~
 EBIT margin                 48 %        49 %   ~   47 %       50 % X     91 %        75 %     37 %      > 38 %  ~      -         -

Wind volume below average especially in Denmark, Germany and Austria
                                                                                                                                         8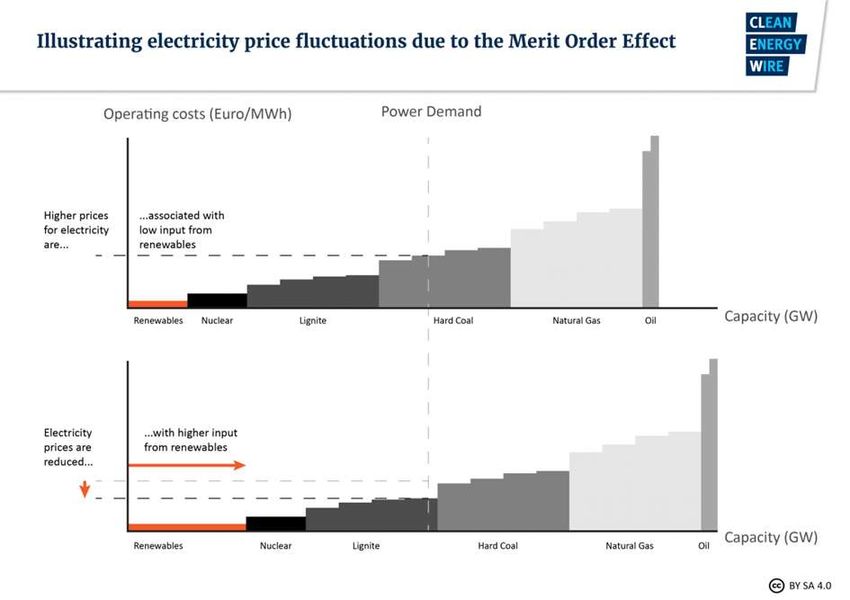
01     Encavis at a glance

Although meteorological conditions in 2020 were far below
the outstanding year 2019 most key figures could be improved

      Operating figures                                                                 Change
                                    2019                       2020
       (in EUR million)                                                               2020/2019

    Revenue                                  273.8                      292.3                      +7%

    Operating EBITDA                         217.6                      224.8                      +3%

    Operating EBIT                           132.2                      132.2                    +/- 0 %

    Operating EPS in EUR                      0.43                       0.43                    +/- 0 %

    Operating Cash Flow                      189.3                      212.9                    + 12 %

▪     Positive meteorological effect in 2020 of EUR 1.9 m compared to 2019 of EUR 10.5 m (EUR -8.6 m)
▪     Aditional Provisions for the virtual Stock Option Programme for the Management due to strong stock
      price increase could be compensated

                                                                                                           9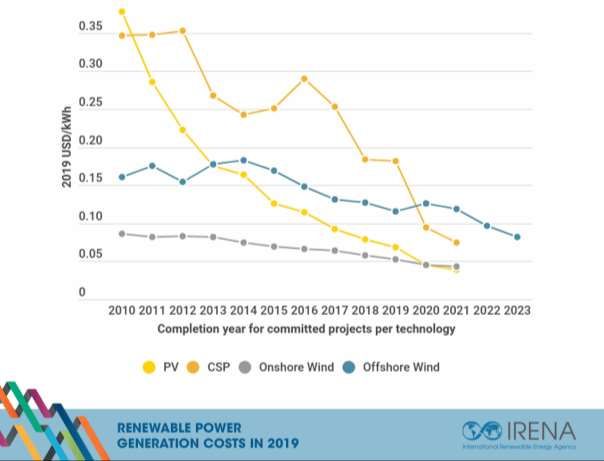
01    Encavis at a glance

Significant cash flow increase in 2020

     Operating figures                                                                      Change
                                    2019                       2020
      (in EUR million)                                                                    2020/2019

 Revenue                                     273.8                      292.3                         +7%

 Operating EBITDA                            217.6                      224.8                         +3%

 Operating EBIT                              132.2                      132.2                     +/- 0 %

 Operating EPS in EUR                         0.43                        0.43                    +/- 0 %

 Operating Cash Flow                         189.3                      212.9                     + 12 %

 ▪    Positive contribution from Encavis Asset Management (EUR +10.3 million) based on strong sales in Q4 2019
 ▪    Positive effect of reimbursement of capital gain taxes (EUR +7.9 million) in 2020

                                                                                                                 10
01 Encavis at a glance
Earnings increase with almost constant margins
Revenue CAGR
+ 26.3 %
Oper. EBITDA
+ 26.3 %
Oper. EBIT 292.3
273.8
+ 25.1 %
248.8
222.4
141.8 217.6 /79.5% 224.8 /76.7%
112.8 186.9 /75.1%
166.8 /75.0%
72.1 106.1 /74.8%
86.8 /76.9%
55.4 /76.8% 113.7 /45.7% 132.2 /48.3% 132.2 /45.2%
100.4 /45.1%
55.4 /49.1% 61.6 /43.3%
34.6 /48.0%
2014 2015 2016 2017 2018 2019 2020
Operating EBIT Operating EBITDA Revenue
1101 Encavis at a glance
Continuously growing operating business
backed by solid equity ratios
Balance sheet total Equity Equity ratio
2,823.8
2020
751.6
26.6%
2,747.0
2019
722.7
26.3%
2,537.1
2018
687.1
27.1%
2,519.7
2017
698.6
27.7%
2,353.8
2016
608.6
25.9%
1201 Encavis at a glance
Encavis #1 among the top 50 Western European solar PV portfolio owners
is paving the way for attractive growth financing in the future
New ESG investors Investment grade issuer rating confirmed in 2020
▪ First „Green Schuldscheindarlehen“ of EUR 50 million ▪ Encavis received Investment Grade issuer rating
sucessfully issued in 2018 by Scope Ratings (BBB-) initiated in 2019
▪ Bond certified by Climate Bond Standard Executive Board ▪ Rating reflects Encavis' risk-adjusted business model,
▪ Encavis got a Primel-Label by ISS ESG (former ISS-oekom) regional diversification as well as the high proportion
and an AA-Level by MSCI ESG Ratings of non-recourse financing
▪ Strong creditworthiness revealed
▪ Positive impact on financing conditions realised
1301 Encavis at a glance
Securing growth capital (2015-2020) while keeping a strong equity ratio
Financing measures implemented (in EUR million)
2020 35 10
2019 48 105 60
2018 50 28
2017 97 44
2016 49 20 25
2015 23
(small) Capital Increase Bilateral Debt, Bonded and "Green" Loans Hybrid Convertible Credit Lines
1401 Encavis at a glance
NO weather adjustments (wa) in future reporting and guidance
Growing number of PPA projects result in an increasing portion of incompletely hedged electricity volumes for Encavis –
in planning as well as in real terms. Encavis is limiting such unhedged positions to 5% (i.e. 3% in 2020):
▪ La Cabrera is currently fully hedged with PPA price fixings for 100% of production volume
▪ Talayuela is currently hedged with its PPA price fixing of 75% of production volume
More and more Feed-in-Tariffs (FiT) are limited to a certain volume of electricity per annum that will be payed
on a fixed price basis (e.g. SDE+ in The Netherlands). Additional volume of electricity (above standard weather)
has to be sold on spot market prices.
Increasing number of electricity markets in Europe are dominated by Renewable Energy driven power plants.
Overproduction of electricity due to very high sun radiation or strong wind volume result in price pressure.
Increase in complexity due to differentiated meteorological conditions in separated electricity price zones.
1501 Encavis at a glance
Moderate growth combined with high margins are expected for FY 2021e
Change
Operating figures Guidance Guidance
FY 2019 FY 2020
(in EUR million) FY 2021e FY 2021e NO weather adjustments (wa)
/ FY 2020
in future reporting and guidance
Revenue 273.8 292.3 > 320 + 9.5 %
due to an increasing portion of
Operating EBITDA 217.6 224.8 > 240 + 6.8 %
market related revenue streams
Operating EBIT 132.2 132.2 > 138 + 4.4 % besides long-term fixed FiT and
PPA energy supply contracts.
Operating Cash Flow 189.3 212.9 > 210 +/– 0 %
Operating EPS in EUR 0.43 0.43 0.46 + 7.0 %
Large Spanish projects „Talayuela“ and „La Cabrera“ distribute significant FY revenue
and operating cash flow to the Group in 2021
1601 Encavis at a glance
Encavis promised and delivered:
Guidance FY 2020e more than fulfilled/same with Analysts‘ Consensus FY 2020e
Analysts' Consensus
March 19, 2021 Analysts' Consensus Analysts' Consensus
Guidance REPORTED Average Extrema Guidance Average Extrema
(in TEUR) FY 2020e FY 2020 FY 2020e Top Bottom FY 2021e FY 2021e Top Bottom
Revenues > 280,000 292,300 286,150 292,000 281,000 > 320,000 328,204 343,700 310,400
Operating EBITDA > 220,000 224,819 222,662 224,855 220,500 > 240,000 252,374 264,700 241,000
Operating EBIT > 130,000 132,158 133,649 139,176 130,350 > 138,000 149,779 160,200 140,000
Operating Cash Flow > 200,000 212,947 208,190 227,039 196,000 > 210,000 228,652 246,400 188,000
Operating EPS (in EUR) 0.41 0.43 0,418 0,440 0,410 0.46 0,477 0,540 0,450
▪ Guidance FY 2020e more than fulfilled in all five Key Performance Indicators (KPIs) ▪ Guidance FY 2021e documents ongoing
▪ Analysts’ Consensus FY 2020e also more than fulfilled in four of five KPIs / growth path to mid-term growth strategy
Operating EBIT achieved ~ 99% (exactly 98.9%) of Analysts’ Consensus >>Fast Forward 2025
▪ Analysts’ Consensus FY 2021e slightly
above Encavis’ Guidance:
Revenue +2.5% / Oper. EBITDA +5.0% /
Oper. EBIT +8.0% / Oper. CF + 8.1% /
EPS +3.5%
1701 Encavis at a glance
Guidance FY 2021e by Business Segments
Solar Parks Technical Services Wind Parks Asset Management HQ/Consolidation
Operating P & L
(in EUR million)
Guidance Guidance Guidance Guidance Guidance
FY 2020 FY 2020 FY 2020 FY 2020 FY 2020
2021e 2021e 2021e 2021e 2021e
Revenue 198.5 > 220 4.6 >4 77.5 > 80 16.5 > 17 - -
Operating EBITDA 161.0 > 176 4.2 >1 62.3 > 65.5 6.7 >7 – 9.4 < – 9.5
Operating EBIT 95.9 > 100 4.2 >1 36.0 > 41 6.1 > 6.5 – 10.1 < – 10.5
Guidance based on the already secured wind farm and solar park portfolio
18The future of energy is now Sustainability at Encavis 2020
02   Sustainability at Encavis 2020

"May the sun be with you"

                                      20
02 Sustainability at Encavis 2020
Our values and corporate culture are actively shaped by our employees
2102 Sustainability at Encavis 2020
Good sustainability work is measured by its goals:
Encavis has identified a total of 12 SDGs on which it wants to focus
https://www.encavis.com/de/nachhaltigkeit/ (DE); https://www.encavis.com/en/sustainability/ (EN)
2202 Sustainability at Encavis 2020
Good sustainability work is measured by its goals:
Encavis aims for concrete change in every field of action (selection)
Strategy & Governance Economy
Strategy & Governance Economy
Material topic: Sustainably integrated corporate strategy Material Topic: Electricity marketing (PPA business)
Goal: Encavis will improve its MSCI ESG rating from "AA" to "AAA" Goal: Significant increase in non-subsidised electricity production
by 2025 by the end of 2025
Social Environment
Social Environment
Material topic: Social acceptance and positive contribution of the Material topic: Help in the fight against climate change through
Encavis Group carbon reduction
Goal: Conclusion of a long-term partnership with a non-profit Goal: Increase share of green electricity purchases to 100%
organisation in 2021 by the end of 2022
2302 Sustainability at Encavis 2020
Our four key sustainability topics
Strategy & Governance Economy
▪ Further development of the energy ▪ Acquisition of new wind & solar parks
system, especially energy storage
▪ Operational excellence
▪ Sustainably integrated corporate Strategy & ▪ Win new asset management clients
strategy Economy
Governance ▪ Electricity marketing (PPA business)
Social Environment
▪ Employee satisfaction Social Environment ▪ Help in the fight against climate
▪ Employee expertise change through carbon reduction
▪ Social acceptance and positive ▪ Sustainable increase in the efficien-
contribution of the Encavis Group cy of existing wind & solar parks
2425
Strategic outlook
>>Fast Forward 2025
03   Strategic outlook >>Fast Forward 2025

Encavis Growth Programme: >>Fast Forward 2025

                   Growth Initiative                                      Economies of Scale and Scope

                   ▪ Investment in RTB and securing early-stage
                     projects primarily focused on PPA markets
                   ▪ Ongoing opportunistic acquisitions in FiT markets   Optimisation of    Optimisation of
                                                                           O&M cost         SPV-financing
                   ▪ European focus for the time being
                   ▪ Disposal of minority participations in projects
                     (mainly wind farms) to diversify local wind risk
                     and to recycle cash
                                                                                   Cash pooling

                                                                                                              27
03 Strategic outlook >>Fast Forward 2025
Encavis Growth Strategy: >>Fast Forward 2025
Increasing operating EPS
from EUR 0.40 to 0.70 and
CAGR of 10%
Increasing operating
EBITDA from EUR 210
to 330 million and
CAGR of 8%
Doubling of signed Solid equity ratio
own capacity of of 24% or more
Operating
1.7 GW (2019) to
EBITDA margin
3.4 GW and CAGR
of 75%
of 12%
Increasing revenue
from EUR 260 to
EUR 440 million
and CAGR of 9%
2803 Strategic outlook >>Fast Forward 2025
Selected measures to fulfill: >> Fast Forward 2025
Pipeline Capacity Growth
▪ Currently strategic partnerships signed ▪ 1.7 GW (end of 2019) of signed own capacity
> developers
with several03 Strategic outlook >>Fast Forward 2025
Sustainable business model – Outlook 2025 of Encavis Asset Management
+ 1.5 to
+ 200 to 300 2.5 bn EUR
+ 15 to 20 new Megawatt p.a. Investment
Power Plants p.a.
+ 150 to 200 million
EUR Equity p.a.
+ 3 to 5 new
Infrastructure
Funds
3003 Strategic outlook >>Fast Forward 2025
Growth strategy based on 2019 fundamentals only
Profitable growth outside Europe
Profitable business models in storage technology
Potential reserves in equity capital market transactions
and dividend policy post 2021
Further opportunities in
Mergers & Acquisitions
Base case scenario:
>> Fast Forward 2025
3103 Strategic outlook >>Fast Forward 2025
Together we strive to improve each and every day
32Highlights of 2020 Encavis news and developments in detail
04    Highlights of 2020

Highlights in 2020 and beyond: The Encavis share

▪    Encavis AG disclosed its growth strategy: >> Fast Forward 2025 that set concrete targets and growth rates in
     its strategic outlook
                                                                                                                         Share             Wind farms &
▪    Encavis’ first online Capital Markets Day 2020 gave detailed insights into the construction progress of the two
                                                                                                                                           Solar parks
     major Spanish solar parks La Cabrera and Talayuela and very limited impact of CoVid-19 on the business model
▪    Encavis AG first virtual AGM approved dividend payment for fiscal 2019 of EUR 0.26 offering the scrip dividend                                     for
     the seventh time in a row and will grant share-holders maximum flexibility to choose receiving cash
     dividend or new shares
                                                                                                                       Encavis Asset
▪    Warburg Research re-initiated active coverage of Encavis AG on Sep 7th with “BUY” recommendation
     and a target price of EUR 17.20                                                                                   Management             Finance
▪    HSBC Germany (HSBC Trinkaus & Burkhardt) initiated active coverage of Encavis AG on Sep 28th with “BUY” recommendation and a target price of EUR 21.00
▪    BlackRock increased their shareholdings in Encavis AG from 3.51% to 4.07% to 5.76% to 7.86% to 8.23% to 8.69% to 9.12% to 9.96% to 10.02% to 10.21% to
     10.39% incl. 5.39% shareholding of their ETF iShares Trust
▪    Invesco increased their shareholdings in their ETF (Exchange Traded Funds) in Encavis AG to 3.16%
▪    2021: ECV is Encavis AG’s new Stock Exchange Initial/Ticker Symbol / Promoted to the MDAX as of March 22 nd
▪    Hauck & Aufhäuser Investment Banking updated their initiated active coverage of Encavis AG on March 1st from “HOLD” to “BUY” recommendation
     with a target price of EUR 23.00
▪    The Goldman Sachs Group, Inc. increased their shareholdings in Encavis AG from 5.96% to 6.46%
▪    UBS Group AG increased their shareholdings to 5.12%

                                                                                                                                                              34
04 Highlights of 2020
Highlights in 2020 and beyond: Wind farms and Solar parks
▪ Encavis and its strategic development partner Solarcentury celebrated the Foundation Stone at Spanish solar
park Talayuela (300 MWp capacity) Wind farms &
▪ Encavis follows its strategy to own 100% of all solar parks within its corporate portfolio consequently. Share Solar parks
Acquisition of the residual shares (20%) of the Spanish major solar project La Cabrera (200 MWp total capacity)
from its strategic development partner Solarcentury is an example of this strategy.
▪ Encavis concludes development partnership with GreenGo Energy Group for a portfolio of subsidy-free solar
parks in Denmark of more than 500 MW
Encavis Asset
▪ Encavis acquires wind farm in Germany with a total of 14.4 megawatts of generation capacity with a
Feed-in-Tariff (FiT) remuneration until year-end 2039 Management Finance
▪ Encavis expands its participation in its solar park portfolio in France and now owns 100% of all its French solar
parks and 95% of all solar parks in the portfolio
▪ Encavis and Sunovis conclude a cooperation agreement for a 200 MW+ portfolio of subsidy-free solar projects in Germany
▪ Encavis sold minority interests of 49% in wind farm portfolio of 36.2 MW in Austria to WIEN ENERGY, Austria’s largest power provider
▪ 2021: Encavis connected the Spanish solar park Talayuela (300 MWp capacity) to the grid and injected the first kilowatt hours (kwh)
into the grid on January 4th, 2021
▪ Encavis expands its participation in its solar park portfolio in The Netherlands and acquires another minority stake (19.99%) of its solar park Budel
located near the city of Eindhoven. Encavis AG currently owns all British, French, Italian and nearly all Dutch and German solar parks (both are close to 99%)
nearly completely.
3504 Highlights of 2020
Highlights in 2020 and beyond: Finance
▪ SCOPE Ratings confirmed its investment grade issuer rating BBB- with stable outlook on Encavis AG in March 2020
▪ The Encavis team supported the Hamburg homeless charity ‘Alimaus’, which was severely affected by CoVid-19, Wind farms &
to help those who are in need the most during the Corona crises with a generous donation Share
Solar parks
▪ Encavis exceeds all expectations in Q1/2020 and benefits from the expansion of capacities with significant
earnings and cash flow increases as well as margin improvement in the wind segment due to positive weather
effects and massive improvement in Encavis Asset Management
▪ Encavis successfully secured a EUR 63.8 million non-recourse project refinancing for a portfolio of 10
Encavis Asset
ground-mounted photovoltaic plants located in Italy with a total capacity of 29.1 megawatts (MW)
Management Finance
▪ Encavis set a clear commitment to sustainability and responsible action and published first insights into its
sustainability strategy on its homepage at: www.encavis.com/en/sustainability/
▪ SCOPE Ratings affirms its investment grade issuer rating BBB- with stable outlook on Encavis AG and Encavis Finance BV in an updated analysis
in October 2020
▪ Encavis is committed to the ten principles of the UN Global Compact as well as to the six principles of the UN Principles of Responsible Investments Network
(UN PRI) – as part of its sustainability offensive
▪ Encavis improves its ISS ESG rating from “B-” to “B” and ranks among the top 20% in the industry cluster “Renewable Energy Operations”
Encavis also improves its MSCI ESG rating from “A” to “AA” and MSCI particularly refers to the very good corporate governance, the transparent ownership
structure and the 100% focus on capacity growth through the production of electricity from wind and solar power
3604 Highlights of 2020
Highlights in 2020 and beyond: Encavis Asset Management
▪ Encavis Asset Management AG (EAM) acquired three solar parks in The Netherlands and one wind
farm in Germany with a total generating capacity of more than 55 MW for the Encavis Infrastructure
Wind farms &
Fund II Renewables Europe II Share
Solar parks
▪ EAM raised additional EUR 74.5 million equity for the special fund ‘Encavis Infrastructure II’ –
Fund volume exceeds EUR 200 million
▪ EAM acquires additional wind farm in France for special fund 'Encavis Infrastructure Fund II’
▪ EAM acquires additional wind farm in France for special fund 'Encavis Infrastructure Fund II’
as well as a floating solar park in The Netherlands
Encavis Asset
Management Finance
▪ EAM further expands the portfolios of its institutional funds and acquires a Finish wind park portfolio with a
nominal capacity of 36 MW benefitting from feed-in-tariffs. Total output of the portfolio managed by EAM increases to over 800 MW.
▪ EAM further expands its portfolio in France and has advised the Luxembourg Encavis Infrastructure Fund II (EIF II) on the acquisition
of the Blueberry open-space solar park with a nominal capacity of around 30 MWp benefitting from long-term feed-in tariffs.
▪ EAM realises 53 MW wind farm portfolio in Germany for the Luxembourg-based special fund Encavis Infrastructure II (EIF II).
▪ Final closing for Special Fund Encavis Infrastructure II (EIF II) of EAM, as it has reached its maximum equity of EUR 480 million invested
by more than 50 credit institutions, will allow an investment volume in wind and solar parks of well over EUR 1 billion.
▪ Encavis Infrastructure Fund III (EIF III) of EAM receives another 150 million euros in equity and acquires the largest solar plant, “Vlagtwedde”, currently in
operation in The Netherlands. This solar park with a nominal capacity of 110 MWp lifts the total output of the portfolio managed by EAM to 1.0 gigawatts (GW).
3704 Highlights of 2020
Compelling reasons to invest in Encavis
Leading independent European IPP in the renewable sector CAGR > 26% CAGR > 31% CAGR ~ 16%
▪ Generation capacity of ~ 2.8 GW
▪ Market capitalisation > 2.4 billion EUR
▪ Equity ratio of ~27% (2020/12/31) 292
273
Valuable portfolio, low-risk substance and low-risk profile 249 242
▪ 190 PV/93 wind parks with long-term Feed-in-Tariffs/PPAs 222 217
▪ Attractive non-recourse financing conditions on project level
187
▪ Ready-to-build/turn-key projects and parks in operation 167
142
Long-term-oriented dividend policy
113 106
▪ Nominal dividend to increase by 50% from 2016 to 2021
87
▪ Dividend offered as scrip dividend (>61% opted for in 2020) 72
57 55
Forward-looking sustainable investment in a dynamic market 36
18 20 22 24 26 28*
▪ Strategic alliances with top project developers 10 15
▪ Fast growing PPA-market
Revenue (EUR mill) Oper. EBITDA (EUR mill) Dividend/Share (EUR cent)
▪ Shaping the industry: customised solutions at competitive
long-term fixed prices with minimal carbon footprint 2013 2014 2015 2016 2017 2018 2019 2020
*Proposal to the general meeting 38Unique Selling Proposition USP of Encavis business model
05    USP of Encavis business model

The four pillars of our business

     Segments                 Business activities

                         Acquisition and operation of ground mounted PV parks

                         Acquisition and operation of onshore wind parks

                         Customised portfolios or fund solutions with an all-round service for institutional investors
                         in Renewable Energies (Encavis Asset Management)

                         Technical operation and maintenance of PV parks by our technical service unit
                         (Encavis Technical Services / Stern Energy)

                                                                                                                         40
05 USP of Encavis business model
Conservative acquisition strategy
for markets with FiT (Feed-in-Tariffs) will be pursued as in the past
Post tax equity IRR for FiT
>7%
PV projects/higher for wind
Market presence for FiT
▪ We acquire ready-to-build, turnkey-projects or existing parks Market entry planned for FiT
with Feed-in-Tariffs and operate them over their technical
and commercial life time
>7%
▪ > 10 years of experience in these markets still allow for >7%
numerous acquisition opportunities in established markets
with satisfying IRRs >6%
▪ Falling interest rates create an increasing competition for
>5%
FiT projects
▪ However, Encavis reiterates its commitment to stated IRR
expectations
>6%
4105 USP of Encavis business model
Conservative acquisition strategy
for markets with PPA projects with increasing importance
Post tax equity IRR for PPA
>7%
PV projects/higher for wind
Market presence for PPA
▪ We acquire ready-to-build, turnkey-projects or existing parks Market entry planned for PPA
and negotiate Power Purchase Agreements with companies
with very good ratings and operate them over their technical
and commercial life time
▪ Our experience from PPA negotiations in Spain (500 MW PV)
and the UK (40 MW PV) enables Encavis to move to emerging >7%
PPA markets like Italy and – in time to come – Germany and
France
▪ IRR minimum requirement depends more on risk distribution
and rating of the off-taker, and to a lesser extent on regulatory
risk
>8%
4205 USP of Encavis business model
Business model: risk structure of an investment over time (wind/solar)
Risk Project life cycle
high
Project Developer Investor & Operator
Completion
risk
Technical
risk
Production
risk Dismantling
RTB1
risk
low
Planning Construction Operation Dismantling
Selected risks COD Connection to the grid
1) Ready to build
4305 USP of Encavis business model
Strategic Partnerships secure future growth
with a pipeline volume of > 3.0 GW over three years
Target markets of the
developing partnerships
Projects
▪ Strategic partnerships with several project developers: realised
Aurora, Greengo, Greifensolar, LTService,
Psaier.Energies, Solarcentury, Sunovis, …
▪ Pipeline of > 3.0 GW in total with projects in Europe Partnership
▪ Projects realised in Spain and The Netherlands Participate
▪ More than 580 MW of pipeline volume realised
& accelerate
in less than one year
▪ Standardisation of processes reduces
transaction costs
PV park in
.....
Encavis Developer
Finance Develop
& operate & build
4405 USP of Encavis business model
Strategic Development Partnerships – Status Quo and Outlook
Mid Stage
> 3 GW of ▪ Encavis currently has 10 Strategic
Development Partners across
New Projects Europe, further ones are being
6-18 months
from onboarded
Development
▪ The Development Partners
Partners
develop the projects for Encavis
Late Stage at a pre-agreed return
are being
onboarded at ▪ Projects failing to reach RTB within
different stages a defined time frame are replaced
by the Development Partners
following 6-24 months
Due Diligence
PPA origination, financing, and construction
RTB1
timing according to Encavis’ requirements
1) Ready to build
4505 USP of Encavis business model
Recent acquisition of minorities lead to
ownership in solar parks of > 95 per cent on average
190 solar parks and 93 wind parks in 10 European countries: total capacity ~ 2.8 GW
Wind parks Own Assets (net/gross) Asset Management
Germany 181 / 229 MW 0 / 404 MW
France 36 / 36 MW 0 / 126 MW
Austria 19 / 36 MW 0 / 17 MW
Finland - 0 / 49 MW
United Kingdom - 0 / 18 MW
Sweden - 0 / 10 MW
Italy 5 / 6 MW -
Denmark 118 / 120 MW -
Total 359 / 427 MW 0 / 624 MW
Solar parks Own Assets (net/gross) Asset Management
Germany 258 / 262 MW 0 / 103 MW
Italy 154 / 154 MW 0 / 7 MW
France 194 / 194 MW 0 / 70 MW
United Kingdom 127 / 127 MW -
The Netherlands 104 / 106 MW 0 / 197 MW
Spain 440 / 500 MW -
Total 1,278 / 1,343 MW 0 / 377 MW Market presence
Market entry initiated
Group total Own Assets 1,637/1,770 MW Group total 2,771 MW
4605 USP of Encavis business model
Encavis Portfolio: PV accounts for > 75% of the Encavis Portfolio
Encavis Portfolio by technology Asset Management Portfolio by technology
Capacity Wind 24% PV 38% Installed base
~ 1.8 GW ~ 1.0 GW
Average PV*) park Average PV park
5.1 MW 15.7 MW
*) excl. Spain
Average wind farm Average wind farm
10.2 MW 12.2 MW
PV 76% Wind 62%
Most of the Renewable Energy Portfolio of Encavis is based on a FIT: ~ 13 years remaining FIT maturity
4705 USP of Encavis business model
Segment Technical Services / Stern Energy –
Operational and Technical Management of our parks
Parks managed by ETS / Stern Energy
1000
In MW
Broad technology experience: 899
Specialised in technical 900
operation of PV parks Crystalline/thin-film modules
800
since 2008 Central and string inverters
Different monitoring systems 700
600
Company
profile 500
400
Services are
283
provided locally 300 247
Company is accepted
by project-experienced by financing banks 200
engineers, technicians 136
and mechanics 100 47 69
0
2010 2011 2017 2018 2019 2020
4805 USP of Encavis business model
Encavis focused on growth to skim Economies of Scale
Portfolio is actively managed by international and experienced team (examples)
Measures implemented Status
Negotiations with local authorities by Encavis workforce comprising native speakers
Ongoing
from all countries where Encavis is active
Financial optimisation by releasing reserve accounts due to high performance Q4 2018 –
of parks and trust in Encavis Q4 2019
Optimisation of insurance by auctioning all insurance contracts of Encavis parks
in a European wide process. Leading to an improved coverage and reduction 2018
of premiums by 40 per cent
Optimisation of low level operation contracts by clustering parks and auctioning service
2018
with local suppliers
Digitalisation of the business – improving technical availability by remote control
Ongoing/
of the parks, implementing a digital backbone for data flow from the parks via
2018
accounting into IFRS statement
4905 USP of Encavis business model
Encavis is focused on growth to skim Economies of Scope
Constant Constant
monitoring Onsite visits improvement Maintenance
of parks of parks
▪ Integration of all parks into our ▪ Failure analysis and repair ▪ Regular screening of solar ▪ Solar park maintenance by
centralised 24h control room works directly on site parks with GPS-navigated own experienced employees
are conducted by experienced drones with thermo cameras or supervision of trained
▪ Calculation of yield reports and
and trained teams to detect hotspots subcontractors
simulations based on actual
irradiation levels ▪ Our service vehicles ▪ Re-energisation of PV parks ▪ Wind park maintenance
hold comprehensive stock to stop degradation of modules usually done by turbine
▪ Handling of failure reports
of spare parts manufacturers / regular
365 days a year ▪ Investment into winglets
▪ For major repairs teams of the maintenance service
to improve rotation of
▪ Management of fast response supervised by onsite
component manufacturers wind blades in our wind farms
fault clearance actions accompaniment
are requested to improve energy production
(for instance defective power of our own experienced
sections) employees
5005 USP of Encavis business model
The „golden end“ of Encavis‘ power plants
Illustration of the different cash flows of a solar par (PV)
As the loan is paid-off during the FIT-period, parks are very profitable in the “golden end”
“golden end“ Assumptions
In EUR
000’ Closing of Solar-park connected
Financial Obligation debt to the grid in 2010 with
(loan) reserve FIT for 20 years (t20)
accounts
Park was bought in Q2
2011, 2012 first full-
year of operation (t2)
Interest
End of FIT
EBT Non-recourse
project financing
will be serviced and
CF to Equity paid-off by the park
t2 t3 t4 t5 t6 t7 t8 t9 t10 t11 t12 t13 t14 t15 t16 t17 t18 t19 t20 Time (t)
5105 USP of Encavis business model
„golden end“-PV parks are still with high efficiencies and lowest marginal costs
“NREL now finds, 25 years later, that the long-term degradation of the studied modules was 0.5% a year, with an efficiency,
today, of around 88% of the original panel performance.*)”
Module
Performance of PV-modules after 25 years Example: Cash flow for one solar park
performance Costs do not exist in golden end
in % 100 or are under Encavis’ discretion
Performance of solar modules
17,779
95
Do not incur
in golden end
90
16,096
58,082
85
40,303 5,579
1,826
Observed Expected future performance
80
performance of our PV parks according to 16,802
at our parks observations
75
0 10 20 years in service Revenues OPEX Operating Loan Interest Tax Cash Flow
(EUR) Cash Flow repayment
*) First Solar’s PV module tech completes 25 years of testing at NREL – National Renewable Energy Laboratory (U.S.A.)
52
from pv magazine USA / December 14, 2020 / Eric Wesoff05 USP of Encavis business model
Lifetime assumptions of PV parks differ nowadays substantially
from IFRS accounting standards
Historical accounting rules Todays business reality
As the technology has proven to be mature, investors are increasingly extending their
According to all GAAP/IFRS valuation period (up to 50 years) and land lease agreements are currently being renegotiated
or extended to allow a longer operation of the plants.
it is mandatory to indicate
a useful life for an asset 30 years can be taken for granted:
that is capitalised. Due to Performance warranties of 30 years for new modules is currently a “de facto” industry standard
the lack of historical data as confirmed by the extracts from official data sheets on the following pages
(utility-scale plants have
been built from 2005 30 years ++ can be assumed due to following reasons: *)
onwards) Consistently dropping technology costs will allow operators to either . . .
+ Ongoing optimizations of the portfolio at very low replacement costs or
accountants and investors + Increase the power of the plants once the subsidy schemes are faded out
have focused on the
duration of the subsidy There is also an increasing portion of already acquired land as well as strategic ambitions
schemes (usually 20 years) to acquire the land on which solar plants are operating or are being developed.
and/or
Encavis’ land leases/acquisitions allow long useful life / Extension . . .
of the land leases
(usually 25 to 30 years) . . . to 30 years in 45% of Portfolio (PF) in NL
to estimate the useful life. . . . to 30 years or longer in > 60% of PF in FRA / in 50% of PF in IT / in 30% of PF in UK
. . . up to 2050 plus unlimited number of extensions of 5-year-periods in ES / an evergreen contract
*) https://www.pv-magazine.com/2018/12/17/revamping-and-repowering-the-size-of-the-opportunity/
5305 USP of Encavis business model
PV module warranties of 30 years are current standard (I)
5405 USP of Encavis business model
PV module warranties of 30 years are current standard (II)
RISEN ENERGY
Jinko Solar
5505 USP of Encavis business model
State-of-the-art infrastructure and technology result in stability, reliability
and very low risk business model: Sustainable valuation of all assets
Minimal developing risks result in investment grade rating BBB–/stable outlook
Long-term (10Y) dividend policy reflects increasing cash flows from operations
Revenue and earnings increase (5Y/CAGR >30%) with constant margins
NO impact of CoVid-19 on the operating business
Secured liquidity for the whole cash planning-period
NO interest rate risk (100% fit of financing to FiT/PPA)
Almost NO FX risk (GBP hedged until end of 2023)
Almost NO energy price risk (CoVid-19: NO impact NO impact of CoVid-19 on the business model
06   No impact of CoVid-19 on the business model

NO impact of CoVid-19 on the operating business
of generating energy from Renewable Resources

                                                   Encavis is well prepared for turbulent markets

  Remote controlled               Secured revenue         Secured liquidity    Very limited impact   Macro hedges in all          Technical
 operation of ground                  based on             for the whole      on guidance 2020 by    parks limit currency       maintenance
   mounted PV and                   Feed-in-Tariffs        cash planning       delayed connection     exposure down to       of PV parks by our
 onshore wind parks                 for remaining          (covering the        to the grid of the   dividend payments.       technical service
                                     13 years (on         next 18 months)        Talayuela (ESP)      Currency exposure       unit (ETS / Stern
 NO risk at business                average) and                 and          PV park by maximum     is limited to Danish        Energy) was
 as usual / The sun                Power Purchase             IT-based           two weeks until       Crown (DKK) and       affected to a minor
  is shining – The                   Agreements           payment system        years-end 2020       British Pound (GBP).      extend of a few
   wind is blowing               (PPAs) for 10 years         TIS in use                               While DKK is very        weeks delayed
                                                                                                      stable, the volatile         services
                                                                                                        GBP is hedged
                                                                                                     already until end of
                                                                                                             2023
                                                                                                     → NO currency risk

Sustainable valuation of all assets and NO doubt on the Growth Strategy >>Fast Forward 2025
                                                                                                                                             58
06 No impact of CoVid-19 on the business model
200 MW PV park „La Cabrera“ connected to the grid
▪ The High Voltage section (substation and transmission line)
is grid connected and energised since August 2020.
▪ The power plant is fully built up and achieved to start
partial operations on September 3rd, while all sections
were in operations since October 1st, 2020.
▪ At the end of October the cumulated actual production
of energy was approximately 30,000 MWh despite the fact
that the plant was still in commissioning phase.
▪ First invoices of energy production for the months of
September and October were sent to AWS amazon web service
in Spain.
▪ The agreed extra costs due to CoVid-19 are equal to
TEUR 240 as of end of October 2020.
5906 No impact of CoVid-19 on the business model
300 MW PV park „Talayuela“ connected to the grid
▪ The High Voltage section (substation and transmission line)
is grid connected and energised since December 2020.
▪ The power plant is fully built up and started to inject
the first kilowatt hours (kwh) into the Spanish grid on
January 4th, 2021.
▪ The electrical works (installation of cables, inverters,
transformers, switches, security system and SCADA)
were completed within December 2020.
▪ The agreed extra costs due to CoVid-19 in spring 2020
are equal to TEUR 250.
60New era: PPA Encavis as a European first mover 61 61
07   New era: PPA

 National shutdown plans of nuclear and coal driven
 generating capacities in Europe until 2040

                      Free of nuclear                              Free of nuclear       Free of nuclear
                      driven powerplants:                          driven powerplants:   driven powerplants:
                      ▪ Germany (2022)                             ▪ Spain (2035)        ▪ Sweden (2040)
                      ▪ Belgium (2025)

                      -- 14.0 GW                                   -- 7.1 GW             -- 7.6 GW

      2021                until 2025            until 2030             until 2035             until 2040
                          -- 31.9 GW            -- 45.5 GW             -- 52.6 GW             -- 112.8 GW

Current Situation     -- 17.9 GW            -- 13.6 GW                                   -- 52.6 GW
Free of coal driven   Free of coal driven   Free of coal driven                          Free of coal driven
powerplants:          powerplants:          powerplants:                                 powerplants:
▪ Austria             ▪ France (2022)       ▪ Finland (2029)                             ▪ Germany      (2038)
▪ Belgium             ▪ UK       (2024)     ▪ The NL (2029)
▪ Sweden                                                                                 ▪ Czech Rep. (2040)
                      ▪ Italy (2025)        ▪ Denmark (2030)
                                            ▪ Spain       (2030)
                                                                                                                 62
07 New era: PPA
National shutdown plans for nuclear and coal driven generating capacities
Country Coal driven Power Plants Nuclear Power Plants
Germany Until 2038 47.0 GW Until 2022 8.1 GW
Poland ---- 29.5 GW ---- 0.0 GW
Czech Republic Until 2040*) 8.4 GW ---- 3.9 GW
Austria Today already 0.0 GW Today already 0.0 GW
Italy Until 2025 8.5 GW ---- 0.0 GW
Spain Until 2030 5.1 GW Until 2035 7.1 GW
France Until 2022 3.1 GW ---- 63.1 GW No plan
United Kingdom Until 2024 6.3 GW ---- 8.9 GW currently
Belgium Today already 0.0 GW Until 2025 5.9 GW
The Netherlands Until 2029 4.5 GW ---- 0.5 GW
Denmark Until 2030 2.2 GW ---- 0.0 GW
Sweden Today already 0.0 GW Until 2040 7.6 GW
Finland Until 2029 1.8 GW ---- 2.8 GW
Fixed plan
Total 116.6 GW 107.9 GW
Plans in progress
6307 New era: PPA
Solar utility scale with comparably low
Levelized Costs Of Energy (LCOE) Production
The cost of energy production
from conventional sources
is set to increase, as prices for
CO2 emissions in the EU rise
with the application of taxes
and certificates
Encavis‘ (2nd phase of the EU CO2 certificate
focus trading scheme and additional
national legislations)
Securing the
cost advantage for
renewable energy
in the long term.
Source: CM-CIC Research on „Renewable Energies“ covering Albioma, Encavis and Voltalia, June 5th, 2020 6407 New era: PPA
LCOE/Levelized Costs Of Energy Production
continue to fall for PV/solar and wind power technologies
Today, plant construction costs (including components and materials)
in utility scale (10 MW and above) in Europe vary between EUR 0.4m/
MWp and EUR 0.475 m/MWp, including 30 years warranty on key
components such as modules. Common expectations are further
decreases in the near, mid and long term.
Current O&M prices are at around 3.5 to 7 EUR/KW p.a. according to
the age and size of the plant. The termination of old contracts and
renegotiation of the terms will lead to a substantial reduction in the
average O&M expenditures.
We expect additional reduction in O&M costs due to consolidation in
the O&M market and increase of professionalisation in the market.
Encavis’ strategic move: Participation in Stern Energy
(O&M company with 1+GW under management) and
standardisation of all O&M activities.
Source: IRENA, International Renewable Energy Agency, Renewable Power Generation Costs in 2019 6507 New era: PPA
Strong decline in LCOE/Levelized Costs Of Energy Production
for PV/solar is mainly driven by PV module prices
Price development for PV modules (USD real 2,000/Wp)
This cost decrease applies to park maintenance,
lease payments and interest rates as well.
Source: BNEF, Warburg Research on SDAX, Renewables, Encavis, 07.09.2020 6607 New era: PPA
Electricity price fluctuations due to the
Merit Order Effect
In the very conservative assumption of an energy only
market, thus a market in which only the produced
power is compensated, without any compensation for
the mere readiness for power production (capacity
market), the power price would be determined by the
“merit order” – the sequence in which power stations
contribute power to the market, with the cheapest offer
made by the power station with the smallest operating
costs setting the starting point – and not by the LCOE.
While it is true that renewables lower the entrance price
due to their low operating costs and push more
expensive conventional producers down the merit order
(see chart to the left), it is also true that the price for
the energy is set by the plant with the highest operating
cost that is still necessary to be activated in order to
meet the demand.
Source: https://www.cleanenergywire.org/factsheets/setting-power-price-merit-order-effect 6707 New era: PPA
Encavis manages uncertainties in power demand,
power supply and corresponding pricing risks
Sophisticated Energy risk management as key value leaver short to mid term:
▪ Traded products in liquid markets (1-5 years ahead)
▪ PPAs for non-liquid markets (5 years ++)
▪ Matching inherent energy risks by portfolio optimisation
European goal for CO2 free power production will either lead to . . .
▪ a CO2 price regime as part of power prices in order to stimulate investments in Renewable Energy
▪ the introduction of capacity markets for Renewable Energy (REE) in order to allow for new build
▪ a self-regulated energy only market where power prices incentivise enough new build capacities in REE
Long-term price curves*) observation as well as introduction of proprietary energy pricing model
▪ Captured prices for wind and solar (accounting for the expected cannibalisation effect)
▪ Introduction of storage as appropriate
*) from various reknowed 3rd party providers
6807 New era: PPA 69
Positive development of PPA power prices are seen
by all leading energy price forecasters
▪ All major forecasters of
energy prices do see positive
development of energy prices
Liquid Market Horizon Illiquid Market Horizon in the future.
▪ Main drivers for energy prices
Long-term PPAs are: CO2 certificate prices,
capacity additions of
Standard products
renewables acompanied with
cut down of capacities of
conventional power plants.
Baseload Power Price
▪ Even the most conservative
forecaster (#3) sees energy
LCOE for Solar PV as of June 2020… market prices which are fairly
above current (and, obviously,
future) LCOEs enabeling
...are expected to decrease further
additional investments into
renewables.
2021 2026 2031 2036
Forecast 1 Forecast 2 Forecast 3
69Appendix I. The management II. The Encavis Share
08   Appendix: The management

Management team with great industry expertise
and strong passion for renewables

                                Dr Dierk Paskert                                         Dr Christoph Husmann
                                Chief Executive Officer                                  Chief Financial Officer

                                CEO since Sep 2017                                       CFO since Oct 2014
                                Reappointed until Aug 2025                               Reappointed until Sep 2025

CEO Rohstoffallianz GmbH                                     Member (CFO) and later CEO of the Management Board of
Member of the Management Board of E.ON-Energie AG            HOCHTIEF Projekt Entwicklung GmbH
SVP Corporate Development of E.ON AG                         Head of Corporate Controlling and M&A of STINNES AG and HOCHTIEF AG
Member of the Management Board of Schenker AG                Controlling of VEBA AG

                                                                                                                        71
08 Appendix: The management
Supervisory Board
Dr Manfred Krüper (Chairman) Alexander Stuhlmann (Dep. Ch.) Albert Büll (dependent)
Member of the Board of Directors CEO at HSH Nordbank (until Dec 2006) Entrepreneur and co-owner of the B&L Group
at E.ON AG (until Nov 2006) and thereafter CEO at WestLB AG Advisory Council (a.o.):
(until April 2008) BRUSS Sealing Systems GmbH,
Supervisory Board (a.o.):
Power Plus Communication AG, Supervisory Board (a.o.): Euro-Aviation noventic GmbH
EQT Partners Beteiligungsberatung GmbH; Versicherungs-AG, Ernst Russ AG, GEV Gesell-
EEW Energy from Waste GmbH schaft für Entwicklung und Vermarktung AG,
M.M. Warburg & CO Hypothekenbank AG
Peter Heidecker (dependent) Dr Henning Kreke (dependent) Dr Cornelius Liedtke (dependent)
Chairman of the Supervisory Board at Previously CEO at Douglas Holding AG Entrepreneur and co-owner of the B&L Group
CHORUS Clean Energy AG (until Oct 2016) for 15 years
Supervisory Board (a.o.):
Founder of the CHORUS GmbH in 1998
Supervisory Board (a.o.): Deutsche BRUSS Sealing Systems GmbH,
EuroShop AG; Douglas GmbH, Thalia SUMTEQ GmbH
Supervisory Board (a.o.):
Bücher GmbH
Auszeit Hotel & Resort AG
Christine Scheel Dr Marcus Schenck Prof Fritz Vahrenholt
Member of the Supervisory Board at Partner of Perella Weinberg Partners Chairman of the Supervisory Board
CHORUS Clean Energy AG (until Oct 2016) (until January 2014) at RWE Innogy GmbH
Former Member of the German Parliament Independent Advisory Council(a.o.): (previously CEO)
EQT Infrastructure
Supervisory Board (a.o.): Supervisory Board (a.o.):
NATURSTROM AG Aurubis AG
72Appendix I. The management II. The Encavis Share
08    Appendix: The Encavis share

Dividend proposal to the AGM of EUR 0.28 per share
for FY 2020 fully in line with dividend target 2021                                     Nominal dividend to increase by 50%
                                                                                        (base-year 2016) to 30 EUR cent in 2021   0.30
                                                                                                                         0.28*
Significant majority (61.5%) of shareholders preferred new Encavis shares
to cash dividend for FY 2019                                                                                   0.26

Dividend policy reflects increasing cashflows from wind and solar parks                            0.24
over time to serve their corresponding financing obligations                            0.22
„Dividend strategy 2021“ of 50% increase of                                      0.20
nominal dividend until 2021 (compared to 2016)                            0.18
is based on the existing wind and solar park
portfolio as of March 31, 2017                                  0.15
Further acquisitions of wind
and solar parks will positively
contribute to the dividend                               0.10
potential of Encavis AG                           0.08

                                     0.05

                                     2011         2012   2013   2014      2015   2016   2017       2018       2019        2020    2021e
Dividend in EUR cent/share
*) Dividend proposal to the AGM on May 27, 2021
                                                                                                                                     74
08 Appendix: The Encavis share
Entrepreneurial shareholder structure –
strong and long-term anchor investors
Market Cap: # shares: 138,437,234
> 2.4 billion EUR (post scrip dividend of 2019)
Major investors within the free float:
Pool of
10.4% BlackRock Fund Managers Limited 26.7% AMCO Service GmbH with
therein: 5.4% iShares Trust
Dr Liedtke Vermögensverwaltung GmbH
6.5% The Goldman Sachs Group, Inc.
5.1% UBS Group AG
4.0% Versicherungskammer Bayern
3.5% Lobelia Beteiligungsgesellschaft/
Free float
Kreke Immobilien KG 73.3%
3.2% Invesco Capital Management LLC
3.1% DWS Investment GmbH, Frankfurt/Main
2.3% PELABA Vermögensverwaltungs GmbH & Co. KG
0.4% Management of Encavis AG
7508 Appendix: The Encavis share
Encavis share:
Twelve active coverages with ten „buy or hold“ recommendations out of eleven
Coverage institution Updated Ratings Date Target Price (EUR)
Reduce Mar 19, 2021 13.00
Neutral Mar 05, 2021 20.00
Buy Mar 01, 2021 23.00
Buy Feb 24, 2021 25.10
Neutral Jan 29, 2021 21.60
Hold Jan 28, 2021 21.80
Hold Jan 27, 2021 14.50
Buy Nov 17, 2020 18.60
Buy Nov 16, 2020 21.00
Hold Nov 16, 2020 13.50
Buy Aug 28, 2020 18.50
Consensus Further Ratings Date 19.15
Jan 24, 2020
7608 Appendix: The Encavis share
Encavis share with strong upward trend
recovered much better from the capital market panic
360
350 ENCAVIS DAX 30 SDAX OEKODAX
340
330
320
310
300
290
280
270
260
250
240
230
220
210
200
190
180
170
160
150
140
130
120
110
100
90
23.03.20 23.04.20 23.05.20 23.06.20 23.07.20 23.08.20 23.09.20 23.10.20 23.11.20 23.12.20 23.01.21 23.02.21 23.03.21
7708 Appendix: The Encavis share
Encavis AG – one of the largest independent and listed European Renewable IPPs
Benchmarking by market capitalisation as of 2021, March 23rd (EUR million)
3,374
European listed renewable companies
2,778 2,748
Listed yield companies
2,445
1,818 1,783
1,375
1,316
732
670
517
261
7808 Appendix: The Encavis share
Financial Calendar I
Date 2021 Event Date 2021 Event
Mar 22 Encavis (ECV) has been promoted to the May 5-6 Virtual PV Operations Europe 2021 / Digital
MDAX Index of Deutsche Börse AG Conference & Exhibition, London (UK)
Mar 23 Consolidated Financial Statements 2020 May 11 Stifel German SMID Cap 1-on-1 Forum,
Mar 24 Frankfurt/Main (GER)
Report on Sustainability at Encavis AG 2020
May 14 Interim Statement Q1/3M 2021
Mar 24 Analysts’ Conference Call regarding the
Consolidated Financial Statements 2020 May 19 Berenberg Virtual U.S. Conference 2021,
Mar 24 Bank of America Energy & Utilities Tarrytown NY (U.S.A.)
Virtual Conference 2021 May 20 Crédit Mutuel-CIC Conference 2021 –
Mar 26 Jefferies Equity-Linked Market Solutions by ESN, Paris (FR)
Virtual Conference 2021, London (UK) May 27 Annual General Shareholders Meeting,
Mar 30-31 Jefferies Virtual Pan-European Mid Cap Hamburg (GER)
Conference 2021, London (UK) Jun 8-9 Credit Suisse 2021 Global Energy
Virtual Conference (UK)
Apr 1 Stifel Virtual Road Show USA
Jun 9-10 Quirin Champions Conference 2021,
Apr 12-14 RBI/Raiffeisen CENTROBANK Institutional Frankfurt/Main (GER)
Investors Conference – VIRTUAL ZÜRS (AT)
Jun 10-11 M.M. Warburg Highlights Conference,
Apr 14 Warburg Meet the Future: Renewables Hamburg (GER)
Virtual Conference (GER)
Jun 21-22 Digital DIRK Conference 2021 (GER)
Apr 27-28 Crédit Mutuel-CIC Virtual Road Show (FR)
7908 Appendix: The Encavis share
Financial Calendar II
Date 2021 Event Date 2021 Event
Aug 13 Interim report Q2/6M 2021 Nov 15 Interim statement Q3/9M 2021
Aug 25 montega HIT Hamburger Investoren Tage, Nov 22-24 German Equity Capital Market Forum,
Hamburg (GER) Deutsche Börse, FFM (GER)
Sep 1 Commerzbank Sector Conference, Nov 30 Crédit Mutuel-CIC Renewable Conference –
Frankfurt/Main (GER) by ESN, London (UK)
Sep 1-2 Stifel Cross Sector Insight Conference Nov 30 DZ Bank Equity Conference, FFM (GER)
London (UK)
Dec 11 Interest payment PNL 2015
Sep 12 Interest payment PNL 2018 “Green SSD”
Sep 13 Interest payment Hybrid Convertible
Sep 22 Berenberg & Goldman Sachs 10. German
Corporate Conference, Munich (GER)
80Thank you.
IR / PR Contact
Jörg Peters
Head of Corporate Communications & IR
T +49 (0)40 / 37 85 62 242
M +49 (0)160 / 429 65 40
E joerg.peters@encavis.com
The information provided in this document has been derived from sources that we believe to be reliable. However, we cannot guarantee the accuracy or completeness of this information and we do
not assume any responsibility for it. Encavis AG assumes no liability for any errors or omissions or for any resulting financial losses. Investments in capital markets, in particular in stock markets and
futures markets, are fundamentally associated with risks and a complete loss of the invested capital cannot be ruled out. Recommendations provided herein do not represent an offer to buy or sell
and are not intended to replace comprehensive and thorough advice before making a decision to buy or sell. Copies of the content of this presentation, in particular prints and copies or publications
in electronic media, will only be authorized by written consent from Encavis AG.
Encavis AG| Große Elbstraße 59 | D – 22767 Hamburg | Germany | www.encavis.comYou can also read