Suntech 2021 Vol.2 - Suntech Power
←
→
Page content transcription
If your browser does not render page correctly, please read the page content below
Suntech 2021 Vol.2

STAND THE TEST OF TIME
       SUNLENS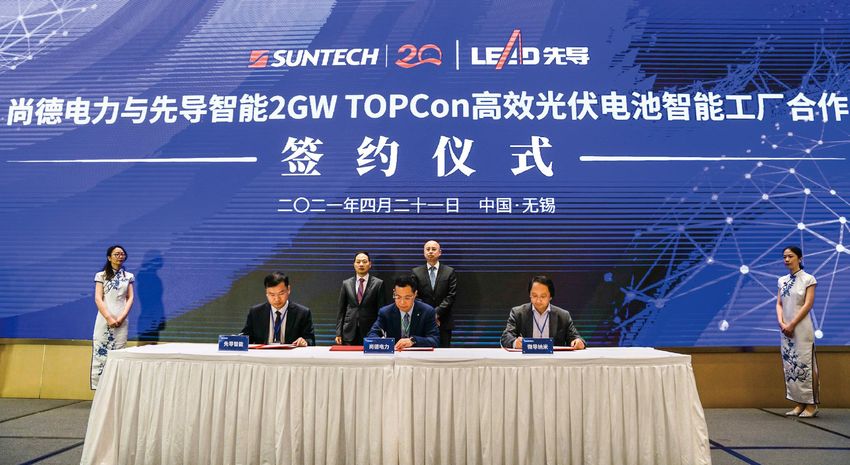
SUNLENS                                                                                                          PREFACE

          In this prime season of year, we are overwhelmed by vigor,
          dynamism and promise.
          Concentrating on “carbon neutrality”, China and the rest of the world stand in unity and pitch in to
          tackle global climate change and hereby make a solemn commitment on the matter. As an
          irreplaceable source of renewable energy, PV industry is granted with a new opportunity for mass
          application and booming. However, the industry may witness volatility as China is recovering from
          the COVID-19 pandemic against the backdrop of the anemic industry chain, pricing fluctuation
          attributable to supply and demand imbalance, and even clouds on the whole traditional
          manufacturing ecosystem caused by tension of international relations.

          Suntech has pulled through, regardless of turbulence of the times or radical movement to the
          industry. Staying true to our original intention with foresight, we have observed our 20th
          anniversary - a critical node in our evolution. On an honored footing, we start anew with
          concentration. Our journey is not all roses. But so long as we keep devoting ourselves to our
          cause, we will ultimately break through brambles and come to you with smile on a sunny day.

          For us, this season suggests exploration, vitality, progressiveness and breakthrough. Out of hope
          in human nature arises our dedication for light. Ecological environment, enterprise manufacturing,
          rhythm of life... and all the other objective factors that structure survival of individuals are
          delivering a message of change, favorable or unfavorable, to us. After the mist comes the
          sunshine. It is the light that drives us forward.

          In this opportune season, let's enjoy what is offered by nature and life with composure.
SUNLENS
INSIGHT
03
07
Global Action: Carbon Emission Reduction in Progress
Impacts of U.S.’ ban on goods from China’s Xinjiang
CATALOGUE
YEARS TOGETHER COLUMN
11 Do we really understand the failure mechanism of PERC cell?
INSIDE
Suntech
21 Suntech Ranked In the “Global Top 20 Companies On PV 2021”
23 Suntech Moistened The Driest Land
25 2 GW of Digital Intelligent Production Line for TOPCon High
2021 Vol.2
Efficiency Batteries
27 Suntech, Lead Intelligent and Leadmicro Forge a 2 GW
Digitized Smart Factory for High-Efficiency TOPCon Cells
31 Improving Grid Integration of Renewable Energies
35 20 Years: Embarking on A New Journey,
Our Love and Care Remains the Same
39 Nanwai King's College School Visit to Suntech for Extracurricular
Practical Activities
COVER STORY
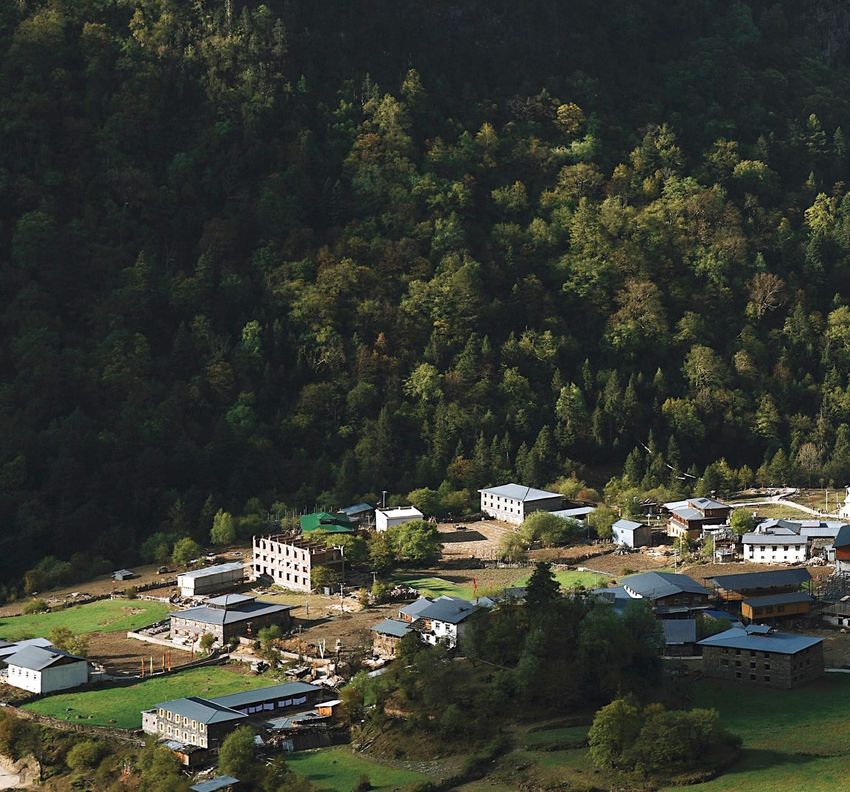
43 Ride into the Sunset and Take a Pilgrimage to Meili Mountain
47 Travelogue: Popular Trekking Routes in China
51 Outdoor Rules for Urbanite: Beyond Mountain Gear, Brand Attitude Focused
EXPLORATION
63 Escalating The Outdoor Lifestyle: PV Systems for
Caravan Power Independence
67 Diversified PV Applications
Marketing@suntech-power.com
VOICE
69 Suntech Officially Launches Online Shopping Mall Suntech Marketing
Scan code and follow Wechat public number.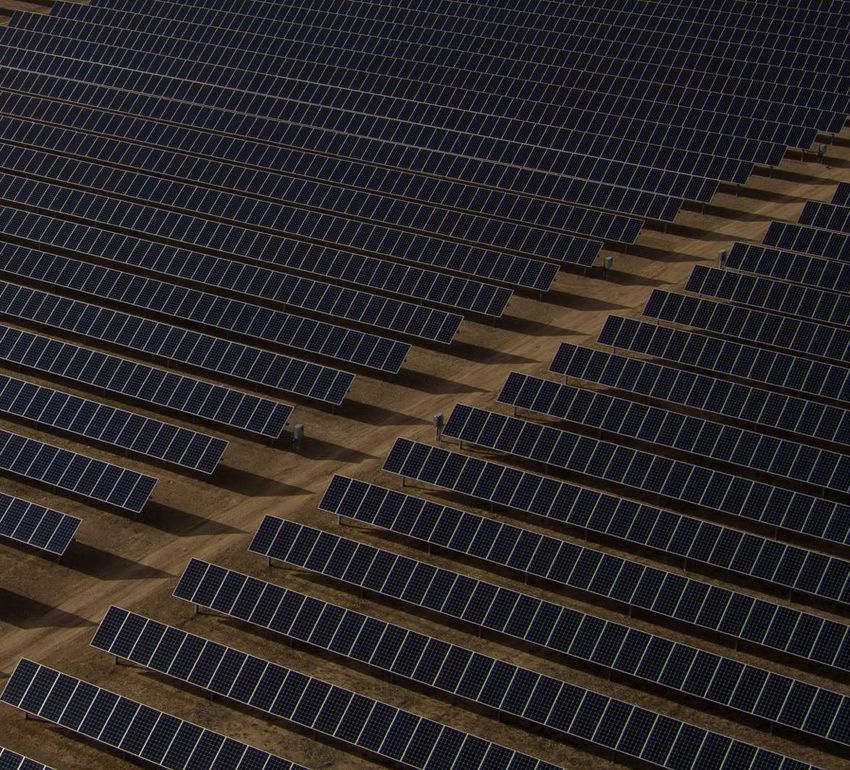
SUNLENS        INSIGHT

     INSIGHT

01                  02
SUNLENS                                                                                                                                                                                                                                                                                       INSIGHT

                                                                                                                                                                                                           China: Entering into the Critical Period of
                                                                                                                                                                                                           "Peaking Carbon Dioxide Emissions"

                                                                                                                                                                                                           China has put forward the goal of "having Carbon emissions peak before 2030 and
                                                                                                                                                                                                           achieving carbon neutrality before 2060" and plans to reduce carbon dioxide emissions per
                                                                                                                                                                                                           unit of GDP by more than 65% by 2030 compared with 2005, and increase non-fossil
                                                                                                                                                                                                           energy consumption to about 25%. To this end, China has implemented the new energy
                                                                                                                                                                                                           security strategy of "four revolutions and one cooperation" (consumption revolution, supply
                                                                                                                                                                                                           revolution, technological revolution, institutional revolution and international cooperation) by
                                                                                                                                                                                                           giving priority to the development of non-fossil energy, making clean use of fossil energy,
                                                                                                                                                                                                           and promoting the pilots of energy use rights and carbon emission permit trading.

     Global Action: Carbon

                                                                                                                                       EASTERN
     Emission Reduction
     in Progress
     1.From "Carbon Emission Reduction" to "Carbon Neutrality": Global Efforts

                                                                                                                                       HEMISPHERE
     in Tackling Climate Warming.
     In 2019, the global average temperature is about 1.1 ℃ higher than pre-industrial era. In order to jointly addressing global
                                                                                                                                        Japan: Promoting Zero Carbon Transformation Through
     warming, the Paris Agreement was signed with the main objectives of keeping the global average temperature rise within
                                                                                                                                        Green Investment and Technological Innovation
     2 ℃, and within 1.5 ℃ if possible compared with the pre-industrial era. Many countries have put forward the objectives of          Japan peaked carbon dioxide emissions in 2008. In order to achieve the goal of carbon
     greenhouse gas emission reduction and neutrality. The European Union, the United States and Japan and other most                   neutrality by 2050, Japan has proposed five policy measures in terms of fiscal budget,
                                                                                                                                        taxation, finance, regulations and standardization, and international cooperation in 14 key
     developed countries proposed to achieve the goal of neutrality by 2050. On September 22, 2020, at the General Debate of            areas, including offshore wind energy, hydrogen energy, and electric vehicles. Through
     the 75th Session of the United Nations General Assembly, Chinese President Xi Jinping proposed that "We aim to have CO2            technological innovation and green investment, Japan is to ensure the smooth realization of
                                                                                                                                        low-carbon transformation.
     emissions peak before 2030 and achieve carbon neutrality before 2060." During the 14th Five-Year Plan period, China will
     step into a critical period of peaking carbon dioxide emissions. " Peaking carbon dioxide emissions and carbon neutrality" will
     have a series of effects on the medium and long-term development of China's chemical industry.

03                                                                                                                                                                                                                                                                                                            04
SUNLENS INSIGHT
2.Implementation Guideline on Carbon Neutral for Enterprises
The US: The Biden Administration Boosting the Process of "Carbon Neutrality" Enterprises are the mainstay on the road to carbon neutrality. The government has issued relevant policies to explicitly encourage
enterprises to implement carbon neutrality, and introduced supporting relevant incentive measures to mobilize the enthusiasm and
The US peaked carbon dioxide emissions in 2007. The ruling party has a great influence on the carbon emission reduction policy.
The Democratic Party pays more attention to the international emission reduction commitment. The US re-joined the Paris initiative of enterprises to implement carbon neutrality, so that enterprises will play a greater role in the process of national carbon
Agreement after Biden took office, and promised to achieve "carbon neutrality" by 2050. In addition to federal policies, local neutrality.
governments and non-governmental organizations also actively responded to greenhouse gas emission reduction by signing
agreements and trading carbon emission permits.
Defining Scope Boundaries Putting forward Carbon Targets and
The carbon emissions of enterprises can be divided into
Implementing Emissions Reduction
three types: direct emissions, indirect emissions of Even if enterprises can achieve carbon neutrality by
purchased electricity and heat, and other indirect emissions. purchasing environmental rights and interests, their own
Enterprises with carbon management experience usually emission reduction is also a very important part, which is
bring the three ways into the scope of management. In also the part that all enterprises must implement according
addition, there is a special boundary which is based on the to the relevant standards of carbon neutrality. Therefore, in
whole life cycle of the product, that is, the carbon footprint of the process of achieving carbon neutrality, enterprises must
the product, which involves the carbon emissions generated put forward and achieve certain emission reduction targets,
in the whole process of manufacturing all parts of the and need to regularly check and update emission reduction
product, from raw material mining to scrap disposal. targets. In order to achieve the overall goal of carbon
Therefore, when setting carbon neutral goals, enterprises neutrality, enterprises usually need the support of other
should first determine the boundary of carbon neutral scope, sub-indicators, such as the proportion of energy efficiency
or the carbon emissions of supply chain and products. improvement, the use ratio of new energy and so on.
At present, most of the qualitative descriptions are used for
Accounting Carbon Emission what kind of emission reduction target can be regarded as
meeting the standard of carbon neutrality. For example, the
Generally speaking, carbon emission accounting can be
advanced value of industrial comprehensive energy
divided into two calculation methods: organization level and
consumption index released by the government is used as
product level. As for the calculation of grid emission factors,
the basis to judge the achievement of the emission reduction
the concept of location based power grid emission and
target of an enterprise, but there are still differences among
market based power grid emission are introduced for the first
different industries and sectors.
time in GHG Protocol Scope 2 Guidance on calculating
carbon emissions from electricity use issued by the World
Resources Institute (WRI) in 2014. When calculating the Carbon Offsetting
emission location based power grid, the power consumption Carbon offsetting is the purchase of environmental rights to
WESTERN
emission of enterprises is calculated according to the offset the remaining part of emissions. Afforestation and
average emission factor of the whole power grid. In the environmental rights and interests based on natural
calculation of market-based power grid emissions, the solutions are most sought after by the market, followed by
electricity emission factors provided by electricity dealers are wind power, photovoltaic and other new energy projects. In
used to calculate. If the electricity provided by electricity the future, with the blowout of wind power and photovoltaic
dealers for enterprises is clean electricity, and the ownership projects, their related environmental rights and interests may
of its clean property can be proved, the electricity emission also gradually heat up.
of enterprises can be considered as zero. As an important
The contribution of environmental rights and interests of any
breakthrough, the concept offers a theoretical basis for
type of project in any year to the reduction of global
enterprises to purchase clean power to reduce their own
greenhouse gas emissions is not significantly different. The
electricity emission. Thus, purchasing clean power has also
HEMISPHERE
subtle difference may lie in other added-value aspects of the
been widely used in the carbon neutral implementation plan
project itself. From the perspective of standards, how to
of enterprises.
reasonably choose the environmental rights and interests
EU: Proactive Commitment to Emission Reduction with Remarkable Effects that meet the requirements of carbon neutrality, so that
EU peaked carbon dioxide emissions in 1979, and plans to achieve "climate neutrality" by 2050. EU has also actively carbon neutrality can win more support will be very important
adopted a variety of approaches, including implementing corresponding measures in various fields (developing clean
criteria to judge the stand or fall of the standard.
energy, electric vehicles, reduction of industrial emissions, etc.), determining "climate neutrality" targets by legislation,
and effectively reducing emissions through the carbon emission trading system, etc.
External Communication
External action is an indispensable part of the whole carbon scope, carbon accounting rules, the realization of carbon
neutrality. Enterprises need to make some normative targets, offset scheme, etc., as well as the disclosure frequency
requirements to implement external influence, such as the and disclosure methods of relevant information.
content of external disclosure, including the carbon neutral
05 06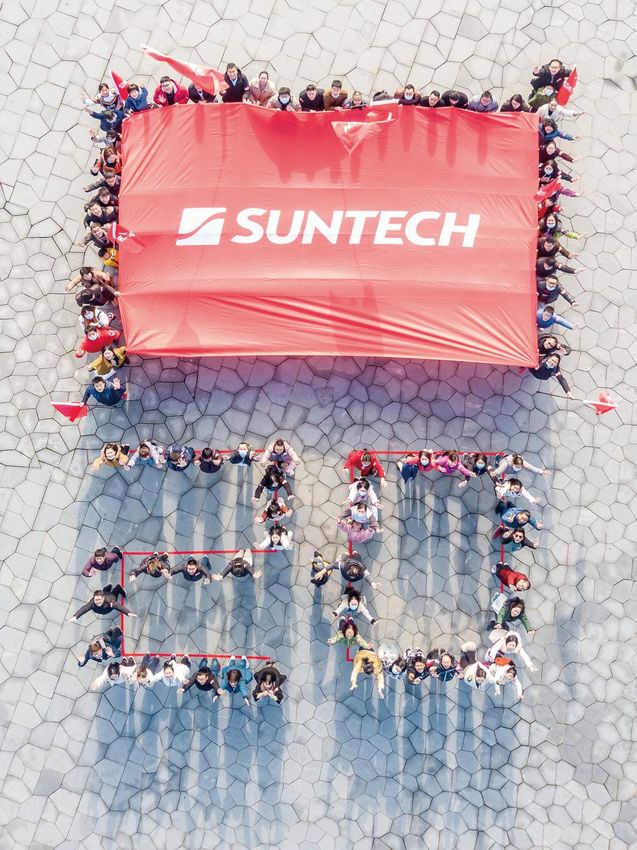
SUNLENS INSIGHT
Timeline of U.s. laws regarding the Non-Xinjiang polysilicon capacity V.S. demand
importation of goods from from countries that may ban imports
Xinjiang (2020) from Xinjiang (2021-2022),Unit: GW
6.17 9.22 12.10 Xinjiang-made polysilicon production
2020
Non-Xinjiang-made polysilicon production
Module demand of the U.S.
President Trump US Congress SEIA released Module demand of the U.S. and the Europe
signed law on passed bill press making
sanctions over authorizing response to the Module demand of the U.S. and the Europe, Canada, Mexico, New Zeland, and Australia
Xinjiang forced sanctions against labor issue in
labor labor issue in Xinjiang
Xinjiang
3.12 2.9
2021
Richard Trumka,President of AFL-CIO,the largest Abigail Ross Hopper, the President of the
labor union in the U.S., wrote to Secretary of SEIA, express opinions on Xinjiang's
State and National Security Advisor, pleading to labor issues and solar Pv industry during
ban polysilicon and relevant products from an interview.
Xinjiang associated with the issue.
3.22 3.23 3.30
The EU, the U.K., the U.s.,and American Senator Marco Rubio Eight republican Senator *The calculation is based on the conversion of 1 GW to 2,900 MT of polysilicon.
Canada imposed sanctions against (R),Jeff Merkley (D) wrote to introduced “The Keep China Out
four Chinese officials and oneentity Abigail Ross Hopper,the of Solar Energy Act"
in joint action. president of SEIA,requesting for
explanations in terms of Xinjiang Xinjiang accounts for 45% of global polysilicon production. The U.S. and
solar PV industry.
Europe respectively represents 14-15% and 17-19% of polysilicon demand,
while the U.S., Europe, Canada, Mexico, Australia and New Zealand together
occupy 36% of demand. This means that polysilicon sourced from regions
Overview of Production Capacity in Xinjiang outside of Xinjiang is sufficient even in the worst case scenario.
However, as wafer, cell, and module segment each has more than 100 GW of
Xinjiang is a major producer of polysilicon. PV InfoLink made
capacity expansion this year, the market saw panic buying and hoarding even in
forecast for the worst case scenario for the PV supply chain in
the low season. Although polysilicon from non-Xinjiang region is enough to
Xinjiang. meet demand from the U.S. as well as countries that may introduce sanctions
against goods from Xinjiang and wafer manufacturers have sourced polysilicon
Polysilicon: The total polysilicon capacity worldwide is from other regions for some facilities since the end of last year, it’s expected
estimated to sit at 710,000 MT by the end of 2021, while China that demand for polysilicon in non-Xinjiang regions will be strong if the
Impacts of U.S.’ ban on goods
alone will see 613,000 MT. Xinjiang, with around 297,000 MT, sanctions take effect. A price gap between polysilicon from Xinjiang and
non-Xinjiang region will emerge as a result.
accounts for 48% of total capacity in China and 42% globally.
Since the end of last year, vertically integrated companies, US companies, and
Polysilicon manufacturers based in Xinjiang include Daqo New
manufacturers that supply modules to the U.S. market have started to negotiate
from China’s Xinjiang
Energy, TBEA, East Hope and GCL Silicon. supply deals of wafers made of polysilicon from regions out of Xinjiang, in case
of some countries ban imports of modules related to forced labor. Moreover,
Wafer: Jinko has 8 GW of mono ingot capacity in Xinjiang wafer and vertically integrated companies now source polysilicon from
non-Xinjiang regions to avoid the complicated procedure of tracing the country
Cell, module: Only a few hundred MW older production lines of origin when exporting modules to the U.S.
PVInfoLink are located in Xinjiang, which are currently suspended.
Given modules exporting to the U.S. and Europe may use polysilicon from
non-Xinjiang regions in the future, Chinese polysilicon manufactures opt to set
up new production lines in provinces outside of Xinjiang, such as Sichuan, Inner
Mongolia, and Yunnan. Tongwei’s unit of Yongxiang will bring new capacity
Current status online in Sichuan and Yunnan by the end of the year, while TBEA has capacity
expansion plan for its Baotou-based facility next year. Against this backdrop,
Background The U.S. Customs and Border Protection (CBP) has not barred
Chinese polysilicon in non-Xinjiang regions is forecast to grow by more than
imports of solar products made with materials sourced from 50%. Once the polysilicon shortage eases in mid to late 2022, polysilicon in
The U.S. House of Representatives has approved legislation sourced from Xinjiang are not made with forced labor. Xinjiang, but if the sanctions on goods from Xinjiang are Xinjiang will see serious surplus.
that would ban imports of certain goods from China’s Xinjiang Recently, Senate Republicans even introduced legislation implemented in May, the U.S. may begin to bar modules made From a quarterly supply perspective, polysilicon in non-Xinjiang regions may be
region last September. Earlier in January, the Trump calling for a ban on all China-made solar products. of polysilicon from Xinjiang between September and October, sufficient to supply countries that may ban goods from Xinjiang even in the third
quarter of 2022, when the high season falls. Having said that, wafer
administration announced a ban on imports of all cotton and taking into account the 90-120 days of grace period. Under the
The bills will be sent to the President if they are passed by the manufacturers may hoard polysilicon again due to significantly higher volume of
tomatoes from Xinjiang, which accounts 20% of world cotton scenario that no grace period is given, exports of modules to capacity than polysilicon.
Congress. Given the recent trade tension, the solar industry
supply. Xinjiang is also a major producer of fossil fuel and the U.S. during May to June might be disrupted.
believes that the sanctions on solar products from Xinjiang will
industrial materials such as polysilicon, an important material
take effect soon. In anticipation of the import ban, PV Given the current international situation, it’s likely that Europe
for manufacturing solar panels. Polysilicon capacity in Xinjiang
manufacturers in China have taken actions in response, will follow suit. Other countries such as Canada and Mexico
and non-Xinjiang regions (2021-2022)
The U.S. recently began investigation on solar products made including establishing a mechanism that traces the country of have signed agreements on labor rights with the U.S., while
in Xinjiang. This March, Republican and Democrat senators origin for raw materials, source polysilicon from non-Xinjiang Australia and New Zealand raised concerns about the Xinjiang 2021 2022 YoY
sent a letter asking the Solar Energy Industries Association regions for some facilities, and select provinces outside of issue. In light of this, PV InfoLink calculates the estimates for Polysilicon capacity in Xinjiang 102 121 18.5%
(SEIA) for information on “the extent to which the U.S. solar Xinjiang for capacity expansion. US demand as well as supply and demand of non-Xinjiang Non-Xinjiang polysilicon capacity in China 109 166 52.2%
supply chain is currently dependent” on the Chinese PV supply polysilicon under three scenarios: the U.S. plus Europe, Polysilicon capacity outside of China 33 35 5.2%
chain and measures it has taken to ensure that solar products Canada, Mexico, Australia, and New Zealand.
07 08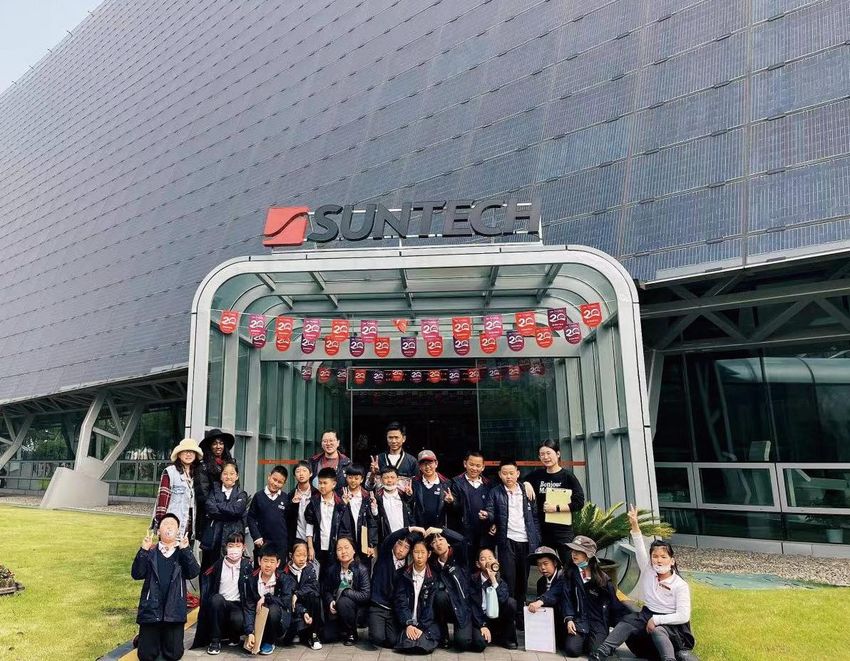
SUNLENS       COLUMN

09
     COLUMN       10
SUNLENS COLUMN
Do we really 1.Introduction
understand the failure mechanism
Passivated emitter and rear cell (PERC) modules, due to its higher efficiency than In this work, not only results of PID test on bifacial PERC cell module fabricated
Aluminum Back Surface Field (Al-BSF) cell modules, has attracted more and more using glass, transparent backsheet, and white backsheet as backboard are shown,
attention in the industry and become a more promising candidate to reduce the LOCE. results of DH and PID test on monofacial PERC cell module are also presented. We
Furthermore, bifacial PERC modules fabricated by using glass-glass or glass-white focus on the recovery behavior and how to reduce the degradation. Recovery test is
of PERC cell?
backsheet, which can achieve higher power gain than monofacial PERC cell modules in conducted by conditioning modules in a dry heat climate chamber at 75℃ and
the field, has gained more market shares. However, in the pathway of PERC cell injecting forward Isc current, which mimics the conditions of light induced
technology development, the reliability problem recently has caught considerable degradation (LeTID) regeneration. We found that the power degradation of bifacial
attentions from researchers, manufacturers, and investors. It has been found that the cell module can be restored after recovery test. The degradation of monofacial
rear side of a bifacial glass-glass module is more sensitive to potential induced PERC cell module after DH and PID test has also been shown to be partially
degradation (PID) than the front side, since the rear side of a PERC cell is not equipped recovered by injecting forward Isc current. Bifacial PERC cell module fabricated by
with a full-area rear-side metallization[1, 2]. The degradation on the rear side of a bifacial using glass-glass layout is more sensitive to PID than the one with glass-transparent
cell module has been shown to be fully or partially recovered under illumination [1-3]. backseet layout. In addition, PID failure can occur on bifacial glass-glass PERC
According to the researches of Kai Sporleder et al., the electrochemical formation of module under either negative or positive bias voltage. The PID degradation of a
SiO2 and the interfacial Na, K, and Ca contaminations under cathodic conditions seems bifacial PERC cells module with glass-white backsheet layout can be reduced by
to play a major role in the degradation mechanism of rear side [1]. However, for module using white EVA as an encapsulation material on rear side instead of transparent
with PERC technology, except for the PID failure of bifacial PERC cells, other failure EVA.
phenomena such as continuous degradation in the dark at room temperature of bifacial
PERC cell module, large degradation after Damp-heat (DH) and PID test of monofacial
PERC cell module have not been explored yet.
2.Experimental 2.2 Bifacial glass-glass / glass-transparent
backsheet module test
2.1 Monofacial PERC cell module test We used commercial bifacial PERC solar cells made from boron doped
monocrystalline silicon wafers from two different manufacturers, abbreviated as cell
We used commercial monofacial PERC solar cells from four different manufacturers,
type E and F.
abbreviated as cell type A, B, C, and D. Type A and Type B was made from boron
Haidan Gong1, Minge Gao2, Yiwei Guo2, Xiaogang Zhu3, Jiayan Lu3, Shan Yanyan3, Yi Liu3
doped monocrystalline silicon wafers. Type C and Type D was made from gallium In Tab.2 it shows the received test items of all modules. Degradation due to PID test
1,2
Wuxi Suntech Power Co., Ltd.
doped monocrystalline silicon wafers. All the modules were fabricated by using and recovery behavior afterwards was investigated on module 7-16. The PID test
glass-white backsheet and transparent EVA as encapsulation material. was performed by using a high voltage of -1000 V applied to the frame at a module
3
National Center of Supervision & Inspection on Solar Photovoltaic Products Quality
temperature of 85℃ and relative humidity of 85 % for 96 hours. For the recovery test,
Wuxi, Jiangsu, China In Tab.1 it shows the received test items of all modules. In the first part of the
two methods were used. In Method A, stressed modules were stored in the dark at
experiments, degradation due to PID test and recovery behavior afterwards was
room temperature for a period of 536 days and subsequently injected forward Isc
investigated on Module 1 to 4. The PID test was performed by using a high voltage
current at 75℃ till the power was stabilized. In Method B, stressed modules were
of -1000 V applied to the frame at a module temperature of 85℃ and relative
stored in the dark at room temperature for a period of 6 days and then illuminated in
humidity of 85%. For the recovery test, stressed modules were injected forward Isc
the field for 530 days.
current for 48 hours at 75℃. For cell Type D, module 4 was stressed by PID test
followed by PID recovery (a high voltage of +1000 V applied to the frame at a
Abstract: Passivated emitter and rear cell (PERC), due to its forward Isc current. This result indicates that such failure module temperature of 85℃ and relative humidity of 85% for 96hrs, and its recovery Tab.2. test items of all modules
behavior was investigated afterwards.
higher efficiency than Aluminum Back Surface Field (Al-BSF) does not occur outdoor because the conditions of high heat
cell, has attracted more and more attention in the industry and no current do not appear in the field. Therefore, In the second part of the experiments, degradation due to high temperature and high Module Cell Fabrication Encapsulation Stressed Dark Forward Isc Current Light
No.# type material storage injected
and gained more market shares. However, this cell deviations of standard IEC conditions from real field humidity and recovery behavior afterwards was investigated on Module 5 and Module E Glass-glass POE -1500 V 536days 4 cycles (each cycle --
Module 6.
technology brings new challenges in the degradation conditions might lead to wrong conclusions on the lab testing 7 48 hrs)
Module E Glass-glass POE +1500 V 536days 4 cycles(each cycle --
phenomenon: we found that some monofacial/bifacial PERC results. 8 48 hrs)
Module E Glass-glass POE -1500 V 6days -- 530 days
cell modules showed much higher power degradation than 9
Al-BSF cell modules after DH (85 °C & 85% R.H., 1000 hrs.) Module E Glass-glass POE +1500 V 6days -- 530 days
10
and PID (85 °C & 85% R.H., -1500V, 96 hrs.) tests, which will Keywords: monofacial PERC cell, bifacial PERC cell, Tab.1. test items of all modules
Module F Glass-glass POE -1500 V 536 days 1 cycle --
be focused in this paper. We also found that the power PID, recovery. Module Cell Encapsulati Stressed PID Forward Isc Current DH High
11
Module F Glass-glass POE +1500 V 536 days 1 cycle --
degradation of PERC cell modules after DH and PID tests is No.# type on material recovery injected temperat
12
ure
Module E Glass-transparent POE -1500 V -- -- --
mainly caused by decrease of short-circuit current. For Module 1 A EVA -1000 V -- 1cycle (48 hrs) -- --
13 BS
bifacial glass-glass module, PID failure can occur under Module 2 B EVA -1000 V -- 1cycle (48 hrs) -- -- Module E Glass-transparent POE -1500 V -- -- --
Module 3 C EVA -1000 V -- 1cycle (48 hrs) -- -- 14 BS
either negative or positive bias voltage, the power Module 4 D EVA -1000 V 96 hrs 1cycle (48 hrs) -- -- Module E Glass-glass POE -1500 V -- -- --
degradation can be recovered after conditioning modules in a Module 5 D EVA -- -- 1cycle (48 hrs, after DH 1000 hr -- 15
test) s Module E Glass-glass POE -1500 V -- -- --
dry heat climate chamber at 75℃ for 48 hours and injecting Module 6 D EVA -- -- -- -- 200 hrs 16
11 12SUNLENS COLUMN
2.3 Bifacial glass-white backsheet module test Tab.3. test items of all modules
3.1.2 Characterization of monofacial PERC cell module degradation
Module Cell type Encapsulation material Stressed Forward Isc Current and recovery behavior after DH test
EDS
Glass-white backsheet module with cell type E and F was fabricated with white EVA No.# injected
and transparent EVA as encapsulation material on rear side, respectively. Module 17 E Front side: transparent -1000 V -- Y DH (85℃&85% R.H., 1000hrs) and high temperature test (105℃,200hrs) were
EVA
conducted on two modules using cell type D and same encapsulation materials
Rear side: white EVA
In Tab.3 it showss the received test items of all modules. In the first part of the which underwent current recovery test afterwards. In Tab.1, the results show that the
Module 18 E Front side: transparent -1000 V -- Y
experiments, degradation due to PID test and recovery behavior afterwards was EVA tested modules are sensitive to high temperature and this degradation can be
investigated on module 17-20. The PID test was performed by using a high voltage Rear side: transparent
recovered after current recovery test. The Pmpp and Isc of Module 5 shows recovery
EVA
of -1500 V applied to the frame at a module temperature of 85℃ and relative partially by injecting forward Isc current, Voc shows an almost full recovery. EL test
Module 19 F Front side: transparent -1000 V 2 cycle (96 hrs) --
humidity of 85%. For the recovery test, stressed modules were injected forward Isc EVA was carried out in each test stage, see Fig.3. The change of EL images are
current for 96 hours at 75℃. In the second part of the experiments, Rear side: white EVA
corresponding to the change of electrical characterization. Hence, we think that the
energy-dispersive spectroscopy (EDS) (ZEISS X-MaxN20 (51-XMX1121)) was Module 20 F Front side: transparent -1000 V -- --
EVA
LeTID may also play a role during high temperature and high humidity test.
employed to investigate the elemental changes of white EVA and transparent EVA
Rear side: transparent
before and after PID test. EVA
Module 2: Cell Type B (Left: initial; Middle: PID test; Right: current recovery)
Tab.4. Electrical characterization of degradation and recovery behavior
Sample No.# State Voc Isc Pmpp Voc loss% Isc loss% Pmpp loss%
DH test 49.26 9.76 382.75 -0.5% -4.6% -5.4%
Module 5
Forward current injected 49.44 9.88 390.51 -0.1% -3.4% -3.5%
Initial 49.03 10.08 395.19
Module 6
High temperature test 48.28 9.89 375.76 -1.5% -1.8% -4.9%
Module 3: Cell Type C (Left: initial; Middle: PID test; Right: current recovery)
3.Results
3.1 Characterization of monofacial PERC cell module
degradation and recovery behavior
after DH and PID tests
Module 5: (Left: initial; Middle: DH test; Right: current injected)
3.1.1 Characterization of monofacial PERC cell module degradation
and recovery behavior after PID test
In Fig.1 it shows that all tested modules are prone to PID. The power loss of module 1, 2,
3 and 4 is -5.5%, -6.9%, -7.7% and -5.3% , respectively, where the Isc and Voc loss of
the same testing group is -1.4%, -1.4%, -1.8%, -1.0% and -0.8%, -0.7%, -1.0% -0.5%,
respectively. It is clear that Isc loss is the dominating loss factor here, which is different
from the well-known shunting type PID (PID-s) of Al-BSF solar cell module where Voc Fig. 1. Relative losses in short current Isc, open circuit Voc, and maximum
loss is the dominating loss factor. Following the PID test, Module 1, 2 and 3 received the power output Pmpp of the modules under tests.
recovery test by injecting forward Isc current. The results show that Pmpp and Isc of all
modules recovers partially, whereas Voc shows an almost fully recovery. For Module 4,
PID recovery test was applied after PID test and the current recovery behavior
afterwards was studied. The rel. power loss recovers from -5.3% after PID test to -4.9%
after PID recovery. In contrary to recovery behavior of power, Isc and Voc shows
continuous loss. However, the rel. power loss recovers significantly from -4.9% after PID
recovery to -3.2% after forward Isc current injection and Isc also recovers partially, Module 6: (Left: initial; Right: high temperature test)
whereas Voc shows an almost fully recovery. Fig.3. EL images of the modules under tests (Module 5 and Module 6)
Electroluminescence (EL) test was carried out in each test stage, see Fig.2. In the
stressed state, dark cells can be observed, and the dark cells in Module 1, 2 and 3 can
be recovered by injecting forward Isc current. For Module 4, more dark cells can be
observed after PID recovery, although they can also be recovered by injecting forward Module 4: Cell Type D (Left: initial; Middle left: PID test; Middle right:
Isc current. The change of EL images are corresponding to the change of electrical PID recovery; Right: current recovery)
characterization. Hence, we think that the LeTID may play a role during PID test. Module 1: Cell Type A (Left: initial; Middle: stressed; Right: current injected) Fig. 2. EL images of the modules under tests (Module 1, 2 3 and 4)
13 14SUNLENS COLUMN
The recovery test by injecting forward Isc current after PID test was conducted on
Fig.4. Relative losses in short current Isc, open circuit Voc, and maximum power Module 20 and followed by PID recovery test. It can be found that the module
3.2 Characterization of bifacial glass-glass / output Pmpp of the modules using cell type E under tests. Module 7 and Module 9: recovers partially after injecting forward Isc current, the rel. Pmpp loss reduces from
glass-transparent backsheet modules degradation negative 1500V voltage was applied during stress test; Module 8 and Module 10:
-7.57% after PID test to -1.66% after forward Isc current injection. However, the
and recovery behavior positive 1500V voltage was applied during stress test.
module shows further power loss after PID recovery test, the rel. Pmpp loss
increases from -1.66% after forward Isc current injection to -2.83% after PID
The rear side of modules using cell type E (Module 7, 8, 9, and 10) are found to be
recovery test.
more sensitive to PID than the front side. This failure can be observed under either
negative or positive voltage, see Fig.4. The rel. Pmpp loss is mainly caused by the
loss of Isc. After the PID test, modules were stored in the dark at room temperature.
The further loss can be observed on front side and rear side of all tested modules. Fig.6. Relative losses in short current Isc, open circuit Voc, and maximum
Subsequently, Module 7 and Module 8 exhibits a recovery behavior after forward Isc power output Pmpp of the modules using cell type F under tests. Module 11:
negative 1500V voltage was applied during stress test; Module 12: positive
current injection, Module 9 and Module 10 shows illumination recovery behavior
1500V voltage was applied during stress test.
(illuminated on rear side). The Pmpp and Isc of these modules only recovers
partially, whereas Voc shows an almost fully recovery after applying two different
recovery methods. Furthermore, the recovery behavior by illumination on rear side is
The same failure phenomenon is obtained for the bifacial modules from different
more pronounced compared to that of forward Isc current injection. In Fig.5 it shows
manufacturers: the rear side is more sensitive to PID compared to the front side.
the EL images of Module 10 under each test stage. The change of EL images are
However, it is found that the loss on rear side can be reduced when using transparent
corresponding to the change of electrical characterization.
backsheet instead of glass, probably due to the fact that backsheet has higher
(Module 10 Front side; Left: initial; Middle: PID test; Right: light) insulation resistance than that of glass (see Fig.7 and Fig.8).
Fig.10. Relative losses in maximum power output
Pmpp of Module 20 under forward Isc current
injection recovery test and PID recovery test.
Energy-dispersive spectroscopy (EDS) was carried out on Module 17 and Module 18
to analyze the difference between white EVA and transparent EVA after 288hrs
stress test. The result shows that Na, K and Cl can be found in white EVA after PID
test compared to the initial state, see Fig.11. No any change in transparent EVA can
Fig.7. Relative losses in maximum Fig.8. Insulation resistance of glass
power output Pmpp for modules using and backsheet at different be observed before and after PID test. We believe that the TiO2 in white EVA can
transparent Backsheet and glass as temperature. influence the movement of Na, K which comes from the cell.
backboard.
3.3 Characterization of bifacial glass-white Backsheet
modules degradation and recovery behavior (a) Initial-transparent EVA
(Module 10 Rear ide; Left: initial; Middle: PID test; Right: light)
Bifacial PERC cell module with Glass- white backsheet layout can achieve higher
Fig.5. EL images of Module 10 under tests power gains than monofacial PERC cell module, therefore, it is normally considered
to be an alternative choice for the high power module. Nevertheless, the PID
phenomenon on rear side still influences the power output of the module, although
the power on rear side cannot be measured due to the use of white backsheet.
However, it is found that the PID phenomenon on rear side can be reduced when
using white EVA instead of transparent EVA as rear side’s encapsulation material,
see Fig.8. The difference between white EVA and transparent EVA is titanium dioxide
(TiO2), which can enhance the reflection of light on white EVA and therefore increase
However, for the modules using cell type F, a full recovery can be observed after forward the power output.
Isc current injection, see Fig.6.
(b) After PID test-transparent EVA
Fig.9 Relative losses in maximum power output Pmpp of module using
transparent EVA and white EVA as encapsulation material (Left: modules using
cell type E; Right: module using cell type F).
15 16SUNLENS COLUMN
For bifacial PERC cell modules fabricated using Glass-white
(b) After PID test-transparent EVA backsheet, the PID failure on rear side can be reduced when
using white EVA instead of transparent EVA as encapsulation
material. EDS analysis showed that Na and K can be found in
white EVA after PID test compared to the initial state.
The failure of PERC cells under PID and DH test can be
recovered by applying the LeTID regeneration method where
injecting forward Isc current at 75℃. Hence, we believe that LeTID
may play a key role during PID and high temperature tests.
(d) After PID test-white EVA
Fig.11 EDS characterization of white EVA and transparent EVA. (a) EDS of
transparent EVA in initial state. (b) EDS of transparent EVA after PID test. (c)
EDS of white EVA in initial state. (d) EDS of white EVA after PID test.
4.Conclusions
References
Modules using monofacial PERC cells from four different
manufacturers (cell type A, B, C and D) were found to be prone to [1] Kai Sporleder, et al., Root cause analysis on corrosive poten-
PID. For modules using cell type D, high power loss can also be tial-induce degradation effects at the rear side of bifacial silicon
observed after DH and high temperature test. Relative Pmpp loss PERC solar cells, Solar Energy Materials and Solar Cells 201
of all tested modules recovered partially by injecting forward Isc
(2019) 110062.
current at 75℃.
[2] Wei Luo, et al., Elucidating potential-induced degradation in
For bifacial glass-glass module, PID failure can occur under either
bifacial PERC silicon photovoltaic modules, Prog. Photovolt. Res.
negative or positive voltage. The modules using either cell type E
Appl. 26(10) (2018) 859-867.
or cell type F were both found to be prone to PID on the rear side,
which is in good agreement with the findings in literatures [1-3]. [3] Wei Luo, et al., Investigation of the impact of illumination on the
Relative Pmpp loss can be recovered by injecting forward Isc Polarization-type potential-induced degradation of crystalline
current at 75℃ or under illumination. Different recovery behaviors silicon photovoltaic modules, IEEE J. Photovolt. 8 (5) (2018)
were observed on cells from different manufactures. Relative 1168-1173.
Pmpp loss of modules using cell type E recovered partially while
relative Pmpp loss of modules using cell type F recovered fully.
17 18SUNLENS INSIDE
19
INSIDE 20SUNLENS INSIDE
Suntech Ranked In the
“Global Top 20 Companies
On PV 2021”
On May 10, the " Brand Power-2021 China Carbon Neutral Summit & Global Top 20 Companies Press
Conference on PV/Energy Storage Industry 2021 " sponsored by PV 365, Energy Storage 365 and
Smart Energy was held in Hangzhou, Zhejiang Province. Suntech ranked in the three lists of " Global
Top 20 Companies on PV 2021 ", " Chinese Top 20 Companies on PV 2021 " and " Top 20 Chinese
Solar Panel Companies on PV 2021 ”.
As the first-hand Industry Guide for industry development In recent years, Suntech saw steady growth in business,
research, credit, investment, cooperation and procurement, year by year increase of export scale, and refreshing
the Global Top 20 Companies Press Conference on PV has shipment volumes. Relying on pragmatic operation, Suntech
always adhered to the evaluation purpose of "viewing the has established a sound pre-sales and after-sales service
development with data, testifying strength with business system worldwide, with sales footprints covering 100
performances". Through detailed data research and based countries and regions across the globe and more than 1,500
on the annual business performance of the previous year, it premium partners. Through the advantages and synergies of
reveals the advantages of enterprises in various segments vertical integration of the Group, Suntech has 10 GW+
of PV industry for media, investors, financial institutions, global efficient module production capacity currently. In April
related industries, third party service organizations in the this year, Suntech officially launched the 2 GW TOPCon
industry. Suntech, with its global famous brand cells capacity layout with the commitment to forging the first
comprehensive influence and excellent product output, is digitized smart factory for high-efficiency TOPCon PV Cells
ranked in the three major lists: in the industry, marking a new breakthrough in the advanced
capacity of the company.
The 8th in the Top 20 Chinese Solar Panel Companies
on PV 2021
The 13th in the Chinese Top 20 Companies on PV 2021
The 16th in the Global Top 20 Companies on PV 2021
21 22SUNLENS INSIDE
Suntech Moistened The Improving Livelihood
In recent years, Suntech has many other supply projects in aspiration, continuously improving the product transfer
Driest Land terms of ensuring people's livelihood besides Sudan: In
March 2020, the photovoltaic pumping irrigation system
supplied by Suntech in Yemen was completed. In 2021,
efficiency, keeping on strengthening the R&D of new
technologies and the improvement of production technology.
In the future, Suntech will continue to improve global
Suntech continued its global layout and set up a local pre-sale and after-sale service systems and light up every
distribution agency in Sri Lanka to provide professional and corner of the world with the cleanest and richest solar
Back in March 2020, Suntech supplied 206 kW high-efficiency poly modules to Sudan market. It marked the 100th
convenient photovoltaic products and services for its market. energy.
countries and regions of Suntech’s shipment worldwide. Now let's go to Sudan, to witness the performance of
"Solar Powering a Green Future" has been the corporate
Suntech modules in the "Stove of the World".
mission of Suntech since 2001. Over the past two decades,
every Suntecher has been staying true to the original
Active Transformation of
Energy Structure
Sudan, located in the northeast of Africa and the eastern end
of the Sahara Desert. Featured with dry and hot climate
which provides favourable objective conditions for the
development of photovoltaic industry; on the other hand,
Sudan's economic structure is single and dominated by
agriculture and animal husbandry industries. In recent years,
Sudanese Government has introduced a number of
initiatives to increase the share of renewable energy in the
country's energy structure, and Suntech modules are part of
the program.
Tickles Breeding Hope
Suntech has supplied about 5.3 MW PV modules to Sudan advantages to solve the power problem has stimulated the huge
market in 2020. More than 13,336 pieces of Suntech’s potential of solar market. Suntech has expanded its distribution
high-efficiency modules were ingeniously installed on the scale in Sudan, holding 70% of the local market share so far. By
yellow earth of the dried-up rivers to absorb the sunlight. The setting up a new office in Khartoum, the footprints of Suntech
solar-powered electricity pumped water in a steady stream modules have covered both south and north Sudan. Meanwhile,
from the underground water sources. The land is barren, but technical support and warranty work will also be provided by the
the trickles of water breed hope. local teams in Sudan.
In Sudan, the reasonable utilization of geographical
23 24SUNLENS INSIDE
2 GW
of Digital Intelligent Production Line for
TOPCon High Efficiency Batteries
Ultra-high Efficiency High Bifacial Rate High Intensity Design
- TOPCon battery efficiency over 24% - Module bifacial rate over 80% - Front maximum load: 5400 Pa
- Back maximum load: 2400 Pa
25 26SUNLENS INSIDE
Suntech, Lead Intelligent and
Leadmicro Forge a 2 GW
Digitized Smart Factory for
High-Efficiency TOPCon Cells
On April 21st, Suntech, together with Lead Intelligent and Leadmicro signed a cooperation agreement
for the three parties to forge the first digitized smart factory for high-efficiency TOPCon PV Cells in the
industry. President of Suntech, Tang Jun, and Chairman of Lead Intelligent, Wang Yanqing graced the
occasion to witness the ceremony.
The smart factory for high-efficiency TOPCon PV Cells for human intervention and achieve the standards of a highly
developed by Suntech, Lead Intelligent and Leadmicro efficient factory.
utilizes leading industrial internet technology for smart
This partnership will continue the long history of
factory solutions. Based on ALD atomic deposition coating
collaboration between Lead Intelligent and Suntech. Lead
techniques, silkscreen printing technique, smart TOPCon
Intelligent developed the first-generation automatic PV
turnkey production line, automatic material feeders,
module production line for Suntech, thus successfully ended
unmanned AGV for PV cell plates and widespread
the dominance of foreign PV equipment manufacturers. On
adaptation of FMS operations control, the production line
the 20th anniversary of Suntech, the two pioneers joined
can produce both M10 (182mm) and M12 (210mm) cells.
hands again to mark a more significant milestone.
The conversion efficiency of TOPCon is in excess of 24%
and the total production capacity can achieve 2 GW. In recent years, through Suntech Group’s successful vertical
integration, it had accumulated a combined 10 GW of
The smart factory is the first in the industry to establish a
high-efficiency production capacity worldwide. The
fully digital-based production line. It is equipped with sensor
insistence on innovative PV technology has always placed
technology and intelligent & connected equipment
Suntech in a leading position in the industrialization of new
production technology to automatically monitor and collect
technology applications. The forging of the 2 GW smart
data in real-time, allowing production, logistics, and storage
factory for high-efficiency TOPCon PV cells is a testament to
to make automatic changes accordingly. The factory also
Suntech advanced production and breakthrough techniques.
uses visual data augmentation to monitor the product quality
In 2021, Suntech will continue to continue to improve and
in real-time for the prevention of defects and the need for
increase collaboration with the industrial chain, be devoted
rework. Based on industrial internet technology, the smart
to servicing the global customers and satisfy the global PV
factory solution will include big data analysis and control.
industry’s demand for high-quality and high-efficiency PV
Man-Machine Interface technology will also enhance
products.
efficiency on decision-making. It can be seen that the fully
digitized TOPCon production line would stay competitive,
enhance control of the production process, reduce the need
27 28SUNLENS INSIDE
Suntech, Lead Intelligent and Leadmicro Forge a 2 GW
Digitized Smart Factory for High-Efficiency TOPCon Cells
29 30SUNLENS INSIDE
Improving Grid Integration of Figure 3 shows an example of the combination factors determined for locations in
Renewable Energies
Germany for the year 2017 for a forecast horizons of 15 minutes depending on the day
in the year. The variation of the weighting factors depending on the season is clearly
visible. For this short forecast horizon of 15 minutes the persistence forecast dominates
in winter. Summer, on the other hand, was characterized by unstable weather conditions
with frequently changing clouds. Accordingly, the cloud motion vector satellite forecast
A success story based on combinational PV power forecasts was increased in weighting by the regression models. The numerical weather models
receive only a low weight throughout the year.
Dr. Christian Kurz In this paper we present an integrated combinational solar power forecast based on machine learning
Head of Prognoses & Data Analytics algorithms. The forecasting system is used to optimize the grid and market integration of Renewable Energies.
meteocontrol GmbH – Energy & Weather Services
Solar Power Forecasts; Machine Learning; Grid Integration
Augsburg, Germany
c.kurz@meteocontrol.com
I. Introduction Figure 2. Redispatch energy in Germany from 2010 to 2017. Data source:
Bundesnetzagentur.
Renewable energies represent an increasingly important
contribution to our energy supply system. In Germany alone, B.Grid Stability and Redispatch
installed photovoltaic (PV) capacity is around 45 GW (as of
Numerical weather prediction models have been state of the art in calculating renewable
July 2019). However, a strong increase in capacity can also energy production forecasts for many years [5]. The models of several international and Figure 4. As figure 3, but for a forecast horizon of 2 hours.
lead to challenges in terms of secure grid integration. One national weather services are combined in order to generate the best possible combinational
way of making it easier to plan the production and feed-in of forecast depending on the weather situation. The main focus for the use of numerical A changed picture emerges in the short-term range of 2 hours, see figure 4. Even in
weather forecasts is the day ahead application. For a long time, these models were also winter, the dominance of the persistence forecast is no longer very pronounced. In
renewable energies is to draw up and optimize solar power
used for intraday short-term forecasting. Due to the complexity and the associated long summer it even receives the lowest weight of all 3 input forecasts. Here, as already for
forecasts. This paper presents a combinational approach to
computing time, however, the accuracy of the numerical models is particularly limited in the the 15 minute horizon, the satellite forecast dominates. The consistently high weight of
improve solar power production forecasts, especially in the short-term range. the numerical forecast is conspicuous, especially in combination with the satellite
short-term area (intraday). The results are discussed as forecast. This can be explained by the cloud motion vector prediction method. This is
examples for the German market, but can be generalized to C.PV Monitoring Data
based on a shift of existing cloud patterns into the future. Meteorological effects such as
Figure 1. Intraday trading volume in Germany from 2009 to 2018.. Data cloud formation or dissipation are not represented in this method. This information was
other countries.
Further important information is provided by measured values of solar power production from taken from the numerical weather models, whose weighting was chosen accordingly
source: Epex Spot – European Power Exchange.
monitoring systems. In contrast to the two methods described so far, in which the PV output high by the regression algorithm.
is only calculated, monitoring systems provide real PV power measurements. The data can
therefore be used very well for the calibration of satellite and numerical forecasts. At the
same time, the actual production value can be used to create an estimate for the next few
IV.Results
II.Need for Solar Power Forecasts III.Combinational Forecasts minutes by means of a persistence forecast. Naturally, the accuracy of a forecast based on a
persistence approach, i.e. the assumption of constant cloud structures, may be very limited In summary, figure 5 shows the accuracy achieved with the combined forecast system
depending on the weather condition.
A.Energy Trading State of the art forecasting methods combine different as a function of the forecast horizon. Results are normalized to the root mean square
error of the numerical weather forecast, which was used as standard for forecasts also in
Until a few years ago, the market integration of solar power in Germany took information or input forecasts. Especially for short-term
the short-term range for a long time. The graph also summarizes the respective
place exclusively in the day ahead segment. Due to the uncertainties in the applications, numerical weather prediction models, satellite D.Combination by Machine Learning
advantages and disadvantages of the individual forecast approaches. The persistence
weather models, however, this is associated with forecasting errors that have to images and current PV production values from monitoring The decisive step in the forecasting process is the optimal combination of the three input forecast derived from the measured values has advantages especially for the current
be compensated during the actual day. As the share of renewable energies forecasts mentioned above. The ideal model combination depends on the geographical
systems are usually used. These 3 products are described in time step and the short term range, since it concerns real power measurements.
increased, the amount of unbalanced energy due to these forecasting errors for location of the PV system, the forecast horizon, the position of the sun, and other
more detail in the following sections. The combination However, the accuracy decreases rapidly as the forecast horizon increases. The cloud
the following day became increasingly large. This was associated with steadily parameters. Machine learning methods can be used for the combination. In the present motion vector forecast derived from the satellite data is, as described above, subject to
rising costs due to the procurement of balancing energy. For this reason, intraday factors are usually learned from machine learning methods case, a simple linear regression approach was implemented. Production data in 15 minute certain uncertainties due to the conversion of a cloud image to irradiance. Nevertheless,
trading was also opened for renewable energies. This market has developed based on historic measured values. resolution from 786 solar plants in Germany for one year were used for validation. A new it is the most precise source for the forecast period between about 2 and 4 hours.
rapidly since its introduction. Figure 1 shows that the intraday trading volume has simulation was calculated every 15 minutes. The forecast was adjusted separately for each Decisive for the approach chosen here is the result that the calculated combination
increased tenfold within only 10 years to around 50 TWh (for the year 2018). It quarter of an hour of the day to the measured values. forecast always has a higher accuracy than each of the 3 individual input forecasts. This
can be assumed that this process will develop even faster in new, faster growing A.Cloud Motion Vector Satellite Forecast applies to all forecast horizons.
markets. New, optimized short-term forecasts are therefore essential.
For the short-term range of some hours a 'cloud motion vector' prediction based
on current satellite images is used [1,2]. The displacement of cloud structures is
determined from two consecutive satellite images by pattern recognition. The
B.Grid Stability and Redispatch method is applied to each pixel of the image. This results in a vector field that
describes the speed and direction of the atmospheric flow. These vectors are
Another important area of application for short-term forecasts is grid stability.
used to extrapolate the current cloud structures into the near future. In the last
The spatial distribution of energy generation and load often differs in grids with a
step irradiance at the ground is calculated from the predicted cloudiness [3]. The
high share of renewable energies. The associated energy flow can lead to a high
latest development is the use of satellite images in the thermal (infrared) spectral
load on individual power lines. To prevent this, the network operators carry out
range [4]. This makes it possible to calculate forecasts for the early morning
redispatch measures. This can mean that in case of strong wind or solar power
hours, even if no satellite information in the visible spectral range is available at
production renewable energy plants have to be reduced in output in certain grid
the time of calculation. The 'cloud motion vector' forecasts are produced in
areas. At the same time, conventional plants have to be ramped up. Figure 2
cooperation with the University of Oldenburg.
shows the strong increase in redispatch measures (in terms of redispatch
energy). Improved short-term forecasts can be an effective means of reducing
Figure 3. Weighting factors for the 3 input forecasts in dependence of the Figure 5. Normalized root mean square error of the 3 input forecasts, and
the further increase in this energy and the associated further increase in costs.
day in the year. Forecast horizon: 15 minutes. the combinational forecast in dependence of the forecast horizon.
31 32You can also read