Supplement of Reconstructing past hydrology of eastern Canadian boreal catchments using clastic varved sediments and hydro-climatic modelling: 160 ...
←
→
Page content transcription
If your browser does not render page correctly, please read the page content below
Supplement of Clim. Past, 17, 653–673, 2021
https://doi.org/10.5194/cp-17-653-2021-supplement
© Author(s) 2021. CC BY 4.0 License.

Supplement of
Reconstructing past hydrology of eastern Canadian boreal catchments
using clastic varved sediments and hydro-climatic modelling:
160 years of fluvial inflows
Antoine Gagnon-Poiré et al.

Correspondence to: Antoine Gagnon-Poiré (antoine.gagnon-poire@ete.inrs.ca)

The copyright of individual parts of the supplement might differ from the article licence.
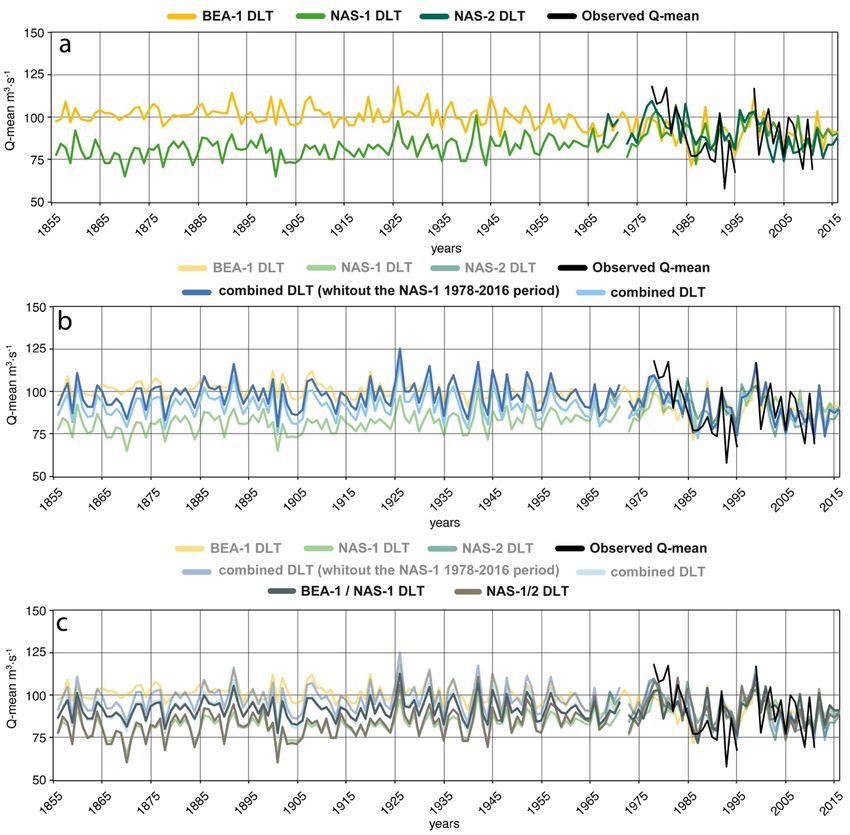
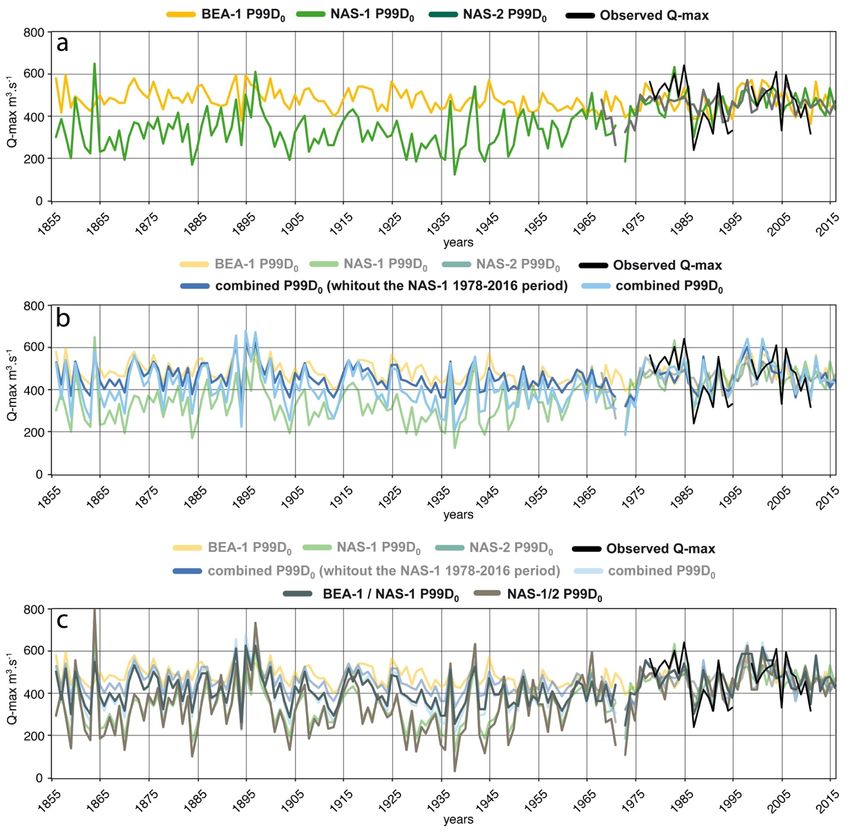
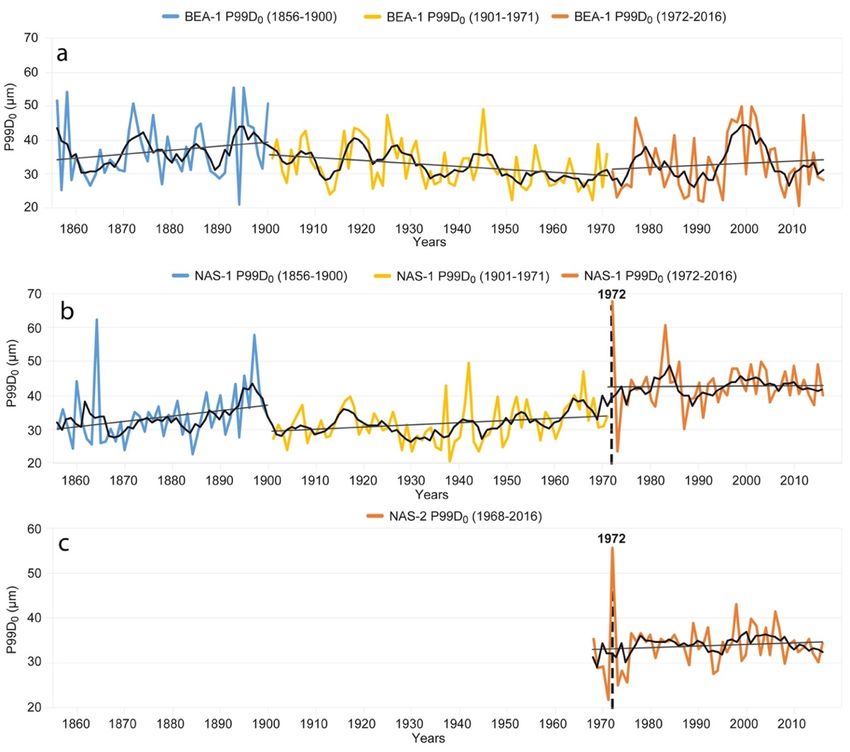
This supplementary material provides additional visual support and statistical information
on varve’s parameters series. Quantitative data on the sedimentological response of cores
NAS-1 and NAS-2 to post-1972 Naskaupi River hydrological changes are also available.

Total varve thickness (TVT), detrital layer thickness (DLT) and the particle size (P99D0)
series from different sites (BEA-1, NAS-1 and NAS-2) share similarities in their short- and
longer-term variability. TVT and DLT series (Fig. S1, S2, Tab. S1, S2) generally show
downward trends especially in core BEA-1 and NAS-2. A step in the TVT and DLT is
observable in the early 1920s at the three sites. Despite the increase in thickness values
of varves deposited post-1971 in core NAS-1, each core has recorded a decrease for the
1972-2016 period.

P99D0 series of core BEA-1 and NAS-1 (Fig. S3, Tab. S3) show a slight coarsening trend
towards the end of the 19th century. From 1900 to 1971, P99D0 values are generally below
average. There is an increase of P99D0 values in core NAS-1 after 1972, but this increase
remains very moderate. An increase of P99D0 values in core BEA-1 is also observed after
1972 while the Beaver River’s catchment is devoid of anthropogenic modifications and
most likely unaffected by the Naskaupi River diversion.

Varve’s parameters series reveals common decadal-scale variability, especially P99D0
series (Fig. S3). Recently, all series show high river discharges from 1975 to 1985 and
1995 to 2005 and lower river discharges from 1985 to 1995 and 2005 to 2016.

Fig. S4 and S5 of the supplements present all reconstructions tested using different
sources   of   sedimentological    data.   Despite   differences,   Q-mean    and   Q-max
reconstructions are consistent with the observed data and generally share common
interannual variability. Note that there are small differences between reconstructions using
the combined DLT and P99D0 series (without the NAS-1 1978-2016 period) and the
combined series including all data (Fig. S4b, S5b). Excluding or not the 1972-2016
measurements from NAS-1 from the combined series has no major incidence on
reconstructions. Indeed, a statistically significant decreasing trend is observed over the
last 90 years in both reconstructed Q-mean series using combined DLT series without the
NAS-1 1978-2016 period or the DLT combined series including all data reconstructions
(Fig. S4b).

Tab S6, S7, S8, S9, S10, S11 of the supplements provide the results of model calibration
using a twofold cross-validation technique over the instrumental period for all Naskaupi
River Q-mean, Q-max and Labrador region Q-mean reconstructions. Average coefficient
of efficiency (CE) and average reduction of error (RE) were calculated over the verification
period to evaluate reconstruction skills. CE and RE value, ranging from + 1.0 to -∞. RE >
0, indicates that the reconstruction is better than the calibration period mean. RE and CE
≤ 0 being no better than the calibration period. Statistics in boldface show that
reconstructions proposed in Fig. 8 and 9 of the paper offer the best calibration and
validation results.
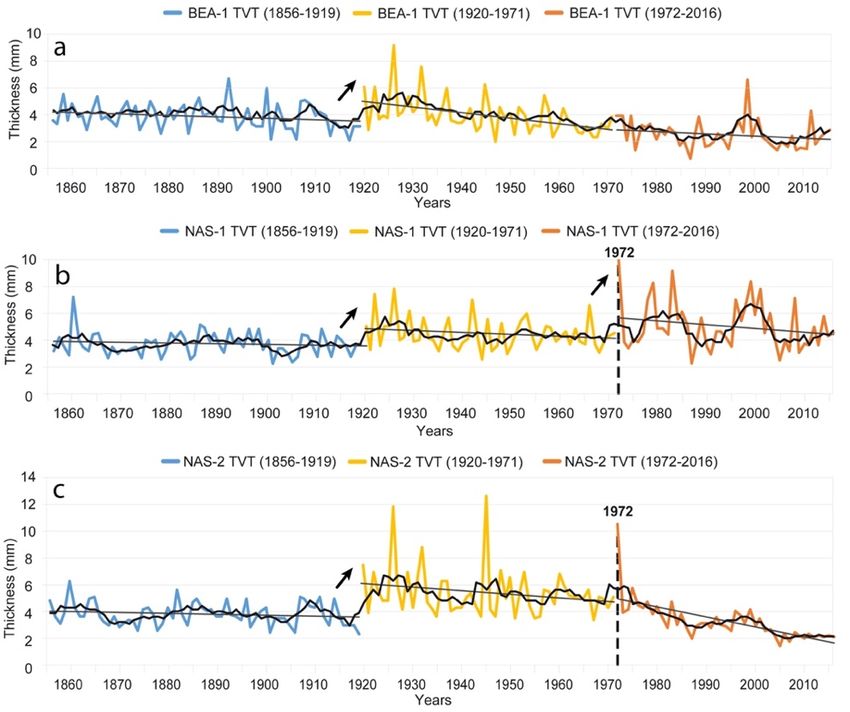
Figure S1 Total Varve Thickness (TVT) time series of core (a) BEA-1, (b) NAS-1 and (c)
NAS-2, with 5-year moving average (black line). Trend lines are shown for the 1856-
1919, 1920-1971 and 1972-2016 periods (thin black lines). The 1972 marker layer is
outlined by the thick black dashed line.

Table S1 The mean, variance and trend of TVT series from each site for the 1856-2016,
1856-1919, 1920-1971 and 1972-2016 periods. Trends of mean in Boldface are
significant using the mantel and Kendal trend test.
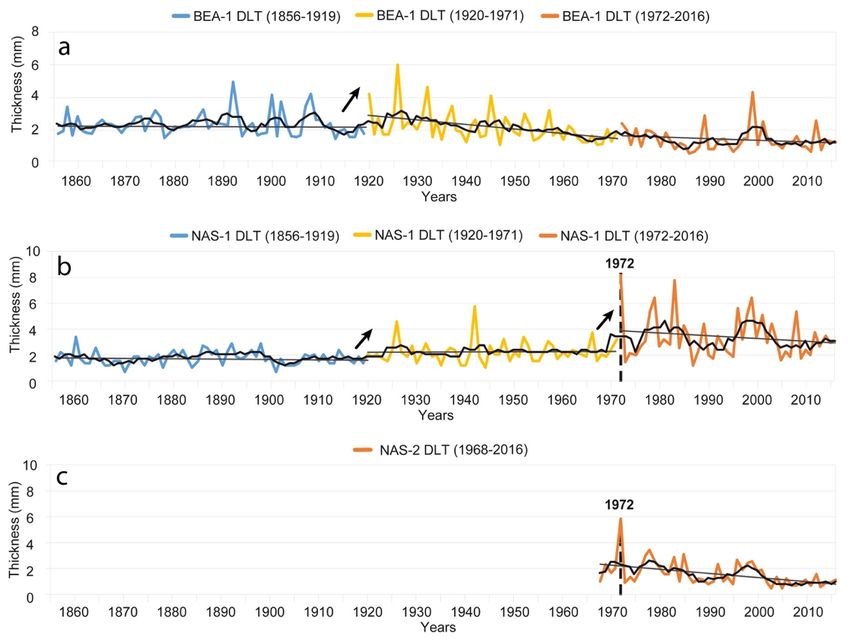
Figure S2. Detrital Layer Thickness (DLT) time series of core (a) BEA-1, (b) NAS-1 and
(c) NAS-2, with 5-year moving average (black line). Trend lines are shown for the 1856-
1919, 1920-1971 and 1972-2016 periods (thin gray lines). The 1972 marker layer is
outlined by the thick black dashed line.

Table S2. The mean, variance and trend of DLT series from each site for the 1856-2016,
1856-1919, 1920-1971 and 1972-2016 periods. Trends of mean in Boldface are
significant using the mantel and Kendal trend test.
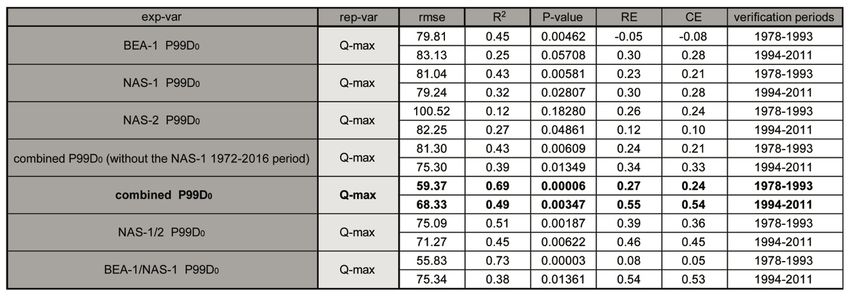
Figure S3. P99D0 time series of cores (a) BEA-1, (b) NAS-1 and (c) NAS-2, with 5-year
moving average (black line). Trend lines are shown for the 1856-1919, 1901-1971 and
1972-2016 periods (thin black lines). The 1972 marker layer is outlined by the black
dashed line.

Table S3. The mean, variance and trend of P99D0 series from each site for the 1856-
2016, 1856-1900, 1901-1971 and 1972-2016 periods. Trend of mean in Boldface are
significant using the mantel and Kendal trend test.
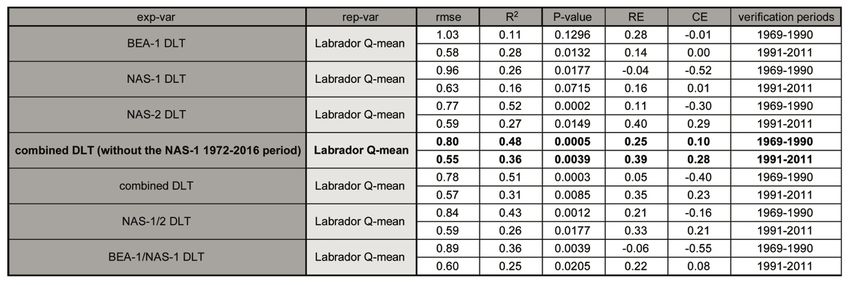
Table S4 P-values of correlation coefficients (Pearson r) between the hydrologaical
variables with Total Varve Thickness (TVT), Detrital Layer Thickness (DLT) and particle
size (P99D0) on the instrumental period (1978-2011; n=31) for each core. P-values in
boldface are significant at p < 0.05.

Table S5 Significant positive correlations between the instrumental Naskaupi River
mean annual discharge data (Q-mean) with other hydrometric stations Q-mean series on
the instrument period (1978-2011).
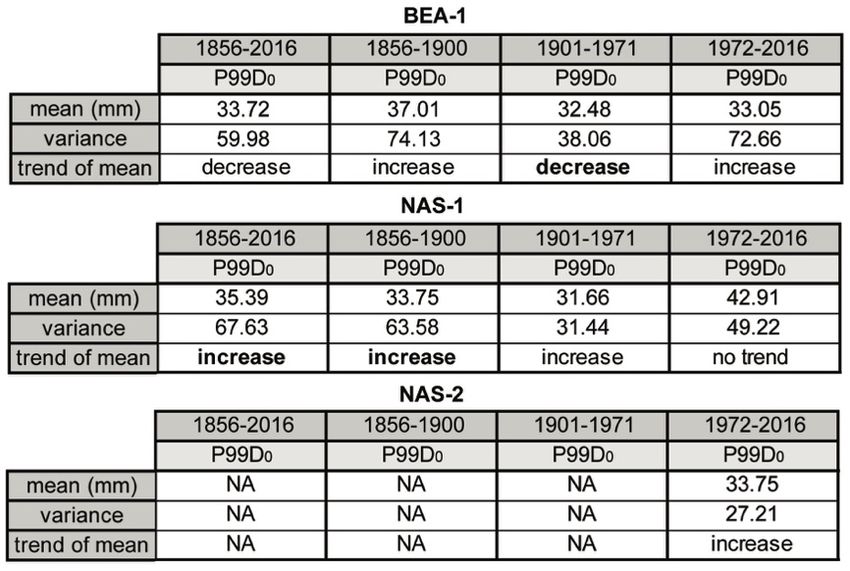
Figure S4. Naskaupi River Q-mean reconstructed from the DLT series using (a) single-
core data, (b) combined DLT series, and (c) other combinations of core data. Observed
Q-mean is also shown for the 1978-2011 period (black line).
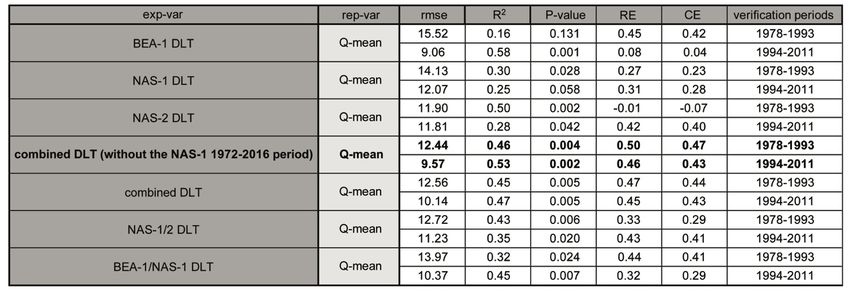
Figure S5. Naskaupi River Q-max reconstructed from the P99D0 series using (a) single-
core data, (b) combined P99D0 series, and (c) other combinations of core data.
Observed Q-max is also shown for the 1978-2011 period (black line).
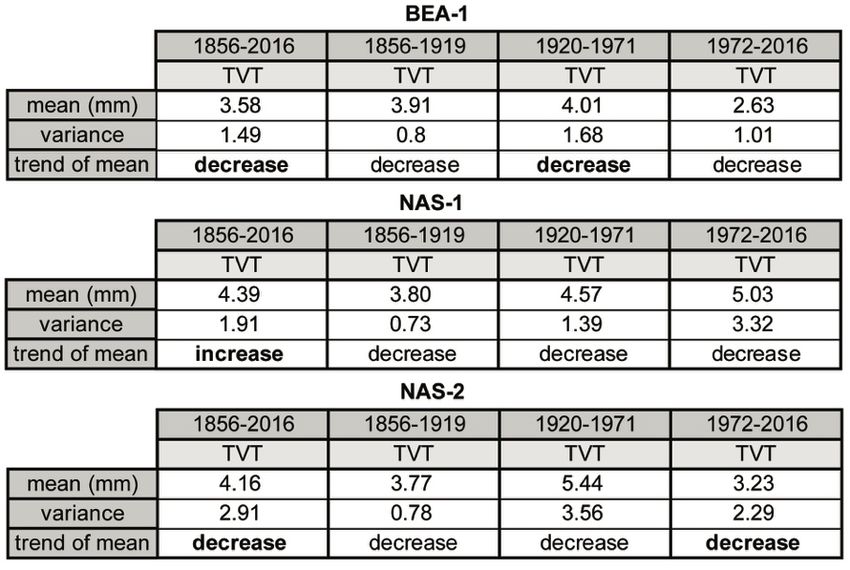
Table S6. Statistics of model calibrations using a simple linear regression between the
different DLT series and the observed Q-mean data on the total instrumental period
(1978-2016).

Table S7. Statistics of model calibrations based on a twofold cross-validation technique
to validate the predictive ability of the reconstructed Naskaupi River Q-mean series.
Coefficient of determination (R2) and root mean square error (RMSE) are given for
calibration periods while reduction of error (RE) and coefficient of efficiency (CE) are
given for the verification periods.
Table S8 Statistics of model calibrations using a simple linear regression between the
different P99D0 series and the observed Q-max data on the total instrumental period
(1978-2016).

Table S9 Statistics of model calibrations based on a twofold cross-validation technique
to validate the predictive ability of the reconstructed Naskaupi River Q-max series.
Coefficient of determination (R2) and root mean square error (RMSE) are given for
calibration periods while reduction of error (RE) and coefficient of efficiency (CE) are
given for the verification periods.
Table S10. Statistics of model calibrations using a simple linear regression between the
different DLT series and the observed Labrador region Q-mean data on the total
instrumental period (1969-2016).

Table S11. Statistics of model calibrations based on a twofold cross-validation technique
to validate the predictive ability of reconstructed Labrador region Q-mean series.
Coefficient of determination (R2) and root mean square error (RMSE) are given for
calibration periods while reduction of error (RE) and coefficient of efficiency (CE) are
given for the verification periods.
You can also read