SUSTAINABLE AVIATION A DECADE OF PROGRESS - www.sustainableaviation.co.uk
←
→
Page content transcription
If your browser does not render page correctly, please read the page content below

SUSTAINABLE
AVIATION
A DECADE OF
PROGRESS
            5 2015
         200

              www.sustainableaviation.co.uk
Progress Report 2015
Executive summary
In 2005 the UK aviation industry was a world first in coming together to establish Sustainable
Aviation (SA) committed to working together towards a sustainable future. In 2015, 10 years on, the
industry remains committed to making a positive contribution to the British economy, and meeting
the needs of society for air transport whilst minimising environmental and social impacts. In this
time, significant steps have been taken to reduce UK aviation’s environmental impacts - for example
reducing SA airline carbon emissions by 20 million tonnes since 2005 whilst carrying 19% more
passengers.
This is SA’s 5th Progress Report highlighting 10 years of achievement by this unique coalition of UK
industry. Our progress against the seven key goals of the SA strategy is presented in this report with
the key highlights presented in the infographic on the next page.
The timeline below and infographic overleaf, summarise key highlights from SA’s work.
SA will continue its focus on working together to reduce environmental impacts, including:
Updating the SA CO2 Road-Map
Publishing discussion papers on air quality and the social-economic impacts of the industry
Working with the UK Government to realise the opportunities shown in our Road-Maps.
Specifically this will involve;
o Maintaining financial investment in UK aerospace research and development
o Enabling airspace modernisation in the UK
o Supporting the development of sustainable fuels for aviation in the UK
SA looks forward to working with a wide range of stakeholders in delivering this future work, from
both within and outside the aviation sector. If you would like to get involved or would just like to
learn more, please contact us.
www.sustainableaviation.co.uk Page 2 of 91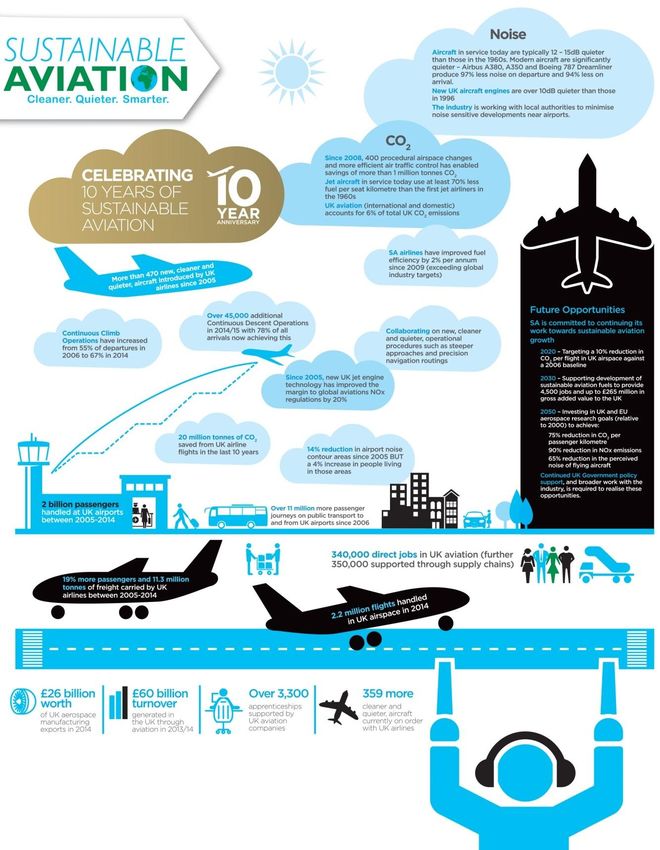
Progress Report 2015

                                10th Anniversary Progress Infographic

www.sustainableaviation.co.uk                                           Page 3 of 91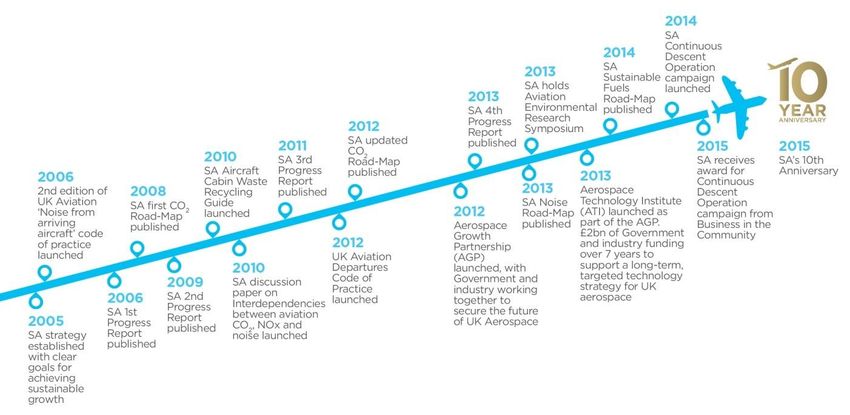
Progress Report 2015

Contents
Executive summary ...................................................................................................................... 2
1     Chair’s Review ...................................................................................................................... 6
2     SA Advisory Board Comment ................................................................................................ 8
3     Introduction ......................................................................................................................... 9
4     Performance against Goals ................................................................................................. 10
    4.1      Goal 1: Social and Economic ................................................................................................. 10
      4.1.1         Key Facts: ...................................................................................................................... 10
      4.1.2         UK Aviation Wider Economic Impacts........................................................................... 10
      4.1.3         Scale of UK Aerospace Manufacturing.......................................................................... 11
      4.1.4         UK Aviation Social Contributions .................................................................................. 12
      4.1.5         Summary ....................................................................................................................... 14
    4.2      Goal 2: Climate Change ......................................................................................................... 15
      4.2.1         Key facts ........................................................................................................................ 15
      4.2.2         Context of UK aviation CO2 emissions .......................................................................... 16
      4.2.3         The SA CO2 Road-Map 2012 .......................................................................................... 16
      4.2.4         The SA Fuels Road-Map 2014 ....................................................................................... 17
      4.2.5         Progress in addressing UK aviation CO2 emissions ....................................................... 18
      4.2.6         The Future – What Next? .............................................................................................. 30
    4.3      Goal 3: Noise ......................................................................................................................... 31
      4.3.1         Key Facts ....................................................................................................................... 31
      4.3.2         The SA Noise Road-Map................................................................................................ 31
      4.3.3         Progress in addressing noise from UK aviation............................................................. 32
      4.3.4         Specific SA work to address aircraft noise .................................................................... 33
      4.3.5         Next steps ..................................................................................................................... 42
    4.4      Goal 4: Local Air Quality ........................................................................................................ 43
      4.4.1         Key facts ........................................................................................................................ 43
      4.4.2         Air Quality Context ........................................................................................................ 43
      4.4.3         Working across the industry to reduce Air Quality emissions from aircraft ................ 44
      4.4.4         Working with others to tackle air quality ..................................................................... 46
      4.4.5         Next Steps ..................................................................................................................... 47
    4.5      Goal 5: Surface Access .......................................................................................................... 48
      4.5.1         Key facts ........................................................................................................................ 48
www.sustainableaviation.co.uk                                                                                                          Page 4 of 91
Progress Report 2015

        4.5.2          Use of Public Transport to access UK airports .............................................................. 48
        4.5.3          Current Initiatives to improve surface access ............................................................... 49
        4.5.4          Future opportunities ..................................................................................................... 50
    4.6        Goal 6: Natural Resources..................................................................................................... 51
        4.6.1          Key facts ........................................................................................................................ 51
        4.6.2          SA waste working group ............................................................................................... 51
        4.6.3          Airport waste recycling improving ................................................................................ 53
        4.6.4          Aircraft end of life recycling .......................................................................................... 53
        4.6.5          Energy, Water and Construction Management ............................................................ 54
        4.6.6          Next Steps ..................................................................................................................... 54
    4.7        Goal 7: Implementation ........................................................................................................ 55
        4.7.1          Implementing SA ........................................................................................................... 55
        SA Members implementing SA’s Goals and Vision ....................................................................... 56
        4.7.2          Next steps ..................................................................................................................... 57
5       Future Work Programme and Next Steps ................................................................................... 58
Glossary ................................................................................................................................................ 59
Appendix 1 SA Governance .................................................................................................................. 60
    SA Vision ............................................................................................................................................ 60
    SA Goals ............................................................................................................................................. 60
    SA Members and Signatories ............................................................................................................ 62
    SA Organisational Structure .............................................................................................................. 62
Appendix 2 – SA Member Case Studies ............................................................................................... 63
    CO2 Case Studies................................................................................................................................ 63
        Aerospace Technology Improvements – New aircraft and aero engines ..................................... 63
        Airline CO2 reduction work – New Aircraft and Fuel Efficiency work .......................................... 68
        Operational Improvement work ................................................................................................... 72
        SA Fuel Case Studies ..................................................................................................................... 75
    Noise Case Studies............................................................................................................................. 77
    Air Quality Case Studies .................................................................................................................... 83
    Surface Access Case Studies .............................................................................................................. 85
    Natural Resources Case Studies ........................................................................................................ 86
    Implementation Case Studies............................................................................................................ 88

www.sustainableaviation.co.uk                                                                                                             Page 5 of 91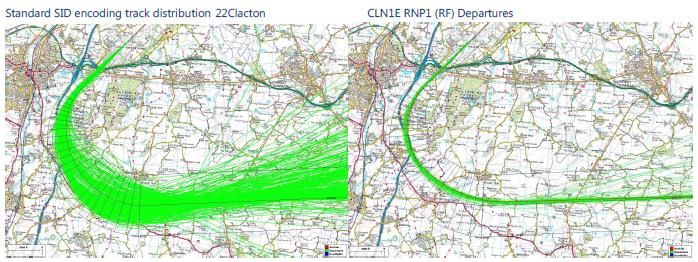
Progress Report 2015

1 Chair’s Review
This is the 10th year of SA, having been established in 2005 with members from the airline, airport,
aerospace manufacturing and air traffic control sectors, largely in recognition that addressing our
environmental impacts is an industry challenge and best achieved through working collaboratively.

So 2015 has been a good opportunity for us to look back and reflect on the progress we have made
over these last ten years.

On climate change we have focused our efforts on our Carbon Road-Map, first produced in 2008
which depicts how we believe we can play our part in achieving the global aviation industry’s
commitment to reducing net emissions by 50% relative to 2005 levels by 2050. Over this time we
have improved our carbon efficiency by over 11% and since 2010 this has improved by 1.9% pa
exceeding the industry goal of 1.5 % per year.

This has been largely achieved through the acquisition of 470 new aircraft valued at US$50 billion,
with these aircraft being up to 20% more fuel efficient than the aircraft they replace. This has
resulted in a saving of 20 million tons of CO2 over this time period. The UK aerospace manufacturing
sector has played a key role in delivering these more fuel efficient aircraft through large scale
investments in research and development. The Aerospace Technology Institute (ATI), formed with
considerable support from the UK government, has made a made a significant contribution to this.

At SA we recognise that to achieve our 2050 target we will need the support of a global market
based measure and since 2005 there has been good progress to develop this mechanism through
ICAO to enable the industry to achieve its interim target of carbon neutral growth from 2020. From
2012 EU aviation was included in the EU Emissions Trading Scheme for all intra-EU flights and since
then UK airlines have reduced their net carbon emissions by an additional 6 million tonnes through
surrendering carbon credits acquired through the scheme.

We have also made good progress in relation to sustainable alternative fuels with SA members
embarking on two industry leading projects - British Airways and its waste to jet fuel plant in the UK
and Virgin Atlantic and its waste gases to fuel project in China.

As well as making impressive progress regarding our carbon emissions there has also been good
progress regarding our noise performance. Since 2005, the combined noise contour area at 6 major
UK airports has reduced by 14% again achieved through the acquisition of new aircraft that have a
reduced noise footprint area of 50% compared to the aircraft that they replace. In addition, there
has been an improvement in the operating procedures to reduce noise including more than 40,000
additional continuous descent approaches per annum across the UK and the launch of steeper
approaches at Heathrow airport.

www.sustainableaviation.co.uk                                                            Page 6 of 91
Progress Report 2015

I am proud to have supported SA over the last ten years and been the Chair over the last two years
and I congratulate all our partners for their significant contributions in helping UK aviation
demonstrate that we can grow our industry and deliver greater economic and social benefits while
managing our environmental impacts.

Jonathon Counsell

Chair, SA 2014-2015
Group Head of Sustainability, International Airlines Group (IAG)

www.sustainableaviation.co.uk                                                         Page 7 of 91
Progress Report 2015

2 SA Advisory Board Comment
This 10th Anniversary report highlights the progress made by SA. It demonstrates the value added of
SA, showing that more can be achieved collaboratively and collectively when the UK aviation sector
combines to work together to achieve shared goals.

Since the last Progress Report the Advisory Board has deepened its engagement with SA through the
Working Groups, encouraging a higher level of ambition and specific action. We have seen good
results with this approach through several working groups including climate change, sustainable
fuels and noise.

We have also broadened and strengthened the membership of the Advisory Board in order to build
on this success going forwards. I would like to thank Tim Johnson at AEF for his commitment and
tireless work as Chair of the Stakeholder Panel over the last few years. I am delighted to be taking
up the role of Chair of the strengthened Advisory Board.

We encourage SA to build on the progress of the last decade and raise both its ambition and speed
over the decade to come. We commit to support the development of ambitious work-plans to
achieve the goals. We recognise the need for the work-plans to be backed by sufficient resources, in
order to support the sector to tackle the on-going challenges. The need to reduce CO2 emissions and
develop alternative fuels is ever more pressing, along with the international work on market-based
measures.

Catherine Cameron

Chair SA Advisory Board
Director, Agulhas: Applied Knowledge

The SA Advisory Board:
Catherine Cameron                      Chair SA Advisory Board and Agulhas Applied Knowledge
Tim Johnson                            Aviation Environment Federation
Owen Bellamy                           Committee on Climate Change
Professor Piers Forster                University of Leeds
Roger Gardner                          University of Southampton
Dr Darren Rhodes                       Civil Aviation Authority
Colin Potter                           UNITE the Union
Martin Schofield                       Aerospace Technology Institute
Marc Dittmer-Odell                     Confederation of British Industry

www.sustainableaviation.co.uk                                                          Page 8 of 91
Progress Report 2015

3 Introduction
This 5th progress report from SA highlights the progress made against each of our seven strategic
goals, since SA was formed in 2005. These goals are summarised below with more information on
SA’s governance, membership and approach presented in appendix 1.

Goal 1: Social and Economic
A competitive aviation industry making a positive contribution to the UK economy, and meeting the
needs of society for air transport, whilst maintaining constructive relationships with stakeholders.

Goal 2: Climate Change
Previous Goal - Aviation incorporated into a robust global policy framework that achieves
stabilisation of greenhouse gas concentrations in the atmosphere at a level that would prevent
dangerous man-made interference with the climate system.

New Goal agreed in 2015 - To identify, create and develop opportunities to reduce UK aviation
climate change emissions and enable sustainable growth.

Goal 3: Noise
Limit and, where possible, reduce the impact of aircraft noise.

Goal 4: Local Air Quality
Industry to play its full part in improving air quality around airports.

Goal 5: Surface Access
Industry playing its full part in an efficient, sustainable multi-modal UK transport system.

Goal 6: Natural Resources
Environmental footprint of UK aviation’s ground-based non-aircraft activities contained through
effective management and reduction measures.

Goal 7: Implementation
Full industry commitment to sustainable development and communicating fully the role of aviation
in society in order to support a better understanding of its contributions.

The next chapter details our performance against each goal. The focus has been on activities
achieved by the SA coalition. Broader sustainability initiatives and developments made by SA
members are highlighted in the case studies presented in appendix 2.

Following the presentation of SA’s performance against goals, the report concludes by considering
the future work priorities for SA, set out by the incoming SA chair, Ian Jopson.

www.sustainableaviation.co.uk                                                                  Page 9 of 91
Progress Report 2015

4 Performance against Goals

4.1 Goal 1: Social and Economic

                            A competitive aviation industry making a positive contribution to the UK
                            economy, and meeting the needs of society for air transport, whilst
                            maintaining constructive relationships with stakeholders

                            Despite the fluctuating economic climate over the last ten years SA and its
                            signatories have continued to offer significant economic and social benefits
                            to the UK.

4.1.1    Key Facts(1):
                                                                                          Total between 2005
                                         2005                          2014
                                                                                               and 2014
 Terminal Passengers              201.2 million                  211.9 million
                                                                                                 2 billion
handled by SA airports2       (87% of all UK airports)       (88% of all UK airports)
Passenger flown by SA             110.4 million                  132.1 million
                                                                                                1.2 billion
         Airlines3            (89% of all UK airlines)       (94% of all UK airlines)
    Freight and cargo            933,190 tonnes                 885,389 tonnes
                                                                                            9.4 million tonnes
  flown by SA Airlines        (84% of all UK airlines)       (82% of all UK airlines)
 Flights handled in UK
                                     2.3 million                    2.2 million                22.5 million
         airspace

Despite the wider global economic turndown following the financial crisis in 2007-08, SA airlines and
airports have bounced back and are now handling at least 5% more passengers than in 2005.

4.1.2 UK Aviation Wider Economic Impacts
In addition to the direct effect of flights handled by SA airlines and airports, in November 2014,
Oxford Economics produced a report looking at the broader economic impact of UK aviation4. The
key findings from this report show:

1
  Figures are derived from the UK Civil Aviation Authority published airline and airport statistics.
http://www.caa.co.uk/default.aspx?catid=80&pagetype=90
2
  SA Airports are defined as UK airports that are either a member or signatory to Sustainable Aviation
3
  SA Airlines are defined as UK airlines that are either a member or signatory to Sustainable Aviation
4
  See http://www.bata.uk.com/wp-content/uploads/2015/03/Oxford-Economics-2014.pdf
www.sustainableaviation.co.uk                                                                        Page 10 of 91
Progress Report 2015
UK Aviation’s Contribution to UK GDP
The aviation sector contributes £52 billion (3.4%) to UK GDP (Gross Domestic Product). This total
comprises:
£22.3 billion contributed through the output of the aviation sector (airlines, airports and
ground services, aerospace) itself;
£16.7 billion indirectly contributed through the aviation sector’s procurement from its
domestic supply chain; and
£12.9 billion contributed through the wage-financed spending by the employees of the
aviation sector and its direct supply chain.
Major employer
The aviation sector supports 961,000 jobs in the UK. This total comprises:
341,000 jobs within the aviation sector itself;
350,000 jobs indirectly supported through the aviation sector’s purchase of inputs from UK
suppliers; And
269,000 jobs supported through its payment of wages which stimulates consumer spending.
High productivity jobs
The average air transport services employee generates £84,000 in GVA (Gross Value Added)
annually, which is over 60% higher than the whole economy average in the UK.
Contribution to public finances
The aviation sector pays nearly £8.7 billion in tax in the UK. Taxes paid by aviation firms and
employees, contributes around £5.9 billion, and Air Passenger Duty (APD), a specific departure tax
paid by passengers, a further £3.2 billion. It is estimated that an additional £6.3 billion of
government revenue is raised in the aviation sector’s supply chain and £4.9 billion through taxation
of the activities supported by the spending of employees of both the aviation sector and its supply
chain.
Impacts of international tourists who arrived in the UK by air
Spending by foreign tourists who arrived by air supported a £19.6 billion GVA contribution to
UK GDP.
Their expenditure also supported 477,000 people in employment in the tourism industries,
their supply chains and through wage consumption impacts.
4.1.3 Scale of UK Aerospace Manufacturing
In addition to the numbers of passenger journeys facilitated by UK airports, airlines and air
navigation service providers, the UK aviation industry has a very significant role in aerospace
manufacturing. Despite the UK’s relatively small geographic size, our aerospace manufacturing
www.sustainableaviation.co.uk Page 11 of 91Progress Report 2015
industry is the second largest in the world with 17% of the global market share. The following facts
add further context to this.
UK aerospace manufacturing industries generated £29 billion turnover in 2014, a 27%
growth since 2010.
The industry generated £26 billion of exports in 2014 and the market is estimated to be
worth $5 trillion over the next 20 years
Currently UK Aerospace Manufacturing has 111,000 direct employees and 3,300 apprentices
The Aerospace Growth Partnership (AGP) has recently awarded its 500th bursary for
postgraduates studying for an MSc in aerospace engineering
The ATI, a joint initiative of the UK Government and industry to guide investment in
aerospace R&D, has supported over 100 projects, involving more than 134 organisations to
date. In its Autumn Spending Review (November 2015) the Government announced an
additional funding commitment of £900m to extend the ATI’s remit to 2026. This means that
the total joint funding now managed through the ATI is £3.9bn over 13 years
4.1.4 UK Aviation Social Contributions
SA organisations continue to deliver a wide range of social benefits covering areas such as:
Apprenticeship schemes
Graduate management schemes
Skill development and job specific training schemes
Charitable fund raising and volunteer work
There are a vast range of examples of this work from all the SA organisations and more details can
be found by visiting their websites. The following list gives a flavour of some of this work.
Airbus supports a variety of education and charity projects in the UK. Airbus in the UK has an
award winning apprenticeship programme responsible for enrolling around 4,000 apprentices
over the last three decades. More than 450 apprentices are currently in the scheme
Birmingham Airport’s Community Trust Fund makes grants of up to £3,000 to community
groups in areas most affected by the Airport’s operations. Each year they invest £75,000 in the
Trust Fund, to which any charges made to airlines which breach the airport’s night noise
regulations are added
Boeing supports community and STEM learning projects in the UK, such as The Schools Build-a-
Plane Challenge in partnership with The Royal Aeronautical Society (RAeS) xl clubs and Get Into
Product Design with The Prince’s Trust
Bristol Airport has given donations over £340,000 to charity by the airport’s staff and their
Business Partners over the past 10 years. Bristol Airport also works alongside Airbus and the
Bristol and Wessex Flying Club with the aviation charity fly2help to hold an annual Air Smiles
Day, which gives local young people a chance to take to the skies in a light aircraft courtesy of
volunteers from the local pilot community
British Airways’ Flying Start charity, in partnership with Comic Relief, aims to raise money to
help children in the UK and around the world. Since June 2010, the generosity of BA customers
www.sustainableaviation.co.uk Page 12 of 91Progress Report 2015
and staff has raised £12 million. The airline also supports more than 30 charities through its
Communities and Conservation programme. British Airways has this year recruited 175
apprentices and 50 graduates to its programmes across the airline. The airline also runs the
British Airways Future Pilot programme. Open to anyone from 18 to 55, with no previous flying
experience, it this year sought to recruit and train up to 100 potential pilots
East Midlands Airport’s on-site education centre, Aerozone, provides young people from
Foundation stage to University age, the opportunity to get a real insight into life at the airport.
Since opening in 2010 they have welcomed over 9,000 young people through organised visits
and community events
Gatwick Airport spent approximately £419,000 in 2015 on a wide variety of charitable donations
including a matched giving scheme, a matched fundraising scheme, corporate donations to staff-
chosen charities (Cancer Research UK, The Chestnut Tree House and Gatwick TravelCare),
sponsorships for the Gatwick Airport Charitable Trust and supporting events and projects within
our local communities. This also includes passenger donations of £45,000 which is split between
our three charities
Glasgow Airport’s FlightPath Fund was set up in 2010 to provide financial support to charities
and community groups committed to improving facilities and services available to local people.
Since launching, the total sum granted to projects and activities has amounted to over £850,000
Heathrow Airport’s Heathrow Academy has trained more than 3,500 people and more than
2,500 have progressed into work via the Heathrow Academy since it was established in 2004
Liverpool Airport’s chosen charity is the Alder Hey Children’s Hospital, which was selected by
staff via an employee vote
Luton Airport’s Community Trust Fund made 23 grants in 2014 totalling £50,000 to support a
range of local charities and community organisations
Manchester Airport supports Childflight, a children's charity established in 1987 to provide
flights and holidays for sick and deserving children who might otherwise miss out, including
children who need medical treatment overseas or who are socially deserving
NATS Footprint Fund donated £31,000 to 53 local causes in 2014, totalling £190,000 to 328
charities since launch in 2008. In addition 8% of our staff made ‘Give As You Earn’ donations
using the company payroll giving scheme, donating £133,500 to the charities they care about
Rolls-Royce actively works with schools and universities to increase interest and encourage
diversity amongst those taking Science, Technology, Engineering and Maths (STEM) subjects.
They have set themselves a target to reach 6 million people through their STEM education
programme and activities by 2020
Stansted Airport donated over £100,000 to local projects and initiatives in 2013/14 through the
Stansted Airport Passenger Community Fund and Stansted Airport Community Trust
TUI Group fundraising raised £1.25 million for charity in 2014. Thomson & First Choice staff and
customers took part in a range of activities both in the UK and abroad, raising more money than
ever before
Virgin Atlantic launched a new annual programme in 2014 specifically designed to create the
next generation of pilots. The Future Flyers Programme is a unique opportunity for people from
diverse backgrounds to become a long-haul pilot on some of the most technologically advanced
aircraft
www.sustainableaviation.co.uk Page 13 of 91Progress Report 2015 4.1.5 Summary SA will continue to focus on finding ways to improve how the industry manages environmental effects of aviation, to enable the on-going social and economic benefits that air travel generates for the UK. www.sustainableaviation.co.uk Page 14 of 91
Progress Report 2015
4.2 Goal 2: Climate Change
INITIAL GOAL: Aviation incorporated into a robust global policy framework
that achieves stabilisation of greenhouse gas concentrations in the
atmosphere at a level that would prevent dangerous man-made
interference with the climate system.
REVISED GOAL SINCE 2015: To identify, create and develop opportunities
to reduce UK aviation climate change emissions and enable sustainable
growth.
SA has prioritised its work over the last 10 years on reducing CO2 emissions and noise from UK
aviation. This section details our progress on reducing CO2. Our work has focussed on initiatives to
reduce CO2 emissions from aircraft and airport operations as we see this as our area of expertise. SA
has not spent time looking at climate adaptation issues but is aware that the majority of our
members have developed their own adaptation plans.
4.2.1 Key facts
UK aviation currently accounts for 0.1% of global anthropogenic CO25
Two SA Road-Maps on CO2 and Sustainable Fuels produced
SA Airlines have improved their fuel efficiency by almost 12% since 2005. This equates to a
saving of 20 million tonnes of CO2 over the 10 years
Since 2009 Airlines have improved their fuel efficiency by almost 2% per annum, exceeding
the global airline industry target for fuel efficiency improvement
Since 2005, UK airlines have introduced more than 470 new aircraft into service representing
an investment of over $49.6Bn at 2014 prices
UK domestic & international aviation account for less than 6% of total UK CO2 emissions in
20136. UK Department for Transport forecast that CO2 emissions from flights departing from
UK airports will increase from 33.3 Mt CO2 in 2011 to 35-52 Mt CO2 by 20507
Since 2012, 6 million tonnes of CO2 emissions credits have been surrendered by UK airlines
through the EU emissions trading scheme8 (ETS)
5
United Nations Statistics Division, CDIAC, Data last updated on 29 July 2014.
6
www.gov.uk/government/statistics/final-uk-emissions-estimates data tables 3 and 8.
7
Department for Transport, UK Aviation Forecasts, July 2013.
8
See http://ec.europa.eu/clima/policies/transport/aviation/index_en.htm
www.sustainableaviation.co.uk Page 15 of 91Progress Report 2015
4.2.2 Context of UK aviation CO2 emissions
According to UK Government national greenhouse gas statistics, UK domestic & international
aviation accounted for less than 6% of the UK’s total CO2 emissions in 20139
Residential
13%
Industrial
17% Other
Road &
Power generation
Rail transport
32%
19%
Domestic Aviation International Aviation
0.3% 5%
UK CO2 emissions by sector in 2013
Note: Assumes international bunker fuels are included in the UK inventory.
4.2.3 The SA CO2 Road-Map 2012
The first SA CO2 Road-Map, published in December 2008, set out for the first time the UK aviation
industry’s consensus view regarding the future trajectory of its CO2 emissions. The Road-Map
showed that, contrary to the claims being put forward at the time by some, UK aviation CO2 would
not grow to occupy the majority of the UK’s carbon allowance by 2050.
An update was issued in March 2012, taking account of new information and developments, and
showing how fleet efficiency had improved in practice relative to the view put forward in the first
CO2 Road-Map of 200810. From the updated analysis, SA concluded that UK aviation can
“accommodate significant growth to 2050 without a substantial increase in absolute CO2 emissions”.
In that update we also chose to illustrate the scale of contribution that would be required from
market-based-measures if UK aviation was to reduce its net CO2 emissions in 2050 to half of 2005
levels.
9
www.gov.uk/government/statistics/final-uk-emissions-estimates data tables 3 and 8.
10
http://www.sustainableaviation.co.uk/road-maps/
www.sustainableaviation.co.uk Page 16 of 91Progress Report 2015
2012 SA CO2 Road-Map
In both cases, the overall aim was as follows:
To establish a trajectory of demand-growth that CO2 emissions would follow in a
“hypothetical no-improvements” scenario.
To consider categories of CO2 mitigation, providing in each case:
o an overview of the efforts the industry is making and achievements so far
o an estimate or calculation of the extent of mitigation that could be expected in the
future, and over what timescale
To combine the above to produce a view of the likely future trajectory of CO2 emissions from
UK aviation.
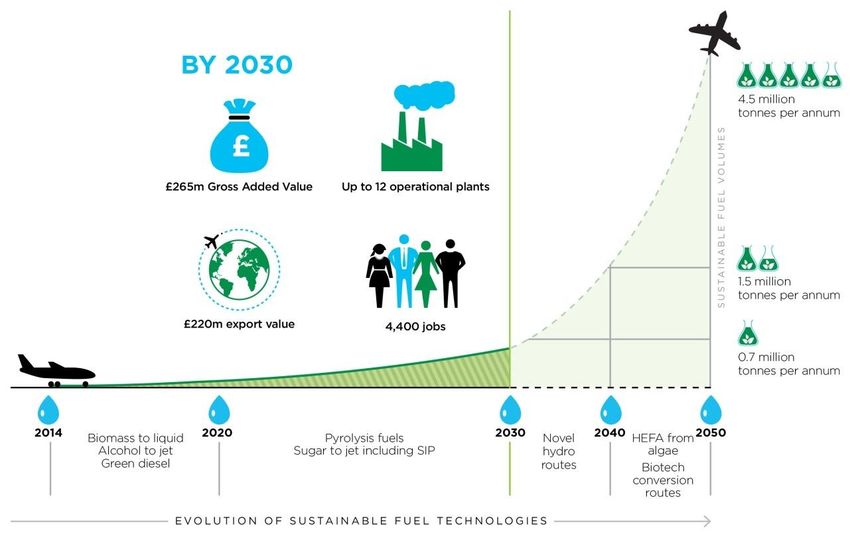
4.2.4 The SA Fuels Road-Map 2014
In 2014 SA worked with an independent organisation to explore the potential for developing
sustainable fuel production for aviation and realising the CO2 reductions set out in the SA CO2 Road-
Map. The result of this work was published as a Sustainable Fuels Road-Map with the independent
research11 indicating that the UK has the potential for between 5 and 12 operational plants
producing sustainable fuels by 2030.
Benefits from adopting the Sustainable Fuels Road-Map:
CO2 emissions from UK aviation cut by up to 24% by 2050
UK Gross Value Added (GVA) of up to £265 million and an export value of £220m in 2030
3,400 direct jobs and a further 1,000 jobs in global exports
A graph showing this was produced and published with the Road-Map in 2014.
11
See http://www.e4tech.com/sustainable_aviation.html8753
www.sustainableaviation.co.uk Page 17 of 91Progress Report 2015
UK Potential for Sustainable Aviation Fuels
(Taken from the SA Sustainable Fuels Road-Map 2014)
SA members are currently pioneering this work and since the Road-Map was published members of
the SA Fuels working group have taken part in the UK Department for Transport’s Transport Energy
Taskforce12. This was a mechanism for stakeholders to help the Government to examine and
formulate options for policy regarding transport energy. Specifically the Task Force were asked to
consider how the EU 2020 greenhouse gas emissions reduction and renewable transport fuel targets
should be reflected in UK policy and determine how low carbon fuels can help reduce greenhouse
gas emissions from UK transport in the period to 2030 and beyond. A final report from the taskforce
was published in March 2015 and is now being considered by the Government.
Case studies from SA organisations working to enable sustainable aviation fuels can be found in
Appendix 2.
4.2.5 Progress in addressing UK aviation CO2 emissions
The rest of this section reviews progress in reducing CO2 emissions. It starts with presentation of
data from SA airlines and how their emissions have changed since SA began in 2005. UK airport
reduction in CO2 emissions follows this. The subsequent sections look in detail at work undertaken
by SA to provide technical reports on aviation carbon work and specific initiatives undertaken to
develop low carbon solutions.
4.2.5.1 SA Airline CO2 Performance
Total CO2 emissions produced by SA airlines in 2014 were 33.3 million tonnes. This is a 9% increase
since 2005. From 2008 onwards however, total emissions have reduced, despite 9% more
12
See http://www.lowcvp.org.uk/projects/transport-energy-task-force.htm
www.sustainableaviation.co.uk Page 18 of 91Progress Report 2015
passengers being carried. This is primarily due to the introduction of new, more fuel efficient,
aircraft.
40
33.16 34.10 33.44 33.32 32.82 33.26
35 32.41 32.08 32.01
30.46
CO2 emissions (million
30
tonnes/year)
25
20
15
10
5
0
2005 2006 2007 2008 2009 2010 2011 2012 2013 2014
Absolute CO2 Emissions from SA airlines
Data derived from aggregated, actual fuel burnt by SA airlines per annum
This performance was delivered as SA airlines carried an additional 21.7 million passengers (19%
increase)13. This result is in line with the projections made in SA’s CO2 Road-Map.
Looking at fuel efficiency per revenue tonne kilometre flown by SA airlines, it can be seen that over
the last 10 years there has been an improving trend in airline fuel efficiency. The chart shows that
nearly a 12% improvement in fuel efficiency has been achieved since 2005. This change reflects the
growing airline fleet replacement programmes, replacing older, less fuel efficient aircraft with newer
ones and on-going aviation industry operational fuel efficiency initiatives.
0.450 0.402 0.401
0.408 0.399 0.369
0.389
0.400 0.372 0.363 0.360 0.354
Fuel Efficiency (Litres/RTK)
0.350
0.300
0.250
0.200 SA airlines have achieved an 11.9% fuel efficiency improvement since 2005
0.150 with an annual fuel efficiency improvement of 1.9% since 2009
0.100
0.050
0.000
2005 2006 2007 2008 2009 2010 2011 2012 2013 2014
SA Airline Fuel Efficiency
Data derived from aggregated, actual fuel burnt and revenue tonne kilometres (RTK) produced by SA airlines
per annum
13
These figures are calculated from the CAA Airline Statistics for SA member airlines. See
http://www.caa.co.uk/default.aspx?catid=80&pagetype=88&pageid=1&sglid=1
www.sustainableaviation.co.uk Page 19 of 91Progress Report 2015
SA airlines have outperformed the airline industry target of a 1.5% average improvement in fuel
efficiency per annum between 2009 and 202014, achieving an improvement of 1.9% per annum
between 2009 and 2014.
To demonstrate this achievement in another way, the next chart shows the CO2 emissions saved per
year, from 2006 onwards. The calculations are derived from actual fuel burn figures achieved each
year since 2005, compared to predictions of fuel burn assuming no improvement from the airline
fuel efficiency performance being achieved in 2005. The result shows that 20 million tonnes of CO2
emissions have been saved through airline fuel efficiency improvement work and investment in
new, more efficient aircraft since 2005.
Change in CO2 emissions (tonnes)
1,000,000
-
2006 2007 2008 2009 2010 2011 2012 2013 2014
-1,000,000
-2,000,000
-3,000,000
-4,000,000
20 million tonnes of CO2 saved by SA Airlines due to
-5,000,000 fuel efficiency improvements since 2005
-6,000,000
SA Airline CO2 Emissions Avoided Per Year
Finally, a further 6 million tonnes of CO2 emissions reductions can be attributed to UK airlines
through the EU emissions trading system (ETS)15 , introduced for flights within Europe from 2012
onwards. The system caps aviation at 95% of its 2005 CO2 emissions. Emissions above this cap must
be traded for reductions in other sectors. The effect of carbon trading is that total net CO2 emissions
from SA airlines in 2014 are only marginally (1.5%) above emissions in 2005.
4.2.5.2 SA Airport CO2 Performance
In 2014 the Airport Operators Association, (AOA), produced a report on sustainable airports16. This
report looked at detail at the work underway in UK airports to reduce their carbon footprints.
Carbon emissions around UK airports arise from a mix of sources. Whilst aircraft emissions
dominate, substantial emissions also arise from vehicles coming to and from the airport plus those
operating at the airport. A further significant source is from emissions generated in heating and
providing power at the airport.
14
See https://www.iata.org/policy/environment/pages/climate-change.aspx
15
See http://ec.europa.eu/clima/policies/transport/aviation/index_en.htm
16
See http://www.aoa.org.uk/wp-content/uploads/2014/09/AOA-Sustainable-Airports-Report.pdf
www.sustainableaviation.co.uk Page 20 of 91Progress Report 2015
These different emission sources are classified as direct, indirect or induced reflecting the airport’s
ability to manage. This is depicted in the next diagram.
Calculating CO2 emissions at UK Airports
A significant number of UK airports also take part in the ACI Europe Airport Carbon Accreditation
scheme which assesses how airports manage and reduce their carbon emissions through four levels
of certification:
1. Mapping – Internal monitoring and reporting of emissions
2. Reduction – Internal target setting to reduce emissions
3. Optimisation – Working with other business partners to report and reduce emissions
4. Neutrality – Combination of the other three levels plus paying for their internal emissions
More information on the scheme can be found here: http://www.airportcarbonaccredited.org/
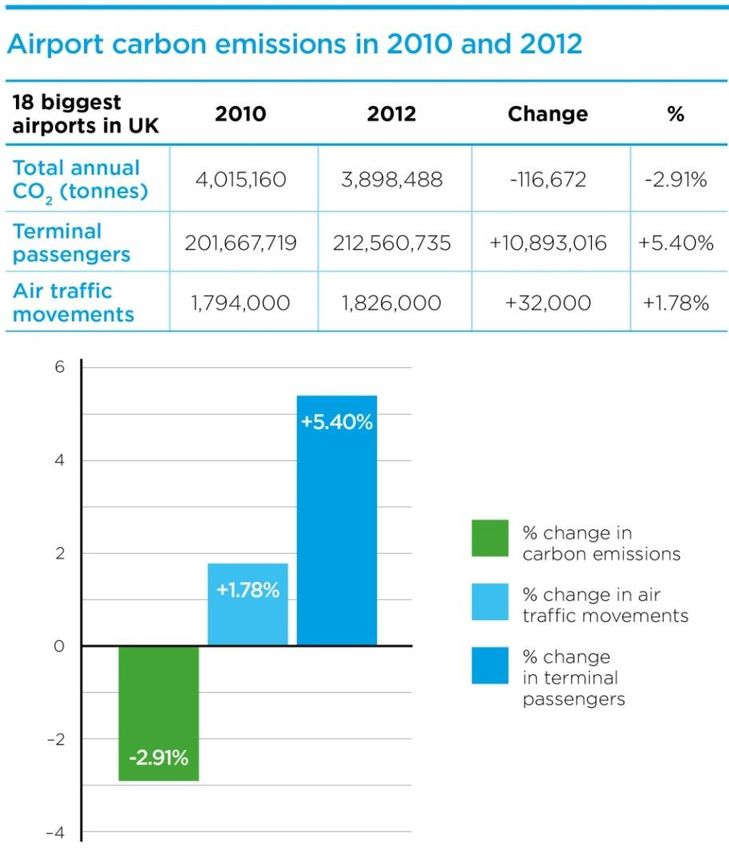
The AOA report shows the result of eighteen UK airports which shared their individual carbon
emission figures for 2010 and for 2012. The total carbon emissions in 2012 were reduced by 2.91%
compared to 2010; at the same time, passengers at the airports increased by 5.4% and their flights
increased by 1.78%. This is depicted in the following diagram.
www.sustainableaviation.co.uk Page 21 of 91Progress Report 2015
Source: AOA Sustainable Airport Report 2014
The AOA report also provides details on specific activities occurring at a range of UK airports that has
led to this overall result from improving energy management to working in partnership with others
to improve surface access to the airports.
4.2.5.3 Developing technical papers to address CO2 emissions
Since publishing the SA strategy in 2005 a number of key documents and information papers have
been produced by SA’s climate change technical working group. A summary of these key pieces of
work are presented below.
Position Paper: Inter-Dependencies between CO2, NOx and Noise
This position paper, published in 2010, described situations in which measures to reduce noise can
increase fuel-burn, and circumstances in which measures to reduce fuel-burn may present
challenges to meeting noise and emissions regulations. We also identified several operational
techniques with the potential to reduce noise, and/or CO2 and other emissions with no trade-offs,
and described progress made so far towards their characterisation or implementation17.
17
http://www.sustainableaviation.co.uk/resources/
www.sustainableaviation.co.uk Page 22 of 91Progress Report 2015
The Airbus A380 is a good example of this. As well as improving the fuel efficiency of this aircraft
compared to the aircraft it is designed to replace, it was also optimised to achieve specific noise
restrictions at Heathrow Airport. Had this not been the case further fuel efficiency gains could have
been achieved. Further details on this issue are covered in the interdependencies paper.
Climate Impacts of Aviation’s Non-CO2 Emissions
Updated in 2014, this SA paper summarises the climate impacts of aviation’s non-CO2 emissions,
taking account of recent developments in scientific understanding. It discusses the mechanisms
through which aviation’s non-CO2 emissions can result in a warming or cooling effect, and where
possible provides an estimate of the scale of the effect18.
Aviation Environmental Research Workshop
In December 2013, SA hosted an aviation environment research event. The purpose of the event
was two-fold:
To hold a joint aviation industry and academic symposium to capture information on the
current range of aviation environment research being carried out in UK universities and;
To explore the future potential for closer links between the UK aviation industry and
academia
Over 100 people attended the event from the UK aviation industry, academia both in the UK and US,
UK Government advisors, aviation regulators and other interested parties and NGOs.
Discussions took place on the emerging concepts for producing sustainable aviation fuels as well as
reviewing the issues arising from, the then emerging, Intergovernmental Panel on Climate Change
(IPCC) 5th Assessment Report19.
Opportunities for Reducing CO2 Emissions from Aircraft on the Ground
While aircraft ground operation CO2 emissions are small relative to air operations they are still
significant and this study showed that there are real opportunities to achieve material reductions.
This programme offered practical guidelines to airports working with partners to cut aircraft ground
movement CO2 emissions and improve local air quality. It captured best practice across the industry
today with potential for greater efficiency improvements in the future20.
4.2.5.4 Operational Initiatives to reduce CO2 emissions
As shown in the SA CO2 Road-Map, there are significant opportunities to reduce CO2 emissions
through improving the efficiency of airspace structures and exploring new ways to operate aircraft.
The results of these efforts are summarised below.
18
http://www.sustainableaviation.co.uk/wp-
content/uploads/2015/09/SustainableAviation__nonCO2_Paper_May_2014.pdf
19
See http://www.ipcc.ch/
20
See http://www.sustainableaviation.co.uk/resources/
www.sustainableaviation.co.uk Page 23 of 91Progress Report 2015
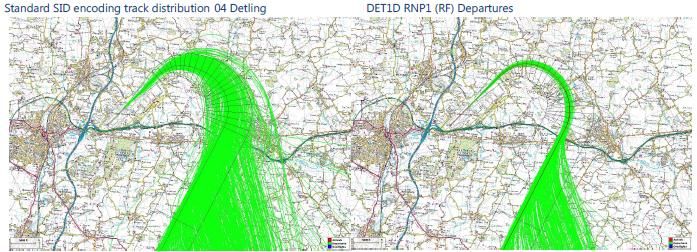
From 2008, 400 procedural airspace changes and more efficient air traffic control have
enabled savings of more than 1 million tonnes CO2
Continuous Descent Operations (CDO) have increased in the UK from an average of 56% of
arrivals in 2006 to 78% in 2015. This has been a long standing area of focus with SA
organisations since the launch of the Arrivals Code of Practice21 in 2006. An SA led campaign
to reinvigorate this low fuel and noise approach was launched22 in 2014. Since then over
45,000 additional CDOs have been achieved. From 2006 to 2015 NATS estimate savings to
be in excess of 6,300 tonnes of fuel and over 20,200 tonnes in CO 2 emissions. The campaign
continues to operate and was recently recognised in the 2015 Business in the Community
annual awards. (See case study for more information).
CASE STUDY: The SA CDO Campaign
The SA Continuous Descent Operations (CDO) Campaign is a great example of cross-industry
collaboration that is delivering tangible benefits for all involved. By keeping aircraft higher for
longer, continuous descents offer triple benefits: reduced noise of up to five decibels below the
approach path, reduced CO2 emissions and reduced fuel costs.
The campaign brings together 7 UK airlines, 22 airports and 15 air traffic approach units to
collectively deliver the improvements. The aim is to achieve a 5% increase in CDOs across the UK,
deliver over 30,000 individual quieter arrivals, and save around 10,000 tonnes CO2.
The UK aviation industry is already delivering CDOs really well in some areas, and is regarded as a
pioneer of this technique, but SA has identified the opportunity to make this consistent across the
country and to begin considering descent profiles from higher altitudes too. Results from the first
year of the campaign: July 2013 to May 2014 versus July 2014 to May 2015:
Being able to measure CDO performance at a national scale is a world first.
Change in absolute number of CDOs across all airlines at 22 participating airports is 45,708
additional CDOs.
Change in absolute number of CDOs across the seven participating SA airlines at 22
participating Airports is 16,506 additional CDOs, of this increase 10,471 were from easyJet.
Percentage change to date across 22 airports and all airlines is a 0.5% increase
Across SA 7 participating airlines the percentage change is a 0.5% improvement
These increases are in the context of traffic growth of c.5%.
Note: 78% CDO achievement across all airlines at 22 UK airports is an exceptional
achievement
Continuous Climb Operations (CCO) This report provides the first update to our baseline
report on CCO performance, and offers a view of change in the climb efficiency of UK flights
between 2010 and 2015. While some flights have had an improvement in the ground to
21
See ‘Noise from Arriving Aircraft – An Industry Code of Practice
http://www.sustainableaviation.co.uk/resources/
22
See http://www.sustainableaviation.co.uk/sustainable-aviations-continuous-descent-operation-campaign/
www.sustainableaviation.co.uk Page 24 of 91Progress Report 2015
25,000 feet (FL0 – FL250) band, the airports may have remained within the same banding.
However departures from all airports have achieved more continuous climbs than in 2010,
offering substantial fuel and emissions savings, estimated by NATS to be in excess of 7,100
tonnes of fuel, over 22,600 tonnes CO2 emissions between 2006 and 2015. The table below
shows the change in percentage of departing flights achieving continuous climb from FL0 to
FL250 between 2010 and 2015 for each airport included in the study.
Airport Difference between 2010 and 2015 2010 Rank 2015 Rank
ABERDEEN +2.18% High High
BELFAST +7.19% High High
BIRMINGHAM +11.73% Medium High
BRISTOL +21.81% Medium High
CARDIFF +1.79% High High
EDINBURGH +3.08% High High
FARNBOROUGH +9.50% Low Low
GATWICK +12.57% Medium Medium
GLASGOW +2.24% High High
HEATHROW +7.75% Medium Medium
LONDON CITY +0.38% Low Low
LUTON +8.71% Medium Medium
MANCHESTER +14.66% High High
SOUTHAMPTON +14.97% Low Medium
STANSTED +6.23% Medium Medium
Perfect Flight (2010 onwards) – In 2010 an optimised British Airways, Heathrow to
Edinburgh flight demonstrated an 11% fuel saving compared to non-optimised flights on the
same route. This demonstrated the opportunity to reduce fuel through removing
inefficiencies with UK airspace structures and taxi congestion at airports. Since then SA
organisations have been working to explore wider potential for this work. Further optimum
flight trials have taken place with details presented in the case studies in Appendix 2.
Departures Code of Practice (2012 onwards) – A series of initiatives were combined into a
best practice guide in 2012 to support more efficient aircraft operations on the ground.
These include concepts such as reduced engine taxi, optimum taxi routes to and from the
runway and use of ground based electrical supplies and pre conditioned air whilst the
aircraft is parked at the airport. (See the Air Quality performance section for more
information).
The Controller-Pilot Environment Forum. (2009) – Since 2009, NATS, through SA brought
together controllers and pilots to discuss environmental performance and understanding.
More information on Forum can be found in SA’s 2011 Progress Report.
www.sustainableaviation.co.uk Page 25 of 91Progress Report 2015
4.2.5.5 Evolution in Airframe and Engine technology
In addition to specific SA work to support CO2 emission reduction, significant aerospace
manufacturing improvements have been achieved over recent years with jet aircraft in service today
using at least 70% less fuel per seat kilometre than the first jets in the 1960s23.
The new aircraft entering UK airline fleets are more fuel efficient than those they replace:
A320neo (new engine option) is up to 15% more efficient than the A320
A350 powered by the new Rolls-Royce Trent XWB engines generates 25% lower CO2
emissions24 compared to aircraft it is designed to replace
A330neo will deliver fuel savings of up to 14% compared to today’s A330
Boeing 787 is more than 20% more efficient than the Boeing 767
Boeing 737 MAX – 14% reduction in CO2 emissions compared to the Boeing 737 NG
Case studies detailing the latest aircraft and engine innovations are presented in Appendix 2.
4.2.5.6 Upgrading Airline Fleets
Over the past 10 years, SA member airlines have retired older aircraft types and replaced them with
current and/or next-generation aircraft types, as the following charts show, enabling a progressively
greater proportion of aviation activity to use quieter, more fuel-efficient aircraft. Specifically, since
2005, UK airlines have introduced more than 470 new aircraft into service representing an
investment of over $49.6Bn at 2014 prices25.
Over the next ten years we can expect “imminent”26 aircraft types to occupy a steadily increasing
share of total aircraft operations and to account for a greater proportion of available seat
kilometres. As at March 2015, SA airlines had outstanding orders for 359 aircraft worth $53Bn at
today’s prices, to replace aircraft in their existing fleets. World-wide, Airbus and Boeing have future
orders for over 12,000 new aircraft.
23
www.atag.org/facts-and-figures.html, last accessed on 29 July 2014
24
See http://www.airbus.com/aircraftfamilies/passengeraircraft/a350xwbfamily/
25
Derived from Airbus and Boeing websites; aircraft delivery and order details
26
In the context of our CO2 Road-Map, “imminent” aircraft types are the Boeing 737 MAX, Airbus A320neo family ,
Bombardier C Series, Boeing 787, Airbus A350XWB, Boeing 747-8, and Airbus A380
www.sustainableaviation.co.uk Page 26 of 91Progress Report 2015
Figure 1 – Proportion of aircraft departures by SA airlines from UK airports, by aircraft vintage.
Scope: scheduled passenger flights. Source: Rolls-Royce analysis of data from OAG
Figure 2 – Proportion of available seat kilometres (ASKs) delivered by SA airlines on flights which
depart from UK airports, by aircraft vintage.
Scope: scheduled passenger flights. Source: Rolls-Royce analysis of data from OAG
www.sustainableaviation.co.uk Page 27 of 91Progress Report 2015
4.2.5.7 Airline Fuel Efficiency Programmes
Over the last 10 years the airlines have worked on a number of fuel efficiency programmes. These
programmes focus on a range of initiatives to reduce fuel burn such as:
Setting specific fuel efficiency targets for pilots, operations and engineering staff
Reducing on board aircraft weight
Improving aircraft airframes and systems to minimise fuel burn
Optimising aircraft climb, cruise and descent flight profiles
Working with others to improve airspace routings
These efforts have reaped considerable savings in fuel burn and CO2 emissions. Case studies for
some of these are provided in Appendix 2.
4.2.5.8 Supporting Development of Sustainable Aviation Fuels
Sustainable fuels derive from both biogenic and waste sources and have a lower carbon footprint
than fossil fuels. We are not referring to fuels generated from unsustainable first generation crops;
our focus is on second generation advanced biofuels which do not cause Indirect Land Use Change27
and deliver high CO2 savings.
Fuels progress report 2010
SA produced a report which explored development of sustainable fuels for aviation. It was prepared
following the publication of the 2008 SA CO2 Road-Map with an aim to clarify current developments
on this issue and detail activities being under taken by some SA members28.
Sustainable Fuel flights
Since 2005 a number of SA airlines and manufacturers undertook flights using sustainable fuels,
many of which used fuels cleared through the ASTM standards process for technical suitability.
These flights were designed to test the effect of using the sustainable fuel in normal operations and
assess any modifications that may be required to the fuel characteristics as well as aircraft fuel
systems and engines. Details of these flights were provided in preceding SA Progress Reports.
The Sustainable Use of Renewable Fuels (SURF) consortium
This was formed in autumn 2010 by a group of SA signatories, which included Airbus, British Airways
and Rolls-Royce, with Cranfield University. Its purpose is to address major considerations for the
successful use of fuels from a renewable source like microalgae. Source: SA third progress report
27
Leads to additional pressure on agricultural land leading to induced land use change, e.g. deforestation and
an increase in overall carbon dioxide emissions.
28
See http://www.sustainableaviation.co.uk/resources/
www.sustainableaviation.co.uk Page 28 of 91You can also read