Systems Neuroscience 2021 - Adult Plasticity after Injury
←
→
Page content transcription
If your browser does not render page correctly, please read the page content below
Systems Neuroscience 2021
                          Adult Plasticity after Injury

•Plasticity during early development: ferret “re-wired”
•Somatosensory cortex: Plasticity after peripheral nerve crush/transection, spinal cord, or VB
            thalamic injury
• Motor cortex: Plasticity after ischemic stroke model; “stroke rehabilitation”
• Visual cortex: Is there topographic plasticity following experimental retinal injury?
• Species differences?
• Is there evidence for topographic plasticity following human macula degeneration, artificial
            scotoma, or scotopic vision?.
• Human cortical plasticity fMRI: ‘natural experiments’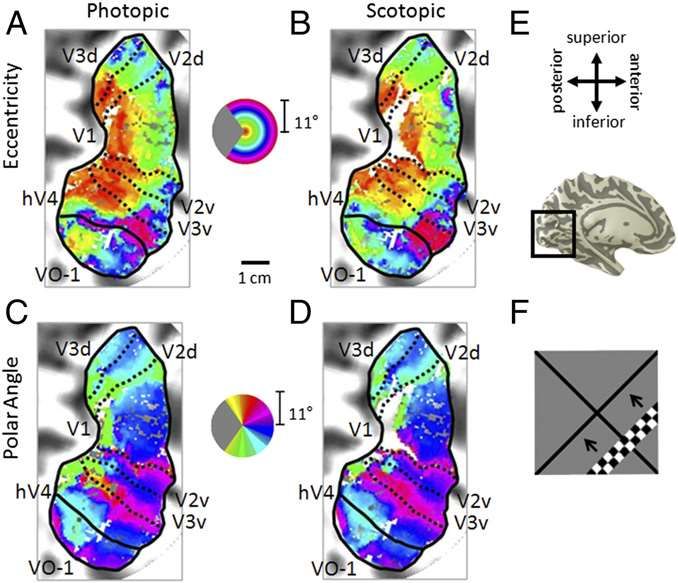
Plasticity after Perinatal to Adult Injury:

• Experimental Models
  Re-wired ferrets
  Intro to: Peripheral nerve, spinal cord, thalamic, or cortical injury
  models
  Somatic-sensory plasticity: spinal cord and thalamic injury
  Motor cortex plasticity: stroke and training
  Topographic plasticity following retinal injury cats, mice, monkey,
  man. Methods and mechanisms
  Unilateral cortical damage and human map plasticity
• Early Human Damage (not shown)
  Ischemia, periventricular stroke, infections, teratogens, congenital
        blindness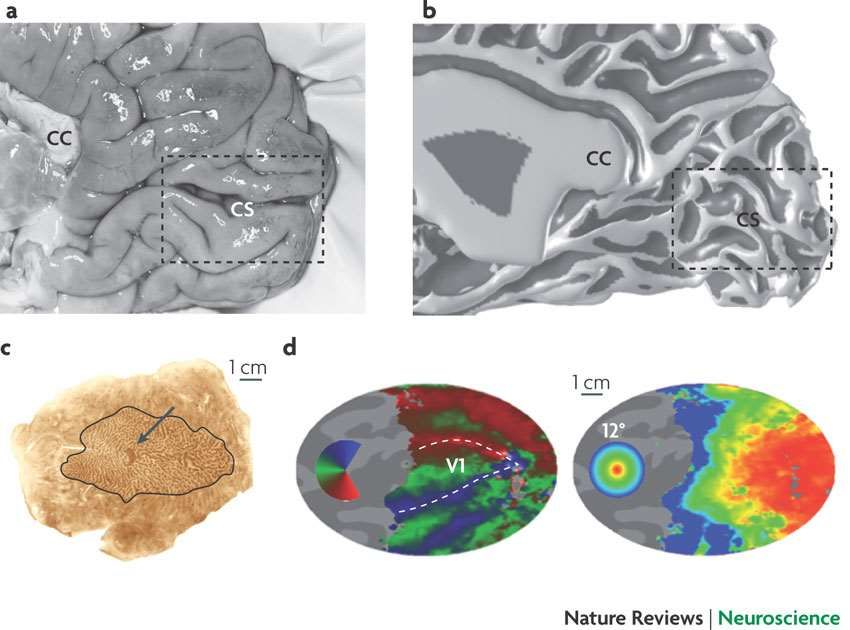
‘Re-wired’ Ferret: Sur and colleagues. Ferrets are born very altricial
and thus provide a unique opportunity to examine perinatal cortical plasticity.

What makes V1 ‘visual’ cortex?
Ferret Visual Cortex Development: Specificity

‘Re-wired’ Ferret:
Sur and colleagues:
Ferrets are born very
altricial and thus
provide a unique
opportunity to
examine perinatal
cortical plasticity.
Ferret Visual Cortex Development: thalamo-cortical pathways
Unilateral deafening of pup combined with unilateral lesion of LGN.

Consequence: Retinal afferents ‘find’ vacant MGN and then synapse.
MGN neurons follow normal developmental process to innervate primary auditory
cortex, AI.

Ferret ‘Re-wired’ Visual Cortex Development

AI becomes visual cortex. A quasi-topographic map is formed, neurons develop near normal
orientation selectivity, and ferrets can use this cortex to make visual discriminations.
Re-wired AI develops clustered horizontal connections like normal V1.
von Melchner*, Pallas* & Sur. Nature, 404: 2000.

•   The behavioural role of retinal projections routed to the auditory pathway. a, Pathway from the retina
    to the visual thalamus, including LGN and the lateral posterior nucleus (LP), and to the superior colliculus
    (SC) in the control hemisphere (right); and to the LGN/LP and medial geniculate nucleus (MGN) in the
    rewired hemisphere (left).
•   The SC and adjacent brachium (b) of the inferior colliculus (IC) were ablated neonatally in the left
    hemisphere.
•   b, Apparatus for experiment 1. Dashed lines denote the borders of the left and right monocular fields and
    the direction of central gaze.
•   Animals were rewarded at the right spout after a light in the left monocular field, and at the left spout after
    a sound from a central speaker.
•   Subsequently, their responses to light in the centre or the right monocular field were tested. Animals
    initiated trials by standing in the start box with their muzzle between an infrared LED and a photodiode
    detector.
Adult Cortical Plasticity

~20 years ago, adult cortex was viewed as static, containing sensory (and
   motor) maps determined by pre-natal and early post-natal
   development/experience.
Early experiments reinforced the idea of critical periods for cortical
   development and plasticity after which the resultant cortical maps were
   largely immutable.
Since then, multiple lines of research have demonstrated a remarkable
   capacity for cortical reorganization following peripheral nerve injury, focal
   cortical or retinal lesions, as well as resulting from behavioral training
   (perceptual learning).

Somatosensory cortical plasticity after nerve injury (transection or crush) :
   Merzenich, Kaas, and others.
Somatosensory plasticity following spinal cord transection: Kaas and others
Somatosensory cortical plasticity as a result of training: Merzenick et al
Motor cortex plasticity following experimental stroke: Nudo and others
Visual cortex plasticity after eye damage/removal: Chino, Wandell, Gilbert,
   Kaas, and others
Review:
Somatosensory Ascending Pathways
Area 3b map re-organization   Area 3b map re-organization after
   after digit amputation               VPL lesion
Long-term re-organization of Somatosensory Thalamus
Thalamic and/or Cortical Re-organization?
Possible Mechanisms Underlying Cortical Plasticity after Injury

 •   Growth factors
 •   Extracellular matrix
 •   Neurotransmitters
 •   Axonal sprouting
 •   Synaptogenesis
 •   Unmasking of ‘overlapping’ inputs
 •   Growth of new pathways?
 •   Adult neurogenesis?
 •   ???
Location of area 3b in a macaque     A photomicrograph showing a fluorescent electrode track
monkey brain (left) and outline of   in a section of the cortex cut tangentially to the surface
the somatotopy (right) in area 3b.   through area 3b of monkey MCh73.

                                     Jain N et al. J. Neurosci. 2008;28:11042-11060
A–C , Coronal sections of the thalamus through the VP nucleus of monkey MCh75 ( A , B )
and MCh21 ( C ) showing electrolytic lesions (arrows) made to help align microelectrode
recording results with histological features revealed in sections
Jain N et al. J. Neurosci. 2008;28:11042-11060
©2008 by Society for NeuroscienceSomatotopy in left area 3b and the adjacent area 1 in monkey MCh75.
Jain N et al. J. Neurosci. 2008;28:11042-11060
Black circles indicate sites with response to light cutaneous touch on the skin, dotted circles with
responses to hairs, open circles with responses to taps. Larger circles indicate better responses
and smaller circles weaker responses. Triangles mark the sites with weak responses to hard taps,
making it difficult to define the receptive field with certainty. Multiple dots indicate sites with multiple
or split receptive fields. The crosses mark the sites where neurons did not respond to any
stimulation. Stars mark the sites where electrolytic lesions were made. D, Dorsal; M, medial; C,
caudal.Photomicrograph of a section of the
flattened cortex of monkey MCh75
stained for myelin. The myelin-light
septum (arrow) marking the hand–
face border is clearly visible. Left
and right dotted lines respectively
mark the fundus and the lip of the Locations of all the receptive fields on the face that
posterior bank of the central were recorded for neurons in the reorganized
sulcus. R, Rostral; M, medial. Scale cortex medial to the normal hand–face border in
bar, 2 mm. monkey MCh75 (Fig. 4 A).
Jain N et al. J. Neurosci. 2008;28:11042-11060
©2008 by Society for NeuroscienceNote that at many sites the receptive fields split with responses elicited by touch on the
hand/arm as well as chin.
The receptive fields on the hand are large, often extending over multiple digits, unlike
those in normal animals.
Jain N et al. J. Neurosci. 2008;28:11042-11060
©2008 by Society for NeuroscienceSomatotopy in area 3b of monkey MAc19
before and immediately after lesion of
the dorsal columns. A , Cytochrome
oxidase-stained section of the flattened
cortex through area 3b showing electrolytic
microlesions made during the experiment
(arrows and double arrow) and some visible
electrode tracks (arrowheads). B , A myelin-
stained section of the flattened cortex
showing the hand–face border (white
arrow) and the border between D1 and D2
(blue arrowhead).
C , Locations of neurons with receptive
fields on the face, hand and arm
encountered in area 3b and the adjacent
cortex before lesion of the dorsal
columns of the spinal cord, and
(D) Immediately after lesion of the
contralateral dorsal columns of the spinal
cord. Only a few neurons responded to the
taps on the hand or arm perhaps because
of sparing of some of the dorsal column
fibers.
Jain N et al. J. Neurosci. 2008;28:11042-11060
©2008 by Society for NeuroscienceMethods for longitudinal fMRI and cross-model imaging alignment
Methods for longitudinal fMRI and cross-model imaging alignment. A, The placement of the top most (red box) of the
four oblique image slices, which covers the cortical region around the central sulcus (CS), is shown on coronal image. B, Field
of view of the top oblique image slice is indicated by the red box placed on top of the schematic illustration of the functional
organization of somatosensory areas (areas 3a, 3b, and 1) around the CS. LS, Lateral sulcus; STS, superior temporal sulcus.
C, D, T2-weighted structural MRI images obtained from two separate imaging sessions. CS and LS (green lines),
surface and trans-cortical veins (black lines and dots) were used as landmarks (red and green arrows) for image
alignment.
E, Corresponding blood vessel map of the image field of view obtained from the same animal. Corresponding alignment
landmarks are also shown. This blood vessel map was used for both optical imaging (OIS) and electrophysiology
experiments. a, Anterior; l, lateral; m, medial; p, posterior.
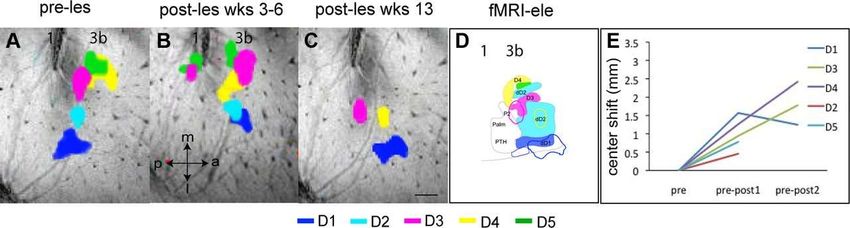
©2012 by Society for Neuroscience Chen L M et al. J. Neurosci. 2012;32:14649-14663Longitudinal fMRI mapping of digit activations to tactile stimulus before and after unilateral partial dorsal
column lesion in monkey SM-O. A–F, fMRI activations of the individual digits D1–D5 in response to tactile
stimulation before the lesion and a color-coded composite map of all five digit activations . Dotted line in F
indicates the approximate border between area 3b and area 1. G–L, fMRI activations of the individual digits D1–
D5 and a composite map of all five digits at 4 weeks after lesion. M–R, fMRI activations at 8 weeks after lesion.
S, Plot of activation center shifts (in millimeters) of each digit as a function of time after lesion.
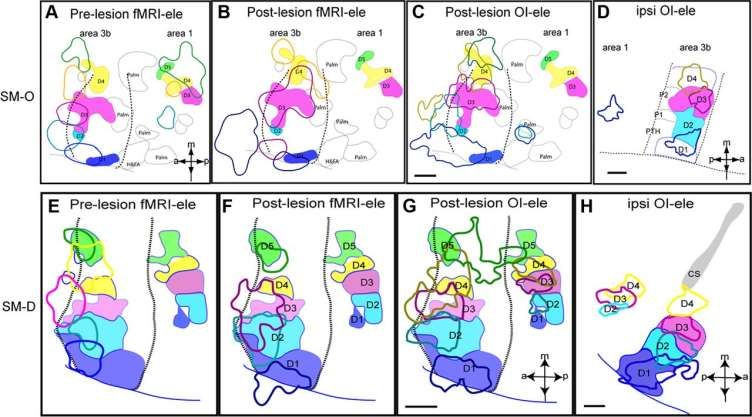
Chen L M et al. J. Neurosci. 2012;32:14649-14663Spatial correspondence of fMRI, OI, and electrophysiology maps of digit activation after dorsal
column lesion in contralateral and ipsilateral areas 3b and 1 in monkeys SM-O and SM-D.
A, E, Overlay of pre-lesion fMRI and post-lesion electrophysiology maps of digits.
Color outlines indicate location and size of fMRI activations, whereas
Color patches present location and size of neuronal responses.
B, F, Spatial comparison of post-lesion fMRI and post-lesion electrophysiology digit maps.
C, G, Spatial comparison of post-lesion OI and post-lesion electrophysiology digit maps.
D, H, Overlay of electrophysiology maps of digits D1–D4 in the ipsilateral area 3b and area 1 of the
same animals
Chen L M et al. J. Neurosci. 2012;32:14649-14663Chen L M et al. J. Neurosci. 2012;32:14649-14663 Longitudinal fMRI mapping of digit activations to tactile stimulus before and after unilateral partial dorsal column lesion in monkey SM-C. Longitudinal fMRI mapping of digit activations to tactile stimulus before and after unilateral partial dorsal column lesion in monkey SM-R.
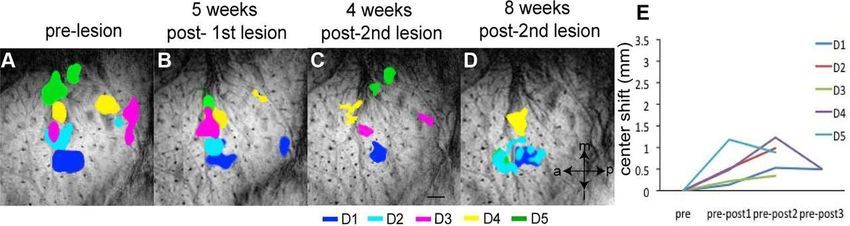
Figure 6. Summary of differences before and after
incomplete DCLs for different measures reflecting
plasticity.

(A) Representative neuronal activities indicate decreased
    responsiveness shortly after lesion and recovery to near-
    normal levels over time.

(B) Schematics of area 3b depict cortical inactivation
immediately after the lesion deprives the cortex of normal
driving activity. The extent of cortical reactivation can vary;
when the lesion is incomplete responsiveness can return,
but may be weaker (light shading). Representations may
also show abnormal organization (multicolored hatching).

(C) Graphics of the movement to reach depict impairment of
performance on the reach-to-grasp task shortly after lesion
and recovery of performance over time

(D) Drawings of coronal sections of cervical spinal cord before
and after lesion (black) depict lack of spontaneous
improvement of the lesion over several weeks.

(E) Simplified schematic summarizes differences in measures
relative to normal over time before and after incomplete lesion.
The spinal cord does not heal structurally after a DC lesion
(red); however, functional improvements indicate plasticity
outside of the DCs underlies recovery to near-normal
levels several weeks after incomplete DCL.
Mechanisms of Adult Motor Cortex Plasticity
Mechanisms of Adult Motor Cortex Plasticity

Focal infarct in M1 cortex produces a immediate loss of (hand) representation and
subsequent shrinkage of adjacent hand representations.
Restraining of the ‘good’ hand prevented the loss of hand movement representation
surrounding infarct.
The ‘lost’ hand movement representation also expanded into the adjacent cortex,
previously represented movements of the elbow and shoulder.
Rehabilitation training also resulted in expansion of supplemental motor field
representations. (new cortical connections also revealed). R. Nudo et al.
Adult Motor Cortex Plasticity:
         Nudo et al.
Map plasticity with training Representation of distal forelimb representations in motor cortex after digit skill training as defined by intracortical microstimulation. Digit areas(red) expand after only 12days of training. Combination movements that reflect the individual kinematics that the monkey employs also expand their representations. (A) Pre-training map. (B) Post-training map. (C) Still images of squirrel monkey retrieving food pellets from small wells (Nudo etal.,1996a)
Differential effects of skill vs. use.
(A) ICMS-derived motor map (digit, red; wrist, green; elbow/shoulder, light blue) of a rat that learned a
skilled reaching movement.
(B) ICMS-derived motor map of a rat that learned to press a bar. The two forelimb areas are outlined in
white. The caudal forelimb area (CFA) is separated from the rostral forelimb area(RFA) by a band of
head/neck representations (yellow). The hindlimb area(HLA) is shown in dark blue and nonresponsive sites
in gray.
(C) Note the enlarged digit and wrist/forearm representations in the skilled reaching condition
(SRC),and enlarged shoulder representation in the unskilled reaching condition(URC, bar press).
(Kleim etal., 2002a).
Functional map changes in forelimb (sFL) and hindlimb (sHL) somatosensory cortex after a focal
infarct in mouse. Thalamic projections (arrows) and intracortical connections (double arrows) are also shown.
(A) Normal somatosensory representation of sFL and sHL.
(B) Within hours after focal infarct (gray),yellow areas show reduced sensory specificity, responding to both
FL and HL stimulation.
(C) Over the ensuing weeks, growth-promoting processes are triggered. Local axonal sprouting (double-
headed arrows), dendritic spine expansion, and synaptogenesis occurs in the peri-infarct cortex.
(D) Several weeks after stroke, specificity in sensory responses returns. Neurons that were formerly
responsive to stimulation of hindlimb become responsive to forelimb stimulation (Murphy and
Corbett,2009).
Rewiring of corticocortical connections after ischemic infarct. (A) In normal healthy squirrel monkeys, the
primary motor cortex (M1) has dense reciprocal connections with both the premotor cortex (PMv, PMd, SMA) as
well as the primary somatosensory cortex (S1) and the second somatosensory area(S2).
(B) In addition to M1,the ventral premotor cortex (PMv) has dense connections with a rostral area called pre-
PMv. PMv has moderate connections with S2, but negligible connections with S1.
(C) Several weeks after an ischemic infarct in M1, axons originating in PMv can be seen making sharp bends
and avoiding the infarct area,
(D) A low-magnification plot of axons within the section show that the axons originating from PMv course around
the central sulcus. Substantial terminal bouton labeling (not shown) appears in S1(areas 1 and 2). The blue
line in (B) signifies the de novo pathway that forms after the lesion (Dancause etal.,2005)
Adult Visual Cortex Plasticity
Since somatosensory cortex can undergo large-scale topographic
   plasticity, is this a general feature of sensory cortex?

Mixed results:
Small, corresponding binocular retinal lesions in adults generally fail to reveal shifts of
   topographic maps into deafferented cortex. (cat, monkey, and human).
Unilateral enucleation combined with unilateral retinal lesions can reveal ‘filling-in’ of
   deafferented cortical field. (cat)

Conclusions:
1. Species differences
2. Lesion differences
3. V1 may be unique in that binocular correspondence rules may limit the extent to
   which thalamocortical arbors and/or horizontal excitatory connections may spread
   into deafferented cortex
4. Recording methods/ anesthesia differences
Overview of hierarchy of plastic re-organization with retinal injury
(Darian-Smith and Gilbert 1995)
Cortical not sub-cortical re-organization!
    Re-organization both within LPZ (3-8)
    And immediately outside of the LPZ (1,2)

                                               A1. Prelesion RFs medial wall recording
                                               A2. Immediate postlesion; 7.5 mm silent zone
                                               A3. 3 months later; recording sites within the scatoma
                                                    became responsive to positions immediately outside
                                                    Note bunched up at LPZ and increased RF size

                                                 B1. LGN recording after V1 reorganization.
                                                     Dark circles are unresponsive LGN
                                                 B2. Normal topography outside of LPZ
                                                      No reorganization in LGN, no altered Rfmap,
                                                      No increase RF size at border of LPZ.
Lack of LGN re-organization, but emergence of cortical responses,
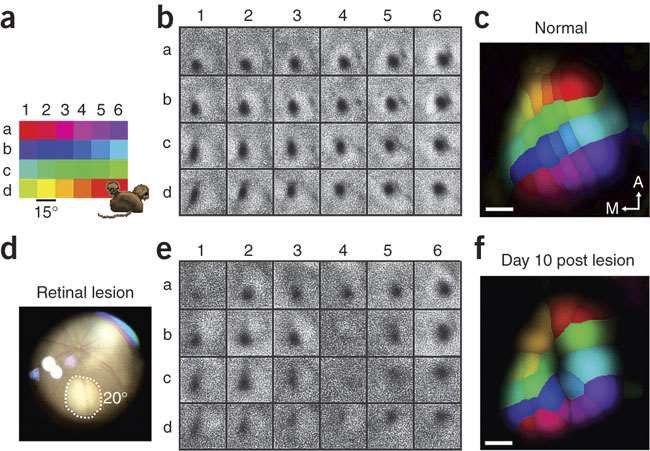
in deafferented cortexKeck et al, 2008 Intrinsic-signal imaging of the LPZ in mouse visual cortex after focal retinal lesions. (a) Layout of drifting grating stimuli (6 4 grid design subtending 90 60 degrees of visual space) used for mapping responses in the visual cortex. (b) Individual activity maps showing responses (dark patches) to moving gratings at different stimulus positions corresponding to the layout in panel a
Intrinsic imaging of functional recovery in mouse visual cortex after focal retinal lesions.
(a–d) Repeated retinotopic mapping in two mice (a,c) on different days after induction of a focal
retinal lesion on day 0.
Cortical regions that were initially unresponsive to visual stimulation (white outline)
progressively regained responsiveness. Note that the animal presented in a was mapped
with a 7 x3 stimulus grid.
Structural reorganization in the visual cortex following retinal lesions. (a) Time line (b)
Apical dendritic stretch of a layer 5 pyramidal neuron from a mouse with a small retinal lesion
imaged repeatedly over more than 2 months. Arrows point to positions of new (gray),
disappearing (yellow) and stable spines (cyan). Filled and open arrows indicate present and
absent spines, respectively. Scale bar represents 5 mm.

(c) Spine turnover rate for different groups of mice. Note the strong and transient
increase in spine turnover rate for cells located in the center of the LPZ (center of LPZ,
early and middle time points compared with control,
Increased spine dynamics reflect functional reorganization. (a) Absence of visually evoked
responses in the visual cortex of a mouse with complete binocular retinal lesions. Scale bar
represents 300 mm.

(b) Apical dendritic stretch of a layer 5 pyramidal neuron from a mouse with a complete retinal
lesion imaged repeatedly over more than 2 months. Arrows indicate positions of new (gray),
disappearing (yellow) and stable spines (cyan). Filled and open arrows indicate present and
absent spines, respectively.
Number of new persistent spines increases with functional recovery

(a) Examples of layer 5 cell apical dendritic stretches with newly appearing persistent spines.
Cyan arrows indicate stable spines and gray arrows indicate new persistent spines. Scale bars
represent 2 mm.
(b) The number of new persistent spines as a fraction of spines initially present:
Rapid Axonal Sprouting and Pruning Accompany Functional Reorganization
in Primary Visual Cortex
Homare Yamahachi,1 Sally A. Marik,1 Justin N.J. McManus,1 Winfried Denk,2 and Charles D. Gilbert1,*
1The Rockefeller University, New York, NY 10065, USA
2Max Planck Institute for Medical Research, Heidelberg, Germany
*Correspondence: gilbert@rockefeller.edu
Axonal Dynamics in LPZ
(A) Axonal tracing of Z stacks through 200 um. Gray, axon segments that remained unchanged
compared to the previous time point; yellow, segments that were added; red, segments
eliminated. Last panel shows the axons present at the end of the imaging session.
(B) Axon density (axonal length per unit of volume) for axons that had been added (yellow),
pruned (red), and remained unchanged (gray) since the preceding imaging section. The total
axonal density is shown in black.
(C) Axonal survival fraction. Axonal length still present from the initial axonal population (7 days)
as a fraction of the total initial length.
Dynamics and specificity of cortical map reorganization after retinal
lesions Dimitrios et al. 2006

Retinal lesions, RF topography, and
single cell responses 4 weeks after
lesion.
(A) Fundus photographs of the left and
right eyes of a cat with homonymous
photo-coagulator lesions of 10°
diameter centered to the area centralis
in both eyes.

(B) Tangential recordings along the
medial bank and sample recording sites
(1–12) 4 weeks after lesion. Dashed
lines indicate the borders of the LPZ as
determined for 10°-diameter lesions
with zif268 in situ hybridization

                            C) RF map of units recorded from B. Retinal lesion is shown in gray. Units
                            recorded in the LPZ have ectopic RFs at the retinal lesion border.(mostly
                            tuned)

                            (D) Polar diagrams and post stimulus time histograms for selected units (stimulus
                            onset at 500 ms). Is, impulses/s.
RF positions and recording probability in control and lesioned animals. (A) Eccentricity of RF positions in the visual field from one control animal (black diamonds) and all experimental animals at 2 (blue square), 4 (green triangle), and 12 (red circle) weeks, and 1 year (magenta triangle) plotted in dependence of recording distance along the medial bank. The intersection between the regression lines indicates the border between LPZ and normal cortex. (B) The probability of recording spiking cells from positions separated by 150–300 m within each 1 mm along the medial bank is shown for control, the 2-, 4-, and 12-week, and 1-year animals. All symbols and colors are as in A.
Fig. 3. Maintained and evoked activity in the LPZ at different recovery times. (A) Maintained activity in
different zones of the LPZ. C, deafferented center; P, activity peak; B, border region; S, surround. Controls
recorded at corresponding eccentricities and results from different survival times are shown. Asterisks indicate
significant deviations from the normal surround (P0.05). Is, impulses/s.

(B) Normalized maintained activity as a function of increasing recording distance along the medial bank A peak
of maintained activity is found progressively inside the LPZ at 2 and 4 weeks.
Fig. 4. Degree and limits of RF width and orientation tuning recovery.

(A) RF widths from all recovery periods compared with normal RF widths recorded at
corresponding eccentricities in control animals. Statistically significant differences at the 5% level
are indicated by *; indicates significant differences of RFs in the LPZ from those in the normal
surround at each given survival time (color coding is as in Figs. 2 and 3). Error bars are SEM.

(B) Orientation tuning half-width with increasing recording distance along the medial bank and
eccentricity in the visual field.
Macaque V1 plasticity after retinal injury: Smirnakis et al
Figure 1 | Homonymous retinal lesions.
a, Left, picture of the right eye
fundus 1–2 h after photocoagulation. Right, right eye cup after
extraction and fixation. The lesion (white arrowhead) is scarred and
hyperpigmented.
b, Top, H&E stain through the right eye lesion. Note the complete
destruction of the photoreceptor layer, as well as the nearly
complete obliteration of ganglion and inner nuclear cell layers.
c, Left, picture of the left eye fundus 1–2 h after photocoagulation.
Right, overlay of the right and left fundi. Lesions are marked by
white arrowheads. The left retina (smaller square overlay) was mirrored
along the vertical axis and scaled to make the optic nerves overlap.
This results in a partly homonymous left visual field scotoma.
d, Eyes were stimulated separately with the full-field checkerboard
stimulus (see Methods) and activation maps (voxels with P , 0.05,
uncorrected, cluster criterion 6) were overlaid on the right operculum of
monkey O97 by using Brain Voyager.
Areas are coloured as follows: yellow, activation through the right eye;
red, activation through the left eye; orange, activation map overlap;
blue, no visual modulation through either eye.
The dotted line marks the segment of the right-eye-LPZ border,
where reorganization is expected to be maximal. This is the part of
the right-eye-LPZ border that also belongs to the border of the
binocular LPZ. The yellow region abutting the LPZ is the projection
zone of the sliver of normal retina marked with the black arrowhead in
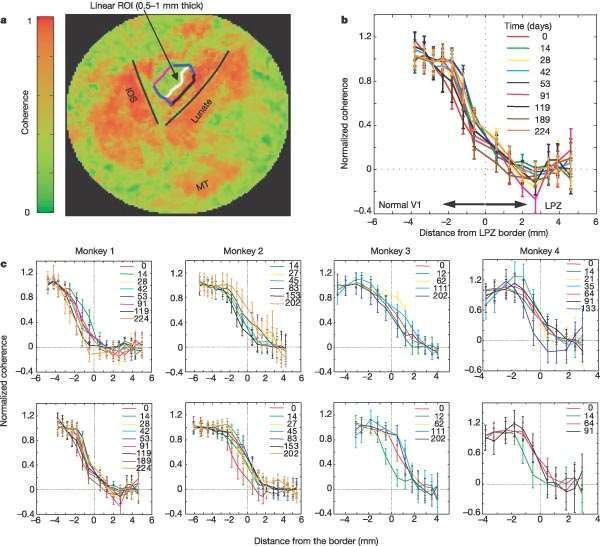
(c, right).BOLD signal inside the LPZ remains at noise level and LPZ size does not change as a function of time after lesioning. a, Coherence map on the right operculum measured with the expanding-ring stimulus E02 4 months after lesioning. The green area is the LPZ, a zone of low coherence surrounded by normal cortex. Note that noise level coherence is expected to be 0.28 and not zero. b, A cortical area of radius 3 cm centered near the fovea was flattened and the coherence map was overlaid. Regions of low coherence outside the operculum correspond to non-visual cortex or visual cortex too eccentric to be activated by our stimuli. LPZ borders are shown at 0 days (LPZ0, black), 4 months (LPZ4, cyan) and 7.5 months (LPZ7, blue) after lesioning.
c, Percentage modulation of the BOLD signal as a function of stimulus cycles. d, Average signal
modulation per stimulus cycle (11 rings). e, Signal amplitude as a function of temporal frequency.
Red marks the frequency of the visual stimulus. Note that the signal amplitude at the stimulus
frequency does not differ significantly from the amplitude of noise present at other frequencies (P
. 0.05). There is no significant stimulus-driven modulation inside the LPZ0 even 7.5 months
after lesioning.
f–h, Plots corresponding to c–e for a region of normal V1 cortex at similar eccentricity to that
of the LPZ. Strong visual modulation is evident in all plots. IOS, inferior occipital sulcus; MT,
middle temporal area. Error bars represent s.e.m.
The profile of BOLD coherence across
the LPZ border does not change as a
function of time after lesioning.

a, Flattened map of the right operculum of
macaque E02 with coherence map
overlaid,. A set of linear ROIs 0.5–1.0-mm
thick, parallel to the LPZ border, was
selected to span several mm on each side
of the border. The white line represents
the first ROI located inside the scotoma.
ROIs are selected once on the anatomical
scan and provide an absolute, time-
invariant, reference frame.

b, Monkey E02, full-field stimulation. The mean coherence of each linear ROI is plotted against
the mean distance of that ROI’s voxels from the line of zero displacement (represented by the
dotted lines at point zero.
c, Equivalent plots to those in b for each monkey (from left to right: E02, A01, O97 and E01). Top
row, retinotopic stimulation paradigm; bottom row, full-field stimulation paradigm. Error bars
represent s.e.m. There is no consistent shift in position or change in slope of the
coherence–distance curve over time (see also Supplementary Fig. 2). The position of the
LPZ border is stable to within 1 mm. IOS, inferior occipital sulcus; MT, middle temporal area.
Figure 4 | Receptive field maps cannot be obtained and steady-state neural responses
remain abnormal inside the LPZ. a, Coherence map overlaid on the flattened right operculum of
monkey E02. Each linear trajectory (white, yellow and blue) represents 16 electrode locations
from 1of 3 experiments. Electrodes were 1mm apart, starting near the lunate (electrode 1). Black
arrowheads mark the last position yielding a multi-unit RF. Blue, yellow and white
arrowheads mark the last position whose steady-state multi-unit activity was modulated more than
10% by the full-field stimulus.
b, Multi-unit RF maps: RFs could not be mapped with spatially restricted stimuli beyond
electrode 1 (experiment 1, data not shown), 7 (experiment 2) and 8 (experiment 3). RF location is
accurate to 1–28 because of slow eye drifts.
c, Multi-unit firing rate histograms averaging 48 cycles of full-field vs. uniform visual stimulation
Multi-unit activity at steady state is higher during stimulation for electrodes 2–10 (outside the
LPZ), but not for electrodes 11–16 (inside the LPZ). Electrode 10 falls on the BOLD-defined LPZ
border.
Brief ON and OFF firing transients persist inside the LPZ (11–16). These may arise through
extra-classical receptive field? Transients arising in electrodes with good RF maps (electrodes
2–8) had a mean latency of 68 ^ 4ms compared with 93 ^ 16 ms for electrodes near or inside
the LPZ border (electrodes 9–16). d, Steady-state firing rate (blue) and coherence (red)
modulation curves as a function of distance from the LPZ border. Inside the LPZ the average
event-rate modulation strength was 1.3%, with 95% confidence limits from 22.7 to 5.3%.
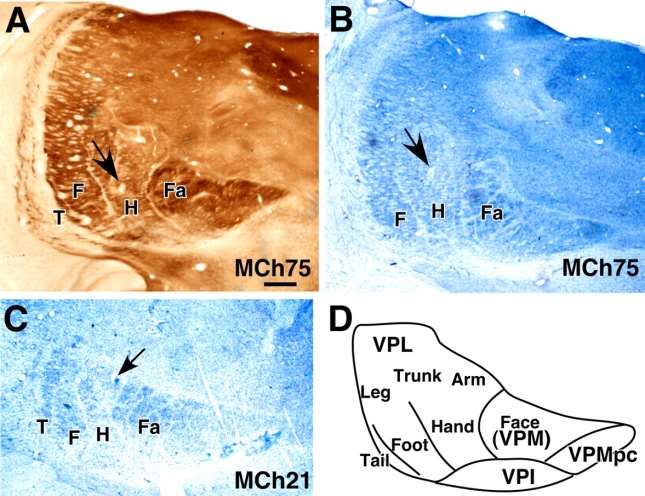
Figure 1 | ocular dominance columns and visual field map in primary visual cortex (V1). a | A
medial view of the posterior right hemisphere of a postmortem human brain. Human V1 is located
principally in the calcarine sulcus (CS), although its full extent frequently reaches the occipital pole
on the ventrolateral surface. b | The white and grey matter surface measured using MRI c | Part of
a flattened postmortem brain from a subject with an enucleated left eye, showing the right calcarine
and surrounding cortex. The cytochrome oxidase staining forms light and dark bands that reveal the
ocular dominance columns. The dark spot (arrow) is the projection zone from the left eye’s blind
spot (optic disk). d | Calcarine and surrounding cortex computationally flattened from the structural
MRI-derived surface mesh. The colour overlays identify the stimulus angle (left) or eccentricity
(right) that most effectively stimulates each cortical location.
Feedforward vs. Feedback Inputs

Primary visual cortex (V1) neurons receive diverse inputs.
a | A V1 neuron can receive input from the lateral geniculate nucleus (LGN), extrastriate cortex (V2, V3, middle
temporal (MT) and other extrastriate sources), In healthy V1, the reported receptive field (RF) size can vary
fourfold depending on the nature of the mapping stimulus. b | The different inputs to V1 neurons have a wide
range of RF sizes.
The variations in estimated RF size of V1 neurons probably result from different contributions from the pathways
that deliver the input signals to the V1 neuron.
From the V1 visual field map, it is possible to express estimates of the RF centre radius on the cortical surface.
The radius of V1 RFs is often larger than 3 mm, and more than 10% of the neurons have a radius exceeding 5
mm. The surround influence generally extends beyond 7 mm.
Functional MRI responses in a subject with juvenile
macular degeneration (JMD) (left) and a control
(right). The JMD subject has a large central scotoma
and spared vision in the lower peripheral field; the
responses from the control subject were measured
with a similar ‘artificial’ scotoma.

In the passive condition subjects passively viewed a
visual stimulus presented in the peripheral visual field
near the lower vertical meridian. In both subjects this
produced a modest response in the anterior
calcarine at the location corresponding to the
position of the stimulus in the peripheral visual field
(upper images; arrows).

In the active condition subjects were asked to
remember the visual stimulus from trial to trial (lower
images). In this condition, responses in the calcarine
sulcus of the JMD subject spread significantly
towards the occipital pole, and responses increased in
other regions, such as the ventral surface.

In the control subject there was no significant
expansion of the blood oxygen level-dependent signal
towards the posterior calcarine sulcus. The colour bar
indicates the amplitude of the blood oxygen
level-dependent response (percent modulation), either in
synchrony (red) or out of synchrony (blue) with the
stimulus. Only modulations exceeding 0.3% coherence
are shown.
The expected effect of retinal lesions on V1 responses. a | This schematic illustrates the diverse receptive
fields of neurons expected to be found within a region of V1. b | The same receptive fields are shown with a
transparent blue rectangle that indicates the lesion projection zone (LPZ) — the portion of the visual field that is
blinded by a simulated retinal lesion. The retinal lesion is located in the centre of the receptive fields that are
sampled from this part of the cortex.
The effect of the retinal lesion is a reduction in the number of responsive neurons within the LPZ.
Assuming that there is no cortical plasticity, we still expect some cells to continue to respond to signals placed
on adjacent regions of spared retina (red circles). Such neurons will necessarily have receptive fields that are
displaced (ectopic) from their pre-lesion position.
There are fewer responsive neurons inside the LPZ post-lesion than pre-lesion, presumably because
neurons with small receptive fields are silenced. Such data should be construed as supporting adult cortical
plasticity only if the reduction in the number of responsive cells, and the change in the properties of the ectopic
receptive fields, differs significantly from a model that assumes no plasticity.
Barton and Brewer 2015      Rod Scotoma

Fig. 1. Schematic of the predicted effects of the rod scotoma. (A–C) Black disks and black circles around
them indicate the preferred center and spread of a neuron’s RF, respectively. Each row, thus, represents
neurons with preferred centers at one specific eccentricity. (Lower) The gray shaded regions indicate the SPZ
of the rod scotoma under scotopic conditions. Black arrows indicate the expected direction of the measured
shift of RF centers caused by interaction of the rod scotoma with a neuron’s RF under scotopic relative to
photopic conditions. (A) Neurons with RFs completely eclipsed by the SPZ. (B) Neurons with RFs partially
eclipsed by the SPZ and centers within the SPZ.
(C) Neurons with RFs partially eclipsed by the SPZ and centers outside the SPZ. (D) pRF interactions with the
rod scotoma. This graph is an accurately scaled visual representation of the normal pRF sizes (measured
under photopic conditions) for each visual field map (degrees of visual angle corresponding to the sizes seen
here are shown in Fig. S6). Each circle is an accurately scaled visual representation of the average size of
pRFs for the eccentricities indicated below it in the map indicated on the left. The eccentricities labeled at the
bottom are the centers of the 1° bins used for 10 eccentricity-band ROIs measured for each visual field map.
Filled circles represent pRFs in eccentricities where the pRF is both large enough and close enough to the rod
scotoma to expect interactions between them. Open circles represent pRFs at eccentricities outside the
expected influence of the rod scotoma (see also Fig. S3)
Fig. 2. Visual field maps in photopic
and scotopic conditions. (A–D)
Pseudocolor overlays on a flattened
representation of occipital cortex from
the left hemisphere of one subject
(S2) represent the position in visual
space that produces the strongest
response at that cortical location. (A
and B) Eccentricity representations.
Color legend represents the visual
field from 0° to 10° radius of visual
angle. (C and D) Polar angle
representations. Color legend
represents the contralateral hemifield.
(A and C) Photopic measurements.

(B and D) Scotopic measurements. Boundaries of visual field maps are depicted with dotted (polar angle
boundaries between maps of interest) and solid (eccentricity boundaries and edge of measurement) black
lines. Coherence ≥ 0.20. (Scale bar: 1 cm along the flattened cortical surface.) (E, Upper) Anatomical
orientation legend. (E, Lower) Inflated 3D representation of a medial view of the left hemisphere of subject 2.
Inset indicates the region near the calcarine sulcus of the occipital lobe, where the maps were measured. (F)
Moving bar stimulus for visual field map and pRF measurements comprised a set of contrast-reversing
checkerboard patterns at eccentricities from 0° to 11° radius. One frame is shown for the bar stimulus
sequence. Four bar orientations (0°, 45°, 90°, and 135° from vertical) with two motion directions orthogonal to
each orientation were used, producing eight different bar configurations. Additional examples are in S2
Barton and Brewer 2015

Fig. 3. Coherence, eccentricity shifts, and pRF size changes in central and peripheral eccentricities. (A)
Coherence differences. (B) Ectopic eccentricity shifts. Positive numbers indicate shifts of pRF centers
outward from the rod scotoma, and negative numbers indicate shifts of pRF centers into the rod scotoma. (C)
Scotopic pRF size percentage changes. Positive values indicate larger pRF sizes under scotopic conditions,
whereas negative values indicate smaller pRF sizes under scotopic conditions. All data are plotted as a
function of the photopic eccentricity in degrees of visual angle. The legend indicates line shading and marker
shape for each map. Error bars represent SEMs (Figs. S5–S7).
Barton and Brewer 2015

        In summary, the central eccentricities of these visual field        maps,
with pRFs overlapping the SPZ, generally

•   (i) reduced their coherence because of silenced neurons,
•   (ii) shifted their pRF centers more eccentric from the rod scotoma, and
•   (iii) had variable results regarding scaling of their pRF sizes (increase,
    decrease, and no change).

These data are largely consistent with and extend the recent findings that
central retinal lesions caused by age-related macular degeneration and
simulated lesions in the central (5° and 7.5° radius) visual field in control
subjects show ectopic pRF shifts, silencing, and scaling in V1 caused by
cortical short-term adaptation rather than long-term reorganization
Adult Visual Cortex Plasticity Since somatosensory cortex can undergo large-scale topographic plasticity, is this a general feature of sensory cortex? Mixed results: Small, corresponding binocular retinal lesions in adults generally fail to reveal shifts of topographic maps into deafferented cortex. (cat, monkey, and human). Unilateral enucleation combined with unilateral retinal lesions can reveal ‘filling-in’ of deafferented cortical field. (cat) Conclusions: V1 may be unique in that binocular correspondence rules may limit the extent to which thalamocortical arbors and/or horizontal excitatory connections may spread into deafferented cortex. OR…..
Summary
Adult Cortical Plasticity
                  Visual cortex
                  Somatosensory cortex
                  Motor cortex
Perinatal animal plasticity
                  Ocular dominance
                  ‘Re-wired’ Ferrets
Human Cortical Plasticity
                  Language development
                  Auditory processing with early blindness
Plasticity vs. Vulnerability: The cost of plasticity
Conclusions
• Investigations in adults reveal the capacity and some mechanisms underlying cortical
plasticity and re-organization.
• The consequences of early damage to the nervous system depend upon the timing,
location, and extent of the injury.
• Although early damage may, in some circumstances, allow for maximal re-
organization (recovery), prolific reorganization may lead to long term negative
consequences.Selected References Barton B and Brewer AA (2015) fMRI of the rod scotoma elucidates cortical rod pathways and implications for lesion measurements. PNAS112:5201-5206. Chen LM Qi H-X Kaas JH (2012) Dynamic reorganization of digit representations in somatosensory cortex of nonhuman primates after spinal cord injury. J. Neurosci. 32:14649-14663. Darian-Smith, C and Gilbert CD (1995) Topographic reorganization in the striate cortex of the adult monkey is cortically mediated. J. Neurosci. 15: 1631-1647. Giannikopoulos DV and Eysel UT (2006) Dynamics and specificity of cortical map reorganization after retinal lesions. PNAS 103: 10805-10810. Gilbert, C.D. and Li, W. 2012 Adult visual cortical plasticity. Neuron. 75:250. Gilbert, C.D. and Li, W. 2009 Perceptual learning and adult cortical plasticity. J. Physiol. 587: 2743- 2751. Keck T, Mrsoc-Flogel TD, Afonso MV, Eysel UT, Bonhoeffer T, Hubener M (2008) Massive restructuring of neuronal circuits during functional reorganization of adult visual cortex. Nature Neurosci. 10: 1162- 1167. Nudo, RJ. (2013). Recovery after brain injury: mechanisms and principles. Front. Human Neurosci. 7: Reed, JL, Liao, C-C, Qi, HX, Kaas, JH. (2016) Plasticity and recovery after dorsal column spinal cord injury in nonhuman primates. J. Exp. Neurosci. 10:11-21. Reitsma et al. Atypical retinotopic organization of visual cortex in patients with central brain damage: congenital and adult onset. J. Neurosci. 33:13010 2013. Smirnakis SM, Brewer, AA, Schmid MC, Tolias AS, Schuz A, Augath M, Inhoffen W, Wandell BA, and Logothetis NK (2005) Lack of long-term cortical reorganization after macaque retinal lesions. Nature 435: 300-307. Wandell BA and Smirnakis SM (2009) Plasticity and stability of visual field maps in adult primary visual cortex. Nature Neurosci. Reviews 10: 873-884.
You can also read