Tacrolimus CYP3A Single-Nucleotide Polymorphisms and Preformed T- and B-Cell Alloimmune Memory Improve Current Pretransplant Rejection-Risk ...
←
→
Page content transcription
If your browser does not render page correctly, please read the page content below
ORIGINAL RESEARCH
                                                                                                                                             published: 27 June 2022
                                                                                                                                    doi: 10.3389/fimmu.2022.869554

                                          Tacrolimus CYP3A Single-Nucleotide
                                          Polymorphisms and Preformed
                          Edited by:
                   Frans H. J. Claas,     T- and B-Cell Alloimmune Memory
    Leiden University Medical Center,
                         Netherlands      Improve Current Pretransplant
                      Reviewed by:
               Lionel P. E. Rostaing,     Rejection-Risk Stratification in
         Université Grenoble Alpes,
                              France
                      Giorgia Comai,
                                          Kidney Transplantation
  Alma Mater Studiorum University of
                       Bologna, Italy     Elena Crespo 1*†, Anna Vidal-Alabró 2†, Thomas Jouve 1,3,4†, Pere Fontova 2, Maik Stein 5,6,7,
                             Lin Yan,     Sonila Mocka 2, Maria Meneghini 1,8, Anett Sefrin 5,6,7, Petra Hruba 9, Montserrat Gomà 10,
          Sichuan University, China       Alba Torija 1, Laura Donadeu 1, Alex Favà 11, Josep M. Cruzado 11, Edoardo Melilli 11,
                 *Correspondence:         Francesc Moreso 8, Ondrej Viklicky 9, Frederike Bemelman 12, Petra Reinke 5,6,7,
                        Oriol Bestard     Josep Grinyó 13, Nuria Lloberas 2‡ and Oriol Bestard 1,8*‡
               obestard@vhebron.net
                                          1 Nephrology and Transplant Laboratory, Vall d'Hebron Institute of Research (VHIR), Barcelona, Spain, 2 Experimental
                        Elena Crespo
               elena.crespo@vhir.org      Nephrology and Transplantation Laboratory, Instituto de Investigación Biomédica de Bellvitge (IDIBELL), Barcelona, Spain,
                                          3 Faculty of Health, Université Grenoble Alpes, Grenoble, France, 4 Institute for Advanced Biosciences, INSERM 1209, CNRS
     †
      These authors have contributed      5309, Grenoble, France, 5 Berlin Center for Advanced Therapies (BeCAT), Berlin, Germany, 6 Charité - Universitätsmedizin
       equally to this work and share     Berlin, corporate member of Freie Universität Berlin, Humboldt-Universität zu Berlin, Berlin, Germany, 7 Berlin Institute of
                       first authorship    Health (BIH), Berlin, Germany, 8 Kidney Transplant Unit and Nephrology Department, Vall d’Hebron Hospital, Barcelona,
     ‡                                    Spain, 9 Department of Nephrology, Institute for Clinical and Experimental Medicine (IKEM), Prague, Czechia, 10 Pathology
      These authors have contributed
       equally to this work and share     Department, Bellvitge University Hospital, Barcelona, Spain, 11 Kidney Transplant Unit, Nephrology Department, Bellvitge
                     senior authorship    University Hospital, Barcelona, Spain, 12 Renal Transplant Unit, Department of Internal Medicine, Amsterdam University
                                          Medical Centers, Academic Medical Center—University of Amsterdam, Amsterdam, Netherlands, 13 Department of Clinical
                                          Sciences, Barcelona University, Barcelona, Spain
                   Specialty section:
         This article was submitted to
    Alloimmunity and Transplantation,
                                          Achieving fast immunosuppression blood exposure after kidney transplantation is key to
               a section of the journal
              Frontiers in Immunology     abrogating both preformed and de novo anti-donor humoral and cellular alloresponses.
         Received: 04 February 2022       However, while tacrolimus (TAC) is the cornerstone immunosuppressant inhibiting
            Accepted: 23 May 2022         adaptive alloimmunity, its blood exposure is directly impacted by different single-
           Published: 27 June 2022
                                          nucleotide polymorphisms (SNPs) in CYP3A TAC-metabolizing enzymes. Here, we
                             Citation:
  Crespo E, Vidal-Alabró A, Jouve T,
                                          investigated how functional TAC-CYP3A genetic variants (CYP3A4*22/CYP3A5*3)
       Fontova P, Stein M, Mocka S,       influence the main baseline clinical and immunological risk factors of biopsy-proven
     Meneghini M, Sefrin A, Hruba P,
                                          acute rejection (BPAR) by means of preformed donor-specific antibodies (DSAs) and
Gomà M, Torija A, Donadeu L, Favà A,
     Cruzado JM, Melilli E, Moreso F,     donor-specific alloreactive T cells (DSTs) in a large European cohort of 447 kidney
  Viklicky O, Bemelman F, Reinke P,       transplants receiving TAC-based immunosuppression. A total of 70 (15.7%) patients
 Grinyó J, Lloberas N and Bestard O
   (2022) Tacrolimus CYP3A Single-
                                          developed BPAR. Preformed DSAs and DSTs were observed in 12 (2.7%) and 227
      Nucleotide Polymorphisms and        (50.8%) patients, respectively. According to the different CYP3A4*22 and CYP3A5*3
              Preformed T- and B-Cell
                                          functional allele variants, we found 4 differential new clusters impacting fasting TAC
        Alloimmune Memory Improve
                 Current Pretransplant    exposure after transplantation; 7 (1.6%) were classified as high metabolizers 1 (HM1), 71
        Rejection-Risk Stratification in   (15.9%) as HM2, 324 (72.5%) as intermediate (IM), and 45 (10.1%) as poor metabolizers
               Kidney Transplantation.
          Front. Immunol. 13:869554.
                                          (PM1). HM1/2 showed significantly lower TAC trough levels and higher dose requirements
   doi: 10.3389/fimmu.2022.869554         than IM and PM (p < 0.001) and more frequently showed TAC underexposure (
Crespo et al.                                                                                         Improving Rejection-Risk Stratification in Transplantation

                                    Multivariate Cox regression analyses revealed that CYP3A HM1 and IM pharmacogenetic
                                    phenotypes (hazard ratio (HR) 12.566, 95% CI 1.99–79.36, p = 0.007, and HR 4.532, 95% CI
                                    1.10–18.60, p = 0.036, respectively), preformed DSTs (HR 3.482, 95% CI 1.99–6.08, p <
                                    0.001), DSAs (HR 4.421, 95% CI 1.63–11.98, p = 0.003), and delayed graft function (DGF)
                                    (HR 2.023, 95% CI 1.22–3.36, p = 0.006) independently predicted BPAR. Notably, a
                                    significant interaction between T-cell depletion and TAC underexposure was observed,
                                    showing a reduction of the BPAR risk (HR 0.264, 95% CI 0.08–0.92, p = 0.037). Such
                                    variables except for DSAs displayed a higher predictive risk for the development of T cell-
                                    mediated rejection (TCMR). Refinement of pretransplant monitoring by incorporating TAC
                                    CYP3A SNPs with preformed DSAs as well as DSTs may improve current rejection-risk
                                    stratification and help induction treatment decision-making.
                                    Keywords: kidney transplantation, calcineurin inhibitors immunosuppression, acute rejection, immunobiology, genetics

1 INTRODUCTION                                                                  dose requirement, regardless of CYP3A5 genotype (25, 26).
                                                                                Nevertheless, while genotype-based adjustment of initial TAC
Alloreactive immune memory is the hallmark of adaptive                          doses has proven useful in two prospective trials, no
immunity and is a key factor driving acute kidney transplant                    improvement on main clinical outcomes such as acute
rejection and accelerated graft loss (1–3). Indeed, preformed                   rejection rates has been described yet (27, 28). Of note, these
donor-specific antibodies (DSAs) are a well-recognized factor of                 studies did not stratify kidney transplant patients according to
poor graft outcome, and owing to systematic pretransplant                       pretransplant alloimmune memory status, both DSAs and also
screening, the incidence of acute antibody-mediated rejection                   DSTs, in whom different individual CYP3A TAC phenotype
(ABMR) has significantly decreased (4). Likewise, preformed                      expression could modulate their risk of biopsy-proven acute
donor-specific T-cell memory (DSTs) may also exist in a great                    rejection (BPAR).
proportion of transplant candidates and has been associated with                    Therefore, since kidney transplant candidates with preformed
a higher risk of T cell-mediated rejection (TCMR) (5–8)                         anti-donor alloimmune memory might need a particularly fast
after transplantation.                                                          exposure to TAC blood concentrations to effectively inhibit anti-
    Importantly, memory T cells are more resistant to                           donor recall immune responses, particularly in the early
immunosuppressive therapies than their naïve counterparts (9–                   posttransplant period, we hypothesized that the impact of
11), as they can rapidly repopulate and dominate peripheral anti-               pretransplant DSTs and DSAs, together with other main
donor alloimmune responses (12). Experimental and human ex                      baseline clinical variables and the different CYP3A TAC
vivo studies have shown that calcineurin inhibitors, and                        phenotypes, could significantly modulate the relative risk and
especially tacrolimus (TAC), can more efficiently inhibit these                  types of BPAR. Thus, the primary endpoint of the study was to
cells (13, 14). However, even though the implementation of                      evaluate the value of preformed alloimmune memory (both
TAC-based regimens as the current standard of care                              DSAs and DSTs) together with different CYP3A TAC
immunosuppressive therapy has led to a significant reduction                     pharmacogenetic phenotypes to discriminate patients at risk of
in acute rejection rates, acute TCMR still unpredictably occur                  developing acute rejection after kidney transplantation.
(15, 16).
    TAC has a narrow therapeutic index leading to a large
interindividual pharmacokinetic variability (17), and                           2 MATERIALS AND METHODS
suboptimal TAC exposure during the initial period after
transplantation has been associated with a higher risk of acute                 2.1 Study Population
rejection (18, 19), especially in highly immunized kidney                       A total of 738 consecutive, adult, single-kidney-transplant
transplant patients (20). Among different factors influencing                    recipients from four different European kidney transplant
TAC pharmacokinetics, single-nucleotide polymorphisms                           centers (Bellvitge University Hospital in Barcelona, Spain;
(SNPs) in genes coding for TAC-metabolizing enzymes                             Campus Virchow-Clinic in the Charité University Hospital in
cytochrome P450 (CYP) 3A4 and 3A5 have been shown to                            Berlin, Germany; Academic Medical Center, University of
play a major impact (21, 22). Indeed, patients expressing the                   Amsterdam in Amsterdam, the Netherlands; and Institute for
CYP3A5*1 allele (CYP3A5 expressers) have significantly higher                    Clinical and Experimental Medicine (IKEM) in Prague, Czech
dose requirements to achieve similar TAC trough levels (C0)                     Republic), who were transplanted between June 2012 and
than patients homozygous for the CYP3A5*3 allele (CYP3A5                        December 2017, were retrospectively analyzed on the basis of
non-expressers) (23, 24). Similarly, the non-functional                         the availability of both donor and recipient pretransplant
CYP3A4*22 allele has also been associated with a reduced TAC                    peripheral blood mononuclear cells (PBMCs) and recipient

Frontiers in Immunology | www.frontiersin.org                               2                                       June 2022 | Volume 13 | Article 869554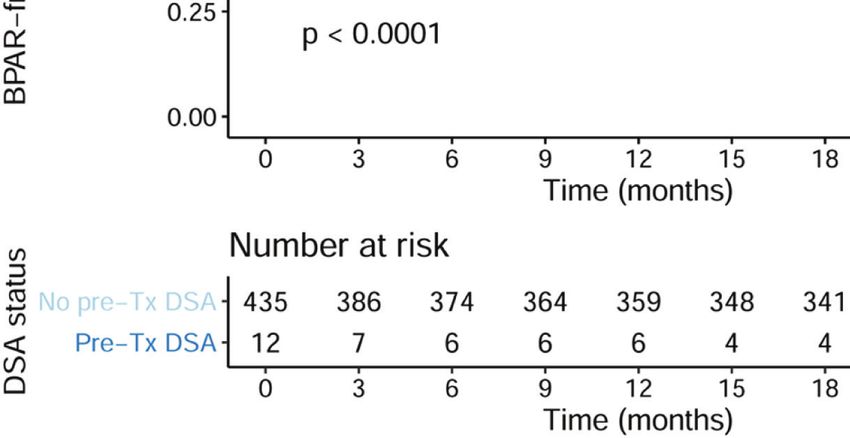
Crespo et al. Improving Rejection-Risk Stratification in Transplantation
plasma samples to assess DSTs, DSAs, and the CYP3A genotypes with oral prednisone at 5 mg/day, after the first month as
for their value predicting acute rejection after transplantation. maintenance immunosuppression. Either basiliximab (72.3%)
Furthermore, the main baseline and clinical variables such as the or thymoglobulin (rATG) (27.7%) was given as induction
use of T cell-depleting agents, development of delayed graft therapy as per practice in each center. Initial TAC doses were
function (DGF), and importantly distinct TAC blood adjusted by the respective patient’s body weight and given at 0.05
exposures were also assessed in this study to evaluate their mg/kg bid for the immediate release (TAC-IR) and 0.12 mg/kg/
impact on modulating these pretransplant immunologic and day for the extended release (TAC-ER), to achieve TAC trough
pharmacogenetic variables facilitating the risk of acute levels of 6–10 ng/ml during the first 6 months and 5–8 ng/ml
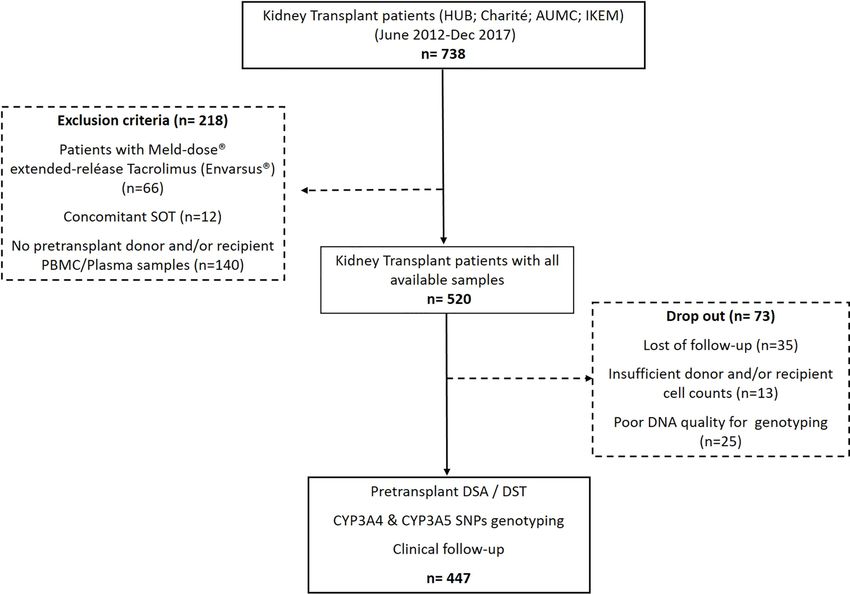
rejection. As illustrated in Figure 1, 218 patients were excluded thereafter. TAC trough levels were measured before the patient’s
because they are receiving the Meld-dose® extended-release administration of the morning dose, on days 7, 14, 30, and 90
TAC formulation (Envarsus®), were transplanted with another and at 180 days after transplantation. TAC intra-patient
concomitant solid organ, or lack of biological samples. The first variability (IPV) was estimated through the coefficient of
exclusion criterion was applied due to the different variation (SD/mean × 100).
pharmacokinetic profiles that have been reported for the
Envarsus® formulation. In addition, 73 out of the 520 patients 2.3 CYP3A Genotyping Analysis
in the study were dropped out because of the following reasons: Genomic DNA was extracted from a peripheral whole-blood
poor quality of DNA for genotyping analyses (n = 25), sample using the Wizard Genomic DNA Purification Kit
insufficient donor and/or recipient cell counts (n = 13), or lost (Promega Corporation, Sydney, VIC, Australia) and was stored
to follow-up (n = 35). Therefore, 447 patients were evaluated in at −80°C. For the genotyping, allelic discrimination reactions were
the study. The respective institutional review boards approved performed using specific TaqMan (Applied Biosystems, Foster
the study, and all patients gave written informed consent. City, CA, USA) genotyping assays on an ABI PRISM 7900 Fast
Patients were followed up for at least 24 months. The main Real-Time PCR Systems (Applied Biosystems) using 20 ng of
baseline demographic variables were collected at the time of genomic DNA and according to the manufacturer’s instructions.
enrollment, and clinical variables associated with clinical According to the functional CYP3A variants, patients were
transplant outcomes were pooled together for the study. DGF classified as poor TAC metabolizers (PM) if they were *22
was considered as the absence of recovery of graft function carriers (*1/*22 or *22/*22) for CYP3A4 or they were *3/*3
requiring hemodialysis after transplant surgery. genotype for CYP3A5 or as high metabolizers (HM) if they
expressed the *1/*1 genotype for CYP3A4 or *1 carrier (*1/*3 or
2.2 Immunosuppression *1/*1) for CYP3A5. Furthermore, patients were clustered into
All patients of the study received an immediate (Prograf® different groups according to both CYP3A4*22 and CYP3A5*3
Astellas Pharma; or Adoport® Sandoz Pharma) or extended- allelic status, specifically considering the functional *1 allele: high
release (Advagraf®, Astellas Pharma) TAC formulation, CYP3A metabolizers 1 (HM1) (CYP3A4*1/*1 and CYP3A5*1/*1),
mycophenolate mofetil (MMF), 1 g bid, during the first 2 high metabolizers 2 (HM2) (either CYP3A4*1/*1 and CYP3A5*1
weeks and subsequently tapered to 500 mg bid, and steroids carriers or CYP3A4*1 carriers and CYP3A5*1/*1), intermediate
FIGURE 1 | Flowchart of the study.
Frontiers in Immunology | www.frontiersin.org 3 June 2022 | Volume 13 | Article 869554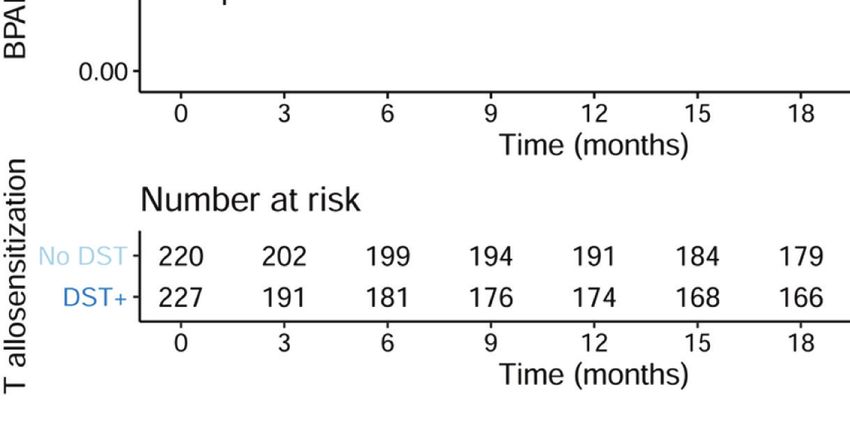
Crespo et al.                                                                              Improving Rejection-Risk Stratification in Transplantation

(IM) (CYP3A4*1/*1 with CYP3A5*3/*3 or CYP3A4*22/*22 with               with 10% inactivated fetal bovine serum (FBS), antibiotics, and L-
CYP3A5*1/*1 or CYP3A4*22 carriers with CYP3A5*1 carriers),             glutamine) and Pokeweed (AID, Autoimmun Diagnostika,
poor 1 (PM1) (CYP3A4*22 carriers with CYP3A5*3/*3 or                   Straßberg, Germany) as negative and positive controls,
CYP3A4*22/*22 with CYP3A5*1 carriers), and poor 2 (PM2)                respectively. Results were given as frequencies of IFN-g-
(CYP3A4*22/*22 with CYP3A5*3/*3). In the study cohort, there           producing donor-specific T cells/3 × 105 PBMCs, subtracting
were no CYP3A4*22/*22 with CYP3A5*1/*1 patients (one of the            responses of the negative control wells. As previously reported,
combinations for IM) nor CYP3A4*22/*22 with CYP3A5*3/                  25 or higher IFN-g-producing donor-specific T cells/3 × 105
*3 (PM2).                                                              PBMCs was considered a positive test (4, 5).

2.4 Donor and Recipient Cell Source                                    2.6 Renal Allograft Histology
Peripheral blood samples were obtained in heparinized tubes            Renal allograft biopsies were performed in patients undergoing
from renal transplant recipients before kidney transplantation.        acute clinical graft dysfunction, such as a change in serum
Donor cells were obtained from donor spleens or PBMCs in               creatinine levels, decreasing estimated glomerular filtration rate
deceased and living donors. PBMCs and splenocytes were                 (eGFR), and the appearance of proteinuria and/or hematuria. All
isolated by standard Ficoll density gradient centrifugation,           renal biopsies were blindly analyzed following the Banff 2013
were frozen in liquid nitrogen, and subsequently used for the          score classification (31) and retrospectively revised following
IFN-g Enzyme-linked Immunosorbent Spot (ELISPOT) assay.                Banff 2015 (32) by an expert kidney transplant pathologist.

2.5 Assessment of Pretransplant Donor-                                 2.7 Statistical Analysis
Specific Alloimmune Memory                                              All data are presented as mean ± SD or median and interquartile
Pretransplant humoral and cellular donor-specific alloimmune            range. Groups were compared using the X2-test for categorical
memory was assessed in all patients of the study in peripheral         variables and the one-way ANOVA analysis or Student’s t-test
blood by means of serum DSAs and circulating donor-specific             for normally distributed data for quantitative variables.
memory/effector T cells (DSTs), respectively. While                        Cox regression analyses were performed to determine the
pretransplant DSA data were available to the transplant                significant univariate associations of pretransplantation factors
physicians prior to transplantation, all data related to               with the risk of BPAR. An interaction analysis between ATG
pretransplant DSTs were blinded and thus did not influence              induction and low TAC exposure was also introduced, as it was
the type of immunosuppressive therapy used. Pretransplant              suspected that a depleting ATG induction might dampen the
DSAs were not detected at the time of transplantation and              effect of low TAC exposure. These interaction analyses were also
were confirmed later; therefore, these patients did not receive         carried out between ATG induction and DSTs, as well as ATG
any desensitizing treatment before transplantation.                    and DSAs. These interaction analyses were performed in Cox
                                                                       models with 2 covariates plus the interaction term. A
2.5.1 Donor-Specific Anti-HLA Antibodies                                multivariate Cox survival model was then built on these
Screening for circulating anti-HLA class I and II antibodies was       significant associations to evaluate the independent predictors
carried out in serum samples before transplantation in all             of BPAR. Results were expressed as hazard ratios (HRs) with
patients and at the time of a kidney transplant biopsy and was         95% CIs. Kaplan–Meier analyses were performed to represent
determined using single-antigen flow beads assays on a Luminex          allograft rejection-free survival, and log-rank tests were
platform (Lifecodes, division of Immucor, Stanford, CT, USA).          computed for the associated curves. The statistical significance
Patients previously only screened for anti-HLA antibodies with         level was defined as a 2-tailed p < 0.05. All statistical analyses
the screening assay (Lifecodes, division of Immucor, Stanford,         were performed with IBM® SPSS Statistics (version 23) and R
CT, USA), were re-assessed for single-antigen flow beads assays         (version 4.1).
to rule out the presence of donor (HLA)-specific antibodies
(DSAs). All beads showing a normalized mean fluorescence
intensity (MFI) >1,500 were considered positive if [MFI/(MFI
lowest bead)] > 5.                                                     3 RESULTS
2.5.2 Donor-Specific Memory/Effector T Cells                            3.1 Main Demographics and Clinical
Pretransplant frequencies of circulating donor-specific memory/         Characteristics of the Study Population
effector T-cell alloreactivity (DSTs) were monitored by an IFN-g       The flowchart of the study is depicted in Figure 1. The mean
ELISPOT assay following recently described standard operating          study patient follow-up was 36.4 ± 18.1 months. As shown in
procedures (29, 30). Briefly, 3 × 10⁵ responder cells were placed       Table 1, most patients were adult Caucasian patients who
in triplicate wells with 3 × 10⁵ CD2-depleted splenocytes              underwent a deceased-donor kidney transplant. While only 12
(Easysep® Human CD2 Selection kit, StemCell, Saint-Egrève,             patients showed pretransplant DSAs (2.7%), 227/447 (50.8%)
France) or CD3-depleted living-donor PBMCs (human CD3+                 displayed preformed DSTs. Most patients received a TAC-IR
Cell Depletion Cocktail, RosetteSep® kit, StemCell, France).           formulation (87.2%). A total of 323 (72.3%) patients received
Recipient cells were stimulated with complete medium alone             basiliximab, whereas 124 (27.7%) received rATG. Of 447, 70
(RPMI 1640, GE Healthcare Life Sciences, Chicago, IL, USA,             (15.6%) developed BPAR, with most of them TCMR (57/70,

Frontiers in Immunology | www.frontiersin.org                      4                                     June 2022 | Volume 13 | Article 869554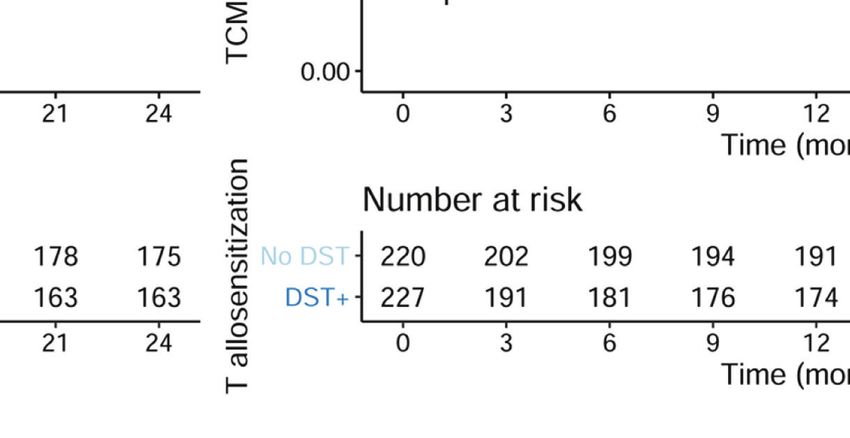
Crespo et al. Improving Rejection-Risk Stratification in Transplantation
81.4%). The median time to BPAR was 0.95 [0.3–3.0] months. genotype as poor metabolizers (PM). Since clustering patients
Thirteen (2.9%) patients died, and 33 (7.4%) allografts were lost. according to both CYP3A4*22 and CYP3A5*3 allelic status may
identify their metabolic status (24), we also stratified patients
3.2 Pharmacogenetic CYP3A Phenotypes according to all 4 different CYP3A phenotype clusters in our
and Posttransplant Tacrolimus Exposure cohort: 7/447 (1.6%) patients were classified as high HM1, 71/447
Since the patients of this study were treated with either an (15.9%) as HM2, 319/447 (71.4%) as IM1 and 5/447 (1.1%) as IM2,
immediate (TAC-IR) or an extended-release (TAC-ER) TAC and 45/447 (10.1%) as PM1 (Table 1). As previously reported
formulation, we first compared whether TAC trough among the Caucasian transplant population (33), most CYP3A4*22
concentrations and dose ratios (C/D ratio) between the two carriers were non-expressers for CYP3A5 (45/50; 90%).
groups were comparable between the two formulations. As When considering the CYP3A phenotypes’ categorization
shown in Supplementary Figure 1, no differences were and their impact on first TAC trough levels and dose
observed between TAC-IR and TAC-ER formulations, and adjustments, we first analyzed the clusters by merging all HM,
thus, all patients were analyzed together (p > 0.05 for all IM, and PM from each CYP3A genotype. As illustrated in
time points). Figure 2, HM patients showed significantly lower TAC trough
The frequencies of the CYP3A4*1/*1 and *1/*22 genotypes were levels as compared to IM and PM patients within the first 2
397 (88.8%) and 50 (11.2%), respectively. There were no weeks. Notably, patients with an IM phenotype showed
CYP3A4*22/*22 homozygous patients. The CYP3A5*1/1*, *1/*3, intermediate TAC trough levels compared to both HM and
and *3/*3 genotypes were observed in 7 (1.6%), 76 (17%), and 364 PM patients in the early period (Figure 2A). Also, HM
(81.4%) patients, respectively. As previously described (24), patients required higher TAC dose adjustments to reach the same TAC
with CYP3A4*1/*1 genotype were classified as high TAC trough levels than did PM during the first 6 months of follow-up
metabolizers (HM) whereas *22 expressers as poor metabolizers (Figure 2B). This difference was also observed between IM and
(PM). Likewise, patients with CYP3A5*1/1*and *1/*3 genotypes PM patients from 2 weeks to 6 months of follow-up. While TAC
were considered as TAC high metabolizers (HM) while *3/*3 dose adjustments allowed TAC trough levels to converge starting
TABLE 1 | Main demographics of patients of the study.
Demographical, clinical, Immunological variables Overall (n=447)
Recipient age, yr 51.450 (14.142)
Donor age, yr 54.492 (14.625)
Recipient gender, female 147 (32.9%)
Donor type, living 170 (38.0%)
Recipient ethnicity, non-caucasian 27 (6.0%)
Transplant index, >1 44 (9.7%)
Time on dialysis, mo 31.459 (39.622)
Cold ischemia time, hr 11.849 (9.389)
Tacrolimus formulation
Immediate release (TAC-IR) 390 (87.2%)
Extended release (TAC-ER) 57 (12.8%)
rATG induction 124 (27.7%)
CYP3A genotypes
3A4*1*1, 3A5*1*1 (HM1) 7 (1.6%)
3A4*1*1, 3A5*1*3 (HM2) 71 (15.9%)
3A4*1*1, 3A5*3*3 (IM1) 319 (71.4%)
3A4*22, 3A5*1*3 (IM2) 5 (1.1%)
3A4*22*22, 3A5*1*1 (IM3) 0 (0%)
3A4*1*22, 3A5*3*3 (PM1) 45 (10.1%)
3A4*22*22, 3A5*3*3 (PM2) 0 (0%)
HLA mismatches (class 1), # 2.574 (1.024)
HLA mismatches (class 2), # 1.155 (0.607)
PreTR DST, yes 227 (50.8%)
PreTR DSA, yes 12 (2.7%)
DGF, yes 131 (29.3%)
BPAR, yes 70 (15.7%)
TCMR 57 (12.8%)
ABMR 18 (4.0%)
Graft loss, yes 33 (7.4%)
Death, yes 13 (2.9%)
ABMR, antibody-mediated rejection; BPAR, biopsy-proven acute rejection; DGF, delayed graft function; DSA, donor-specific antibodies; DST: donor-specific T cells; mo, months; PreTR,
pre-transplant; rATG, rabit anti-thymocyte globulin; TCMR, T cell mediated rejection; yr, years.
The “*” is the symbol that represents the different allelic variants. It represents alleles with altered functionality which may lead to profiles of increased or reduced drug metabolism.
# means "number"
Frontiers in Immunology | www.frontiersin.org 5 June 2022 | Volume 13 | Article 869554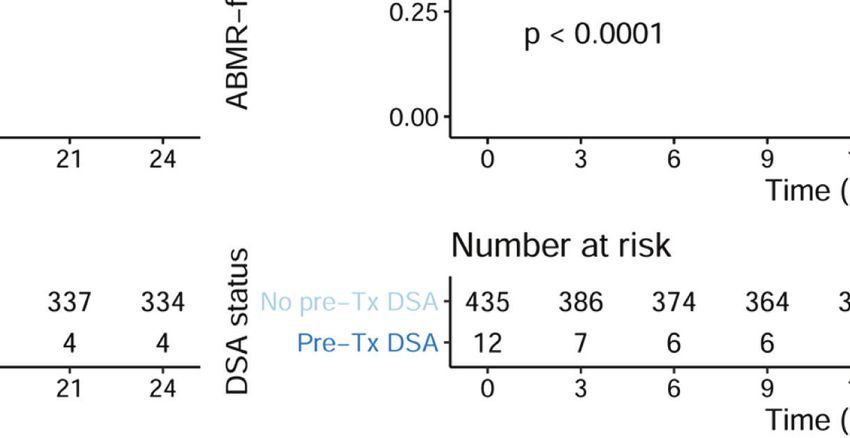
Crespo et al.                                                                                                          Improving Rejection-Risk Stratification in Transplantation

                            A                                                            B

                            C                                                            D

 FIGURE 2 | Comparison of tacrolimus outcomes with time, considering the four CYP3A TAC-metabolizing groups. (A) TAC trough levels between HM/IM and PM clusters.
 Significantly lower TAC levels were observed within the first 2 weeks early after transplantation in HM as compared to IM and PM patients. TAC C0 values (ng/ml) were 4.50 (3.15–
 6.85) vs 8.00 (5.97–10.70) vs 9.40 (6.40–11.05), p < 0.001 at 7 days; 6.20 (5.00–7.80) vs 8.00 (6.12–10.30) vs 9.60 (7.15–11.45), p < 0.001 at 14 days; 7.30 (5.37–8.60) vs 7.90
 (6.20–10.39) vs 8.34 (6.22–10.31), p = 0.013 at 1 month; 6.75 (5.15–8.33) vs 7.50 (6.00–8.85) vs 7.90 (6.50–9.20), p = 0.029 at 3 months; and 6.60 (5.08–7.83) vs 6.60 (5.30–
 8.40) vs 6.53 (5.00–7.97), p = 0.517 at 6 months in HM CYP3A vs IM CYP3A vs PM CYP3A patients, respectively. (B) TAC trough level-to-dose ratio between HM/IM and PM
 clusters. HM patients required higher TAC doses to reach the same TAC trough levels as IM and PM at different times post-transplantation. TAC dose-adjusted C0 ratios were
 0.56 (0.38–0.96) vs 1.10 (0.78–1.60) vs 1.32 (1.03–1.94), p < 0.001 at 7 days; 0.75 (0.47–1.10) vs 1.20 (0.83–1.69) vs 1.85 (1.50–2.30), p < 0.001 at 14 days; 0.92 (0.58–1.26)
 vs 1.43 (1.00–2.00) vs 2.30 (1.50–2.63), p < 0.001 at 1 month; 0.94 (0.64–1.55) vs 1.62 (1.22–2.29) vs 2.35 (1.66–3.30), p < 0.001 at 3 months; and 0.91 (0.68–1.28) vs 1.78
 (1.18–2.43) vs 2.20 (1.62–3.50), p < 0.001 at 6 months in HM CYP3A vs IM CYP3A vs PM CYP3A patients, respectively. (C) TAC trough levels between HM1/2, IM, and PM1
 clusters. Significantly lower TAC trough levels were observed within the first 2 weeks early after transplantation in HM1/2 as compared to IM and PM1 patients. TAC C0 values (ng/
 ml) were 3.90 (2.18–4.85) vs 4.70 (3.20–6.90) vs 8.00 (5.97–10.70) vs 9.40 (6.40–11.05), p < 0.001 at 7 days; 4.70 (2.90–8.30) vs 6.30 (5.13–7.76) vs 8.00 (6.12–10.30) vs 9.60
 (7.15–11.45), p < 0.001 at 14 days; 7.00 (5.00–7.80) vs 7.30 (5.35–8.64) vs 7.90 (6.20–10.39) vs 8.34 (6.22–10.31), p = 0.028 at 1 month; 7.40 (6.50–10.75) vs 6.60 (4.95–8.35)
 vs 7.50 (6.00–8.85) vs 7.90 (6.50–9.20), p = 0.040 at 3 months; and 7.30 (5.35–8.05) vs 6.60 (5.05–7.85) vs 6.60 (5.30–8.40) vs 6.53 (5.00–7.97), p = 0.674 at 6 months in HM1
 CYP3A vs HM2 CYP3A vs IM CYP3A vs PM1 CYP3A patients, respectively. (D) TAC trough level-to-dose ratio between HM1/2, IM, and PM1 clusters. HM1/2 patients required
 higher TAC doses to reach the same trough levels as IM and PM1 at different times post-transplantation. TAC dose-adjusted C0 ratios were 0.34 (0.14–0.60) vs 0.62 (0.41–0.96)
 vs 1.10 (0.78–1.60) vs 1.32 (1.03–1.94), p < 0.001 at 7 days; 0.31 (0.18–0.72) vs 0.76 (0.54–1.12) vs 1.20 (0.83–1.69) vs 1.85 (1.50–2.30), p < 0.001 at 14 days; 0.38 (0.30–
 0.67) vs 0.93 (0.64–1.40) vs 1.43 (1.00–2.00) vs 2.30 (1.50–2.63), p < 0.001 at 1 month; 0.41 (0.31–1.80) vs 0.94 (0.69–1.54) vs 1.62 (1.22–2.29) vs 2.35 (1.66–3.30), p < 0.001
 at 3 months; and 0.48 (0.41–0.69) vs 0.95 (0.68–1.31) vs 1.78 (1.18–2.43) vs 2.20 (1.62–3.50), p < 0.001 at 6 months in HM1 CYP3A vs HM2 CYP3A vs IM CYP3A vs PM1
 CYP3A patients, respectively. TAC, tacrolimus; HM, high metabolizers; IM, intermediate; PM, poor metabolizers.

3 months post-transplantation, the C/D ratio remained                                        significant differences in both TAC trough levels and TAC
significantly different between the three CYP3A cluster                                       dose adjustments (TAC C/D ratio) between the two HM
phenotypes. However, when the HM phenotype was further                                       groups were observed (Figures 2C, D). All pharmacokinetic
stratified into HM1 and HM2 phenotypes, statistically                                         data including TAC trough levels (ng/ml), daily doses (mg/day),

Frontiers in Immunology | www.frontiersin.org                                           6                                             June 2022 | Volume 13 | Article 869554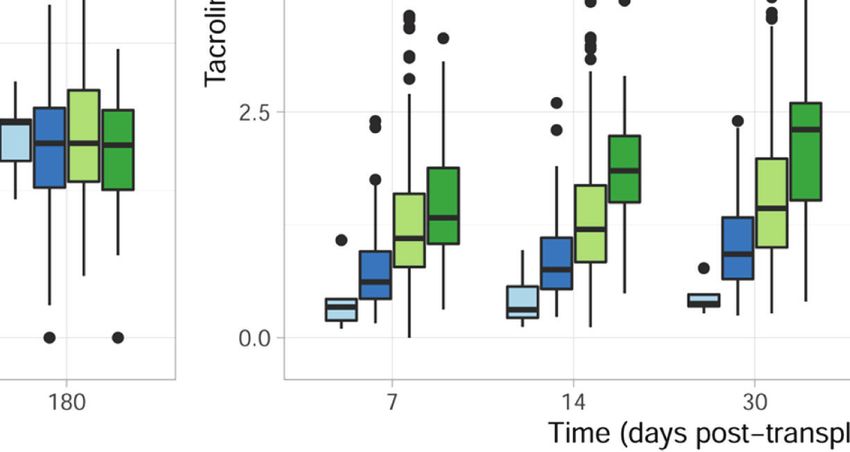
Crespo et al.                                                                                                         Improving Rejection-Risk Stratification in Transplantation

and dose-adjusted trough level (ng/ml/mg/day) at five different                             mean time of BPAR occurrence (7.10 [5.90–9.01] vs 8.10 [6.47–
time points (days 7 and 14 and months 1, 3, and 6) after                                   9.74] ng/ml, respectively, p = 0.035). Among patients
transplantation are summarized in Supplementary Table 1.                                   experiencing BPAR, 27/70 (38.6%) had at least one TAC
                                                                                           trough level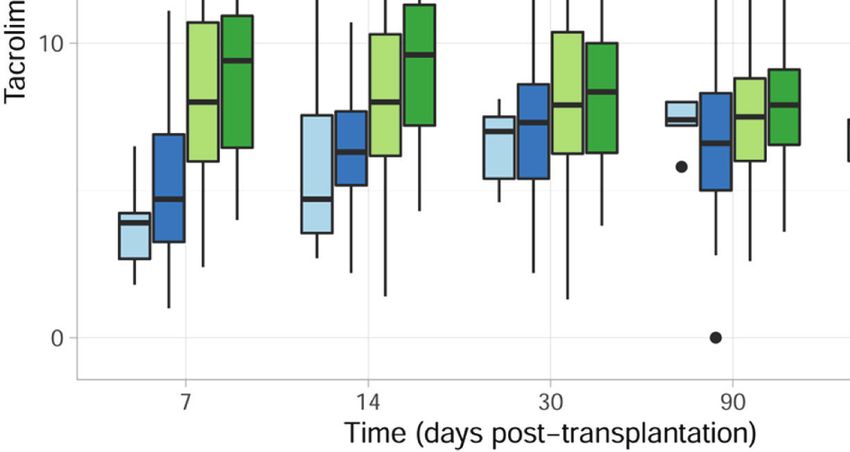
Crespo et al.                                                                                               Improving Rejection-Risk Stratification in Transplantation

                               A                                                    B

 FIGURE 3 | Proportion of TAC underexposure ( 0.05 for IM and HM2, when compared to PM in a univariate                            with DSTs but numerically increased in rATG patients with
Cox model).                                                                             DSAs. Interestingly, when specifically focusing on the risk of
   Next, we assessed whether other relevant clinical or                                 TCMR, DSTs, DGF, recipient age, and the CYP3A HM1
immunological variables were associated with the risk of                                phenotype as well as the interaction between rATG and low
BPAR, in univariate Cox analyses. As shown in Table 3, in                               TAC exposure were associated with higher TCMR rates. While
addition to CYP3A clusters H1 and IM together with                                      the interaction between DSTs and rATG induction was not
pretransplant DSTs and DSAs, the development of DGF and                                 significant (HR = 0.51, p = 0.308), it showed a numerically
low TAC exposure (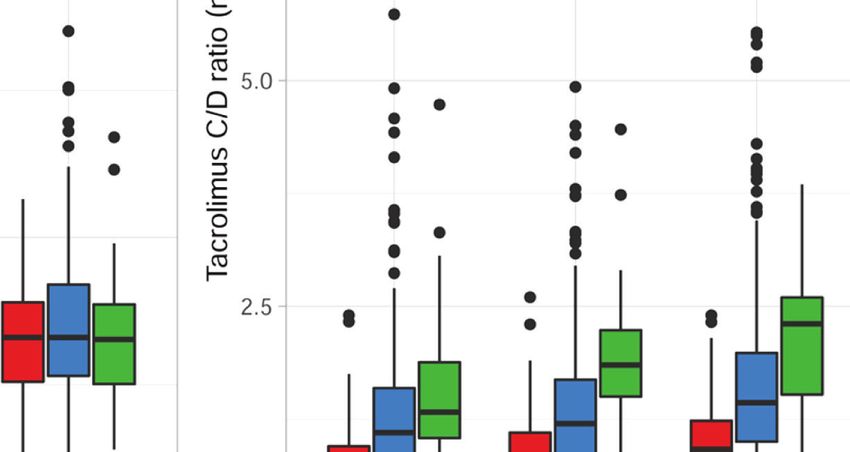
Crespo et al.                                                                                                Improving Rejection-Risk Stratification in Transplantation

                             A                                                        B

                             C                                                        D

 FIGURE 4 | Incidence of BPAR in presence of pretransplant DSTs and DSAs in the whole population (n = 447). (A) Kaplan–Meier BPAR-free survival curves
 according to pretransplant DSTs (log rank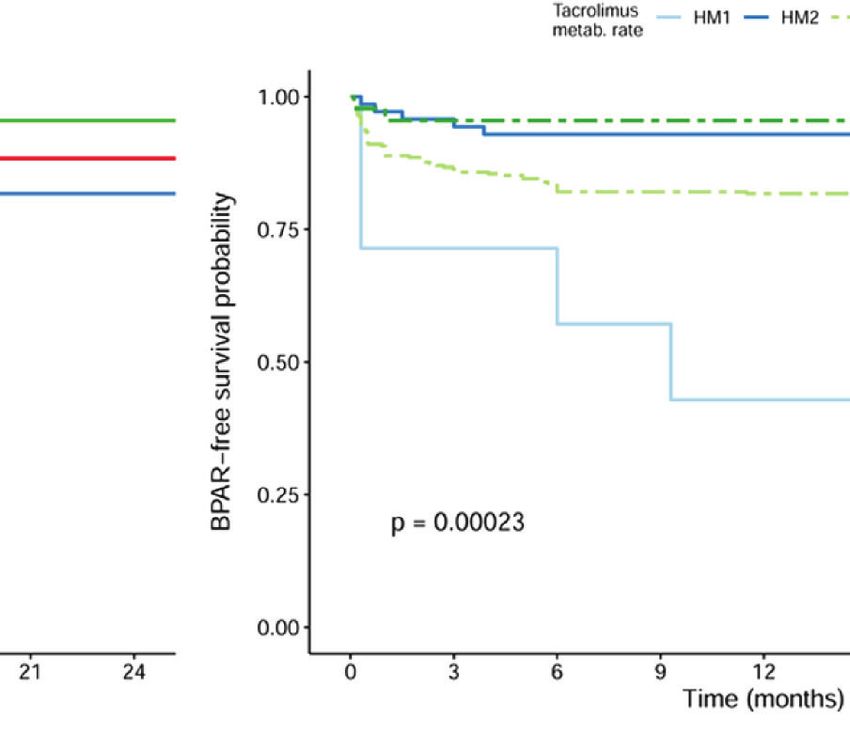
Crespo et al.                                                                                                             Improving Rejection-Risk Stratification in Transplantation

TABLE 3 | Univariate and Multivariate Cox analyses for clinical and immunological variables associated with the risk of BPAR.

                                                                  Univariate                                                            Multivariate

BPAR                                                      HR                   p-value                   HR                   95% CI                   95% CI                  p-value

Cold ischemia time > 13 hr                              1.036                   0.886
Recipient ethnicity                                     0.968                   0.949
Donor age > 65 yr                                       0.924                   0.787
Donor type (living)                                     0.776                   0.318
Kidney transplant index                                 1.464                   0.285
HLA MM (0 to 6. A, B, DR and DQ)                         1.11                   0.273
PM1                                                      REF                                            REF
HM1                                                     15.978                  0.001                  12.566                   1.99                   79.348                   0.007
HM2                                                      1.51                   0.590                  1.398                    0.266                  7.357                    0.692
IM                                                       4.33                   0.042                  4.532                    1.104                  18.599                   0.036
DST                                                      2.58
Crespo et al. Improving Rejection-Risk Stratification in Transplantation
persistent independent deleterious effects of preformed DSAs patients not receiving rATG, strongly suggests that T-cell
and DSTs on the risk of BPAR, independent of these distinct depletion induction therapy mitigates the risk of early low
TAC-metabolizing phenotypes. Most notably, a significant TAC exposures, conferring a protective umbrella in patients
protective effect on the risk of BPAR was observed with the with insufficient immunosuppressive coverage, with HM patients
use of T cell-depleting agents such as rATG in the setting of the most suitable group. Alternatively, earlier TAC initiation or
TAC underexposure. higher TAC dosage could eventually also counterbalance this
In the last years, an important body of evidence has shown the deleterious effect.
relevance of specific SNPs of the two main variants of the CYP3A Another interesting finding in this work is that we confirm
TAC-metabolism enzymes (CYP3A4*22 and CYP3A5*3), leading the independent negative effect of preformed DSTs and DSAs on
to distinct functional phenotypes influencing TAC dose the risk of BPAR. Previous studies by our group and others have
requirements to achieve whole blood pre-dose concentrations reported a strong association between pretransplant DSTs and
(C0) in kidney transplant recipients (21–26). In line with increased risk of BPAR, particularly TCMR, during the early
previous reports, we here show the impact of the two main period after transplantation, especially in patients not receiving T
CYP3A SNPs, on both TAC C0 and TAC dose requirements; cell-depleting induction therapies (3, 18, 19). Indeed, induction
indeed, HM1/2 had a significantly lower TAC dose-adjusted C0 protocols using rATG have marked lymphopenia effects
ratios than IM, and PM patients had significantly higher TAC resulting in subsequent induction of apoptosis and/or anergy
dose-adjusted C0 ratios compared with IM patients. It is (20). In line with these observations, although not significant, the
interesting to observe that while the prevalence of each gene interaction effect between rATG and DSTs showed a clinically
variant is largely dependent on the ethnicity of the patients, in relevant trend (HR < 1), reducing the risk of BPAR. To note,
our study, mainly represented by Caucasian kidney transplant while no additional deleterious effect was observed within HM
recipients, there was a small but significant proportion of patients with preformed DSTs or DSAs as compared to those
CYP3A5 expressers and CYP3A4*22 allele carriers, which led patients with an IM or PM phenotype, the low number of
to a representative number of patients with a distinct global immunological events within each pharmacogenetic phenotype
TAC-metabolizing capacity. with preformed DSA or DST group may have precluded
Nevertheless, while genotype-based adjustment of TAC doses detecting statistical differences.
in the initial course of kidney transplantation has been shown to Our study has some limitations. Despite the high number of
be useful to more accurately and rapidly reach the target C0 patients evaluated, the ethnicity of our study population, which is
shortly after transplantation, no advantages have been representative of most European kidney transplant programs,
demonstrated in terms of improved clinical outcomes when was mostly Caucasian; thus, certain CYP3A SNPs were less
prospectively assessed (27, 28). Here, by using this new represented. Nevertheless, the similar distribution of main
categorization considering the functional *1 allele, we observed demographic, clinical, and immunological risk factors within
that while CYP3A HM1 patients are at higher risk of BPAR and all CYP3A pharmacogenetic clusters significantly
TCMR as compared to other clusters, PM transplant recipients counterbalance this constraint. We also acknowledge that there
seem to display a significantly lower BPAR risk as compared to are other relevant variables that may directly influence TAC
other CYP3A clusters. Unexpectedly, the IM cluster showed a pharmacokinetics variability in whole blood in addition to the
deleterious effect on the global BPAR risk over PM but also over CYP3A genotypes, such as patient hematocrit, weight,
the HM2 group. These findings might be explained by the high corticosteroid dose, and a reduction of the hepatic function.
number of patients in the IM group, which is the most frequent Nevertheless, the impact of the TAC-metabolizing CYP3A
in our population, thus inferring more heterogeneity among this genotypes on TAC dose requirements to achieve whole blood
group than the probably much more homogeneous HM1/2 and pre-dose concentrations highlights the important effects of the
PM1 groups. Nonetheless, when evaluating their impact on individual genetic susceptibility on TAC blood exposure. We did
TCMR only, now the HM1 phenotype was revealed the most not include subclinical rejections; thus, a number of additional
relevant factor driving this type of rejection. Therefore, the study immune-mediated events may have occurred in our study
of TAC CYP3A pharmacogenetic variants should be encouraged, population and have not been taken into account. Finally, the
especially among study cohorts with a greater representation of short follow-up period of the study may not have allowed us to
non-Caucasian individuals. observe some additional deleterious impacts in the long term.
Importantly, we confirm that patients developing BPAR were In conclusion, the results of our study strongly suggest that
significantly underexposed to TAC than patients not developing implementing pretransplant anti-donor alloimmune memory,
BPAR. Indeed, the effect of early low TAC exposure (trough both humoral and cellular, together with the individual genetic
levels below 5 ng/ml) barely independently correlated to BPAR, TAC-metabolizing susceptibility may significantly refine
thus underscoring that initial low TAC trough levels may current immune-risk stratification of kidney transplant
facilitate anti-donor alloimmune activation triggering allograft candidates prior to transplantation and may help in guiding
rejection. Moreover, a significant interaction between rATG and treatment decision-making in a more personalized manner.
low TAC exposure was observed, leading to a reduction in the Notably, these data warrant the development of large,
risk of BPAR. This interaction, together with the finding of the prospective biomarker-guided trials, preferentially within
independent predictive value of TAC subexposure among multicenter international consortia.
Frontiers in Immunology | www.frontiersin.org 11 June 2022 | Volume 13 | Article 869554Crespo et al. Improving Rejection-Risk Stratification in Transplantation
DATA AVAILABILITY STATEMENT FUNDING
The original contributions presented in the study are included in This work was supported by the Instituto de Salud Carlos III
the article/Supplementary Material, further inquiries can be (ISCIII) (grant numbers PI16/01321, PI19/01710, and PI18/
directed to the corresponding authors. P1740) (co-funded by European Regional Development Fund,
ERDF, a way to build Europe). Also, this work was partly
supported by the SLT002/16/00183 grant, from the
Department of Health of the Generalitat de Catalunya by the
ETHICS STATEMENT call “Acció instrumental de programes de recerca orientats en
l’àmbit de la recerca i la innovació en salut.” The authors thank
The studies involving human participants were reviewed and
the Research Centers of Catalonia (CERCA) Programme/
approved by the Investigator Research Board of Bellvitge
Generalitat de Catalunya for institutional support. OB was
University Hospital. The patients/participants provided their
awarded an intensification grant from the “Instituto de Salud
written informed consent to participate in this study.
Carlos III” [NT19/00051].
AUTHOR CONTRIBUTIONS ACKNOWLEDGMENTS
This article has been approved by all authors. NL and OB We acknowledge our Biobank unit at IDIBELL and Ms Gema
participated in the research design. EC, MS, SM, MM, and AT Cerezo, Ms Iris Alvarez-Teubel, and Ms Mariona Juvé in our
conducted the immune assay experiments. AV-A and PF laboratory for carefully processing and managing all biological
performed the genotyping analysis. AS, MM, AF, JC, JG, FM, samples. We are also grateful to Esther Castaño from the
PR, and OB performed the clinical follow-up of patients of the Scientific and Technological Center at the University of Barcelona.
study and the collection of clinical data. MG analyzed the
histology. EC, AV-A, TJ, SM, LD, PH, OV, FB, NL, and OB
performed the data collection and analysis. EC, TJ, NL, and OB SUPPLEMENTARY MATERIAL
wrote the article. PR, JG, NL, and OB developed refined study
concepts, finalized the article draft, and secured the funding. All The Supplementary Material for this article can be found online
authors listed have made a substantial, direct, and intellectual at: https://www.frontiersin.org/articles/10.3389/fimmu.2022.
contribution to the work and approved it for publication. 869554/full#supplementary-material
Function at 6 and 12 Months in Renal-Transplant Recipients. Transplantation
REFERENCES (2004) 78(11):1640–6. doi: 10.1097/01.tp.0000144057.31799.6a
1. Heeger PS. T-Cell Allorecognition and Transplant Rejection: A Summary and 9. Koyama I, Nadazdin O, Boskovic S, Ochiai T, Smith RN, Sykes M, et al.
Update. Am J Transplan (2003) 3(5):525–33. doi: 10.1034/j.1600- Depletion of CD8 Memory T Cells for Induction of Tolerance of a Previously
6143.2003.00123.x Transplanted Kidney Allograft. Am J Transpl (2007) 7(5):1055–61.
2. Valujskikh A. Memory T Cells in Allograft Rejection. Adv Exp Med Biol doi: 10.1111/j.1600-6143.2006.01703.x
(2007) 601:247–56. doi: 10.1007/978-0-387-72005-0_26 10. Kroemer A, Xiao X, Vu MD, Gao W, Minamimura K, Chen M, et al. OX40
3. Issa F, Schiopu A, Wood KJ. Role of T Cells in Graft Rejection and Controls Functionally Different T Cell Subsets and Their Resistance to
Transplantation Tolerance. Expert Rev Clin Immunol (2010) 6(1):155–69. Depletion Therapy. J Immunol (2007) 179(8):5584–91. doi: 10.4049/
doi: 10.1586/eci.09.64 jimmunol.179.8.5584
4. Patel R, Terasaki PI. Significance of the Positive Crossmatch Test in Kidney 11. Neujahr DC, Chen C, Huang X, Markmann JF, Cobbold S, Waldmann H,
Transplantation. N Engl J Med (1969) 280(14):735–9. doi: 10.1056/ et al. Accelerated Memory Cell Homeostasis During T Cell Depletion and
NEJM196904032801401 Approaches to Overcome it. J Immunol (2006) 176(8):4632–9. doi: 10.4049/
5. Crespo E, Lucia M, Cruzado JM, Luque S, Melilli E, Manonelles A, et al. Pre- jimmunol.176.8.4632
Transplant Donor-Specific T-Cell Alloreactivity is Strongly Associated With 12. Ayasoufi K, Yu H, Fan R, Wang X, Williams J, Valujskikh A. Pretransplant
Early Acute Cellular Rejection in Kidney Transplant Recipients Not Receiving Antithymocyte Globulin has Increased Efficacy in Controlling Donor-
T-Cell Depleting Induction Therapy. PloS One (2015) 10(2):e0117618. Reactive Memory T Cells in Mice. Am J Transpl (2013) 13(3):589–99.
doi: 10.1371/journal.pone.0117618 doi: 10.1111/ajt.12068
6. Bestard O, Cruzado JM, Lucia M, Crespo E, Casis L, Sawitzki B, et al. 13. Pearl JP, Parris J, Hale DA, Hoffmann SC, Bernstein WB, McCoy KL, et al.
Prospective Assessment of Antidonor Cellular Alloreactivity is a Tool for Immunocompetent T-Cells With a Memory-Like Phenotype are the
Guidance of Immunosuppression in Kidney Transplantation. Kidney Int Dominant Cell Type Following Antibody-Mediated T-Cell Depletion. Am J
(2013) 84(6):1226–36. doi: 10.1038/ki.2013.236 Transpl (2005) 5(3):465–74. doi: 10.1111/j.1600-6143.2005.00759.x
7. Montero N, Farouk S, Gandolfini I, Crespo E, Jarque M, Meneghini M, et al. 14. Bestard O, Cassis L, Cruzado JM, Torras J, Franquesa M, Gil-Vernet S, et al.
Pretransplant Donor-Specific Ifng ELISPOT as a Predictor of Graft Rejection: Costimulatory Blockade With Mtor Inhibition Abrogates Effector T-Cell
A Diagnostic Test Accuracy Meta-Analysis. Transplant Direct (2019) 5(5): Responses Allowing Regulatory T-Cell Survival in Renal Transplantation.
e451. doi: 10.1097/TXD.0000000000000886 Transpl Int (2011) 24(5):451–60. doi: 10.1111/j.1432-2277.2011.01223.x
8. Nickel P, Presber F, Bold G, Biti D, Schönemann C, Tullius SG, et al. Enzyme- 15. Ekberg H, Tedesco-Silva H, Demirbas A, Vı́tko S, Nashan B, Gürkan A, et al.
Linked Immunosorbent Spot Assay for Donor-Reactive Interferon-Gamma- Reduced Exposure to Calcineurin Inhibitors in Renal Transplantation. N Engl
Producing Cells Identifies T-Cell Presensitization and Correlates With Graft J Med (2007) 357(25):2562–75. doi: 10.1056/NEJMoa067411
Frontiers in Immunology | www.frontiersin.org 12 June 2022 | Volume 13 | Article 869554Crespo et al. Improving Rejection-Risk Stratification in Transplantation
16. Pascual J, Berger SP, Witzke O, Tedesco H, Mulgaonkar S, Qazi Y, et al. 28. De Meyer M, Haufroid V, Kanaan N, Darius T, Buemi A, De Pauw L, et al.
Everolimus With Reduced Calcineurin Inhibitor Exposure in Renal Pharmacogenetic-Based Strategy Using De Novo Tacrolimus Once Daily After
Transplantation. J Am Soc Nephrol (2018) 29(7):1979–91. doi: 10.1681/ Kidney Transplantation: Prospective Pilot Study. Pharmacogenomics (2016)
ASN.2018010009 17(9):1019–27. doi: 10.1111/ajt.12286
17. Staatz CE, Tett SE. Clinical Pharmacokinetics and Pharmacodynamics of 29. Ashoor I, Najafian N, Korin Y, Reed EF, Mohanakumar T, Ikle D, et al.
Tacrolimus in Solid Organ Transplantation. Clin Pharmacokinet (2004) 43 Standardization and cross validation of alloreactive IFNg ELISPOT assays
(10):623–53. doi: 10.2165/00003088-200443100-00001 within the clinical trials in organ transplantation consortium. Am J Transpl
18. KershnerRP,FitzsimmonsWE.RelationshipofFK506WholeBloodConcentrations (2013) 13(7):1871–9. doi: 10.1111/ajt.12286
and Efficacy and Toxicity After Liver and Kidney Transplantation. Transplantation 30. Bestard O, Crespo E, Stein M, Lú cia M, Roelen DL, de Vaal YJ, et al. Cross-
(1996) 62(7):920–6. doi: 10.1097/00007890-199610150-00009 Validation of IFN-g Elispot Assay for Measuring Alloreactive Memory/
19. Israni AK, Riad SM, Leduc R, Oetting WS, Guan W, Schladt D, et al. Effector T Cell Responses in Renal Transplant Recipients. Am J Transpl
Tacrolimus Trough Levels After Month 3 as a Predictor of Acute Rejection (2013) 13(7):1880–90. doi: 10.1111/ajt.12285
Following Kidney Transplantation: A Lesson Learned From DeKAF 31. Haas M, Sis B, Racusen LC, Solez K, Glotz D, Colvin RB, et al. Banff 2013
Genomics. Transpl Int (2013) 26(10):982–9. doi: 10.1111/tri.12155 Meeting Report: Inclusion of C4d-Negative Antibody-Mediated Rejection and
20. Richards KR, Hager D, Muth B, Astor BC, Kaufman D, Djamali A. Tacrolimus Antibody-Associated Arterial Lesions. Am J Transpl (2014) 14(2):272–83.
Trough Level at Discharge Predicts Acute Rejection in Moderately Sensitized doi: 10.1111/ajt.12590
Renal Transplant Recipients. Transplantation (2014) 97(10):986–91. doi: 10. 32. Loupy A, Haas M, Solez K, Racusen L, Glotz D, Seron D, et al. The Banff 2015
1097/TP.0000000000000149 Kidney Meeting Report: Current Challenges in Rejection Classification and
21. van Gelder T, van Schaik RH, Hesselink DA. Pharmacogenetics and Prospects for Adopting Molecular Pathology. Am J Transpl (2017) 17(1):28–
Immunosuppressive Drugs in Solid Organ Transplantation. Nat Rev 41. doi: 10.1111/ajt.14107
Nephrol (2014) 10(12):725–31. doi: 10.1038/nrneph.2014.172 33. Pallet N, Jannot AS, El Bahri M, Etienne I, Buchler M, de Ligny BH, et al.
22. Lloberas N, Elens L, Llaudó I, Padullé s A, van Gelder T, Hesselink DA, et al. Kidney Transplant Recipients Carrying the CYP3A4*22 Allelic Variant Have
The Combination of CYP3A4*22 and CYP3A5*3 Single-Nucleotide Reduced Tacrolimus Clearance and Often Reach Supratherapeutic
Polymorphisms Determines Tacrolimus Dose Requirement After Kidney Tacrolimus Concentrations. Am J Transpl (2015) 15(3):800–5. doi: 10.1111/
Transplantation. Pharmacogenet Genomics (2017) 27(9):313–22. doi: 10. ajt.13059
1097/FPC.0000000000000296
23. Thervet E, Anglicheau D, King B, Schlageter MH, Cassinat B, Beaune P, et al. Conflict of Interest: The authors declare that the research was conducted in the
Impact of Cytochrome P450 3A5 Genetic Polymorphism on Tacrolimus absence of any commercial or financial relationships that could be construed as a
Doses and Concentration-to-Dose Ratio in Renal Transplant Recipients. potential conflict of interest.
Transplantation (2003) 76(8):1233–5. doi: 10.1097/01.TP.0000090753
.99170.89 The reviewer L.R has declared a shared affiliation with the author T.J to the
24. Jacobson PA, Oetting WS, Brearley AM, Leduc R, Guan W, Schladt D, et al. handling editor at the time of review.
Novel polymorphisms associated with tacrolimus trough concentrations:
results from a multicenter kidney transplant consortium. Transplantation Publisher’s Note: All claims expressed in this article are solely those of the authors
(2011) 91(3):300–8. doi: 10.1097/TP.0b013e318200e991 and do not necessarily represent those of their affiliated organizations, or those of
25. Elens L, Bouamar R, Hesselink DA, Haufroid V, van der Heiden IP, van the publisher, the editors and the reviewers. Any product that may be evaluated in
Gelder T, et al. A New Functional CYP3A4 Intron 6 Polymorphism this article, or claim that may be made by its manufacturer, is not guaranteed or
Significantly Affects Tacrolimus Pharmacokinetics in Kidney Transplant endorsed by the publisher.
Recipients. Clin Chem (2011) 57(11):1574–83. doi: 10.1373/clinchem.
2011.165613 Copyright © 2022 Crespo, Vidal-Alabro,́ Jouve, Fontova, Stein, Mocka, Meneghini,
26. Elens L, van Schaik RH, Panin N, de Meyer M, Wallemacq P, Lison D, et al. Sefrin, Hruba, Gomà, Torija, Donadeu, Favà, Cruzado, Melilli, Moreso, Viklicky,
Effect of a New Functional CYP3A4 Polymorphism on Calcineurin Inhibitors' Bemelman, Reinke, Grinyo,́ Lloberas and Bestard. This is an open-access article
Dose Requirements and Trough Blood Levels in Stable Renal Transplant distributed under the terms of the Creative Commons Attribution License (CC BY).
Patients. Pharmacogenomics (2011) 12(10):1383–96. doi: 10.2217/pgs.11.90 The use, distribution or reproduction in other forums is permitted, provided the
27. Thervet E, Loriot MA, Barbier S, Buchler M, Ficheux M, Choukroun G, et al. original author(s) and the copyright owner(s) are credited and that the original
Optimization of Initial Tacrolimus Dose Using Pharmacogenetic Testing. Clin publication in this journal is cited, in accordance with accepted academic practice. No
Pharmacol Ther (2010) 87(6):721–6. doi: 10.1038/clpt.2010.17 use, distribution or reproduction is permitted which does not comply with these terms.
Frontiers in Immunology | www.frontiersin.org 13 June 2022 | Volume 13 | Article 869554You can also read