TECHNOLOGIES GROUP, INC - Q1 2022 Investor Presentation - May 2022

Page created by Melanie Brooks
 
CONTINUE READING
TECHNOLOGIES GROUP, INC - Q1 2022 Investor Presentation - May 2022
May 2022

TECHNOLOGIES
GROUP, INC.
Q1 2022 Investor Presentation
TECHNOLOGIES GROUP, INC - Q1 2022 Investor Presentation - May 2022
DISCLAIMER
Forward-Looking Statements and Other Information

This presentation contains forward-looking statements that are based on our management’s beliefs and assumptions and on information currently available to our management. Forward-looking statements include information concerning
our possible or assumed future results of operations, business strategies, technology developments, financing and investment plans, dividend policy, competitive position, industry and regulatory environment, potential growth opportunities
and the effects of competition. Forward-looking statements include statements that are not historical facts and can be identified by terms such as “anticipate,” “believe,” “could,” “estimate,” “expect,” “intend,” “may,” “plan,” “potential,” “predict,”
“project,” "seek," “should,” “will,” “would” or similar expressions and the negatives of those terms. Forward-looking statements involve known and unknown risks, uncertainties and other factors that may cause our actual results, performance or
achievements to be materially different from any future results, performance or achievements expressed or implied by the forward-looking statements. Given these uncertainties, you should not place undue reliance on forward-looking
statements. Also, forward-looking statements represent our management’s beliefs and assumptions only as of the date of this report. You should read this report with the understanding that our actual future results may be materially different
from what we expect.

The following is a summary of some of the material risks and uncertainties that could materially adversely affect Shoals Technologies Group, Inc.’s (the “Company’s”) business, financial condition and results of operations. You should read this
summary together with the more detailed description of each risk factor contained in the Company’s Annual Report on Form 10-K and, if applicable, any in the latest Form 10-Q: (i) if demand for solar energy projects does not continue to
grow or grows at a slower rate than we anticipate, our business will suffer; (ii) existing electric utility industry policies and regulations, and any subsequent changes, may present technical, regulatory and economic barriers to the purchase and
use of solar energy systems that may significantly reduce demand for our products or harm our ability to compete; (iii) our industry has historically been cyclical and experienced periodic downturns; (iv) if we fail to, or incur significant costs in
order to, obtain, maintain, protect, defend or enforce our intellectual property and other proprietary rights, our business and results of operations could be materially harmed; (v) if we are unable to protect the confidentiality of our trade
secrets, our business and competitive position would be harmed; (vi) acquisitions, joint ventures and/or investments, including our most recently announced acquisition of ConnectPV, and the failure to integrate acquired businesses, could
disrupt our business and/or dilute or adversely affect the price of our common stock; (vii) if our trademarks and trade names are not adequately protected, we may not be able to build name recognition in our markets of interest, and our
competitive position may be harmed; (viii) we may experience delays, disruptions or quality control problems in our manufacturing operations in part due to vendor concentration; (ix) the interruption of the flow of components and materials
from international vendors could disrupt our supply chain, including as a result of the imposition of additional duties, tariffs and other charges on imports and exports; (x) changes in the United States trade environment, including the
imposition of import tariffs, could adversely affect the amount or timing of our revenue, results of operations or cash flows; (xi) we face risks related to actual or threatened health epidemics, such as the COVID-19 pandemic, and other
outbreaks, which could significantly disrupt our manufacturing and operations; (xii) our future growth in the EV charging market is highly dependent on the demand for, and consumers’ willingness to adopt, EVs; (xiii) the reduction,
elimination or expiration of government incentives for, or regulations mandating the use of, renewable energy and solar energy specifically could reduce demand for solar energy systems and harm our business; (xiv) a drop in the price of
electricity sold may harm our business, financial condition, results of operations and prospects; (xv) an increase in interest rates, or a reduction in the availability of tax equity or project debt capital in the global financial markets could make it
difficult for end customers to finance the cost of a solar energy system and could reduce the demand for our products; (xvi) defects or performance problems in our products could result in loss of customers, reputational damage and
decreased revenue, and we may face warranty, indemnity and product liability claims arising from defective products; (xvii) our results of operations may fluctuate from quarter to quarter, which could make our future performance difficult to
predict and could cause our results of operations for a particular period to fall below expectations, resulting in a decline in the price of our Class A common stock; (xviii) compromises, interruptions or shutdowns of our systems, including those
managed by third parties, whether intentional or inadvertent, could lead to delays in our business operations and, if significant or extreme, affect our results of operations; (xix) our planned expansion could subject us to additional business,
financial, regulatory and competitive risks; (xx) our indebtedness could adversely affect our financial flexibility and our competitive position; (xxi) our indebtedness may restrict our current and future operations, which could adversely affect
our ability to respond to changes in our business and to manage our operations; (xxii) developments in alternative technologies may have a material adverse effect on demand for our offerings; (xxiii) we are a holding company and our
principal asset after completion of the reorganization is our interest in Shoals Parent and, accordingly, we are dependent upon Shoals Parent and its consolidated subsidiaries for our results of operations, cash flows and distributions; (xxiv) we
are required to make payments under the Tax Receivable Agreement and the amounts of such payments will be significant; (xxv) we will not be reimbursed for any payments made to the beneficiaries under the Tax Receivable Agreement in
the event that any purported tax benefits are subsequently disallowed by the IRS; (xxvi) as an emerging growth company within the meaning of the Securities Act, we may utilize certain modified disclosure requirements, and we cannot be
certain if these reduced requirements will make our Class A common stock less attractive to investors; (xxvii) provisions in our certificate of incorporation and our bylaws may have the effect of delaying or preventing a change of control or
changes in our management; (xxviii) our certificate of incorporation also provides that the Court of Chancery of the State of Delaware will be the exclusive forum for substantially all disputes between us and our stockholders, which could limit
our stockholders’ ability to obtain a favorable judicial forum for disputes with us or our directors, officers or employees; (xxix) future sales of our Class A common stock, or the perception that such sales may occur, could depress our Class A
common stock price; and (xxx) if we fail to implement and maintain effective internal controls over financial reporting, we may be unable to accurately or timely report our financial condition or results of operations, which may adversely
affect our business.

Except as required by law, we assume no obligation to update these forward-looking statements, or to update the reasons actual results could differ materially from those anticipated in these forward-looking statements, even if new
information becomes available in the future.

                                                                                                        © 2022 Shoals Technologies Group                                                                                                                  2
TECHNOLOGIES GROUP, INC - Q1 2022 Investor Presentation - May 2022
DISCLAIMER
Non-GAAP Financial Information

This presentation includes Adjusted EBITDA and Adjusted Net Income (which are shown in the reconciliations set forth in the Appendix hereto), which are unaudited financial measures that exclude items and therefore are not in accordance
with U.S. generally accepted accounting principles (“GAAP”). These are presented as supplemental measures of the Company’s performance.

The Company defines Adjusted EBITDA as net income (loss) plus (i) interest expense, net, (ii) income tax expense, (iii) depreciation expense, (iv) amortization of intangibles, (v) payable pursuant to the tax receivable agreement adjustment, (vi)
loss on debt repayment, (vii) equity-based compensation, (viii) acquisition-related expenses, (ix) COVID-19 expenses and (x) non-recurring and other expenses. The Company defines Adjusted Net Income as net income (loss) plus (i)
amortization of intangibles, (ii) payable pursuant to the tax receivable agreement adjustment, (iii) loss on debt repayment, (iv) amortization of deferred financing costs, (v) equity-based compensation, (vi) acquisition-related expenses, (vii)
COVID-19 expenses and (viii) non-recurring and other expenses, all net of applicable income taxes.

The Company presents non-GAAP measures because we believe they assist investors and analysts in comparing our performance across reporting periods on a consistent basis by excluding items that we do not believe are indicative of our
core operating performance. In addition, we use Adjusted EBITDA and Adjusted Net Income: (i) as factors in evaluating management’s performance when determining incentive compensation; (ii) to evaluate the effectiveness of our business
strategies; and (iii) because our credit agreement uses measures similar to Adjusted EBITDA and Adjusted Net Income a to measure our compliance with certain covenants. The presentation of non-GAAP financial measures is not intended to
be a substitute for, and should not be considered in isolation from, the financial measures reported in accordance with GAAP.

Please see the Appendix for the reconciliations of certain non-GAAP financial measures to the comparable GAAP measures

Market and Industry Data

This presentation also contains information regarding the Company’s market and industry that is derived from third-party research and publications. That information may rely upon a number of assumptions and limitations, and the Company
has not independently verified its accuracy or completeness.

                                                                                                      © 2022 Shoals Technologies Group                                                                                                                  3
TECHNOLOGIES GROUP, INC - Q1 2022 Investor Presentation - May 2022
AGENDA

         01               Company Overview

         02               Technology and Value Proposition

         03               Growth Strategy

         04               Financial Overview and Business Update

         © 2022 Shoals Technologies Group                          4
TECHNOLOGIES GROUP, INC - Q1 2022 Investor Presentation - May 2022
COMPANY OVERVIEW
TECHNOLOGIES GROUP, INC - Q1 2022 Investor Presentation - May 2022
WHO WE ARE

         Leading Provider of Electrical                                         Sell patented products that are less                                          Focus on selling complete systems
          Balance of System (“EBOS”)                                             costly to install and more reliable                                                rather than individual
           solutions for solar energy                                                 than competing solutions                                                           components

    Products used on approximately 50% of                                       Install faster ⇒ fewer labor hours than                                     73% of revenues from “system solutions”
     all U.S. solar capacity installed in 2021(1)                                 conventional products                                                        that include multiple products(2)

    Significantly larger than next largest                                      Without licensed electricians ⇒ designed                                    Each system is custom designed for the
     competitor                                                                   to be installed by general labor                                             customer’s project

    Growing rapidly and taking share ⇒ 22%                                      With greater reliability ⇒ fewer                                            Highly consultative sales process that
     CAGR in revenues from 2019-2021                                              connections and pre-terminated “plug-n-                                      creates 12+ months of visibility
                                                                                  play” connectors

(1) Estimated based on 11.1 GWs of products shipped for the year ended December 31, 2021 and an estimate of 20.6 GWs of total utility scale solar installations over the same period per IHS Markit PV Installations Tracker Q1-
    2022, March 2022.
(2) For the twelve months ended December 31, 2021.

                                                                                             © 2022 Shoals Technologies Group                                                                                                      6
TECHNOLOGIES GROUP, INC - Q1 2022 Investor Presentation - May 2022
OUR PRODUCTS
                                                          MISSION CRITICAL EBOS COMPONENTS

                                                                                                                 AC HIGH VOLTAGE(1)
                                                                                                                 DC FEEDER CABLE(1)

    WIRELESS                           JUNCTION        RECOMBINERS
   MONITORING                           BOXES

       INLINE                          CABLE             SPLICE
       FUSES                         ASSEMBLIES           BOX

    COMBINERS                       DISCONNECTS         TRANSITION
                                                           BOX

                                                                     © 2022 Shoals Technologies Group                                 7
(1) EBOS   products not currently offered by Shoals.                          © 2022 Shoals Technologies Group                        7
TECHNOLOGIES GROUP, INC - Q1 2022 Investor Presentation - May 2022
EBOS IS AN ATTRACTIVE SEGMENT…

Must Have Product…
                          EBOS is required for every solar project regardless of size,             Creates…
                          location or technology

                                                                                                Low technology risk
…That’s Technology
                          EBOS works with all types of panels, mounting systems and inverters
Agnostic…

                                                                                                Strong preference for
…With a High              Failures can have major consequences including lost revenue,          incumbent suppliers
Consequence of Failure…   equipment damage, fire damage, injury or death

…Where Price Isn’t                                                                              Low price pressure
                          EBOS is 6% of total project cost and single components are
TECHNOLOGIES GROUP, INC - Q1 2022 Investor Presentation - May 2022
…THAT’S
                                                                                                                                Compound Annual Growth Rate in
GROWING FASTER                                                                                                            Addressable Market for EBOS from 2020 to 2023
THAN THE OVERALL SOLAR MARKET
                                                                                                                                                                                                   + 3%              + 26%

                                                                                                                                                               + 1.5%             23%
EBOS market has several                                                                                                                         + 2%
growth accelerants                                                                                                             + 3%

         Primarily ground mount, which is growing faster                                                       17%
         than the overall market

         Beneficiary of battery energy storage – both new
         and retrofits

         Rip and replace of existing solar fleet

         EBOS for emerging EV charging market

(1) Based on IHS Solar Market Tracker – North America: First Half 2021, February 2021.
(2) Based on Wood Mackenzie U.S. Utility Solar-Plus-Storage: The Rise of Hybridization, August
    2020. Assumes EBOS for solar + storage requires an additional 3¢ per watt of solar capacity.
(3) Assumes 5% of the utility scale solar fleet in operation at the end of 2018 (37.4 GW) is
                                                                                                             U.S. Solar     Ground Mount    Battery Energy Rip & Replace of    Solar EBOS       EV Charging        Total EBOS
    replaced with new EBOS in 2023 at an average cost of 3.5¢ per watt.                                      Market(1)         Solar(1)       Storage –       Operating       Market Growth   Infrastructure(4)   Market Growth
(4) Based on BloombergNEF Charging Infrastructure Forecast Model (CIFM), January 2021.                                                     New Projects and Capacity due to
    Assumes none of “Hardware” spending was addressable in 2020 and 30% of “Hardware”                                                         Retrofits(2)    Failures(3)
    spending is addressable in 2023.
Note: Assumes constant ASPs.

                                                                                                   © 2022 Shoals Technologies Group                                                                                          9
TECHNOLOGIES GROUP, INC - Q1 2022 Investor Presentation - May 2022
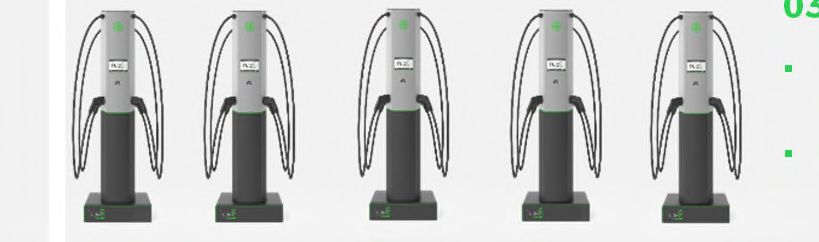
12   I would move 3 to 2 and add comment about best value for 3

                               WE HAVE A SIMPLE MISSION

             01                Create products that can be installed by anyone

             02                Move assembly from the field to the factory

             03                Leverage the factory environment to produce products with
                               superior quality, reliability and safety

                                                                  © 2022 Shoals Technologies Group   10
REDUCING INSTALLATION COST IS CRITICAL
                                                           FOR CONTINUED COST REDUCTION IN SOLAR

                     Contribution of Equipment vs. Installation                                                                       Hourly Wages For Field Labor vs. Total Installed
                       to the Cost of a Solar Energy Project(1)                                                                                 Cost of Utility Scale Solar

                      9%                                          11%
                                                                                    70%+                                                                                                                            +20%
                     17%                                                            Increase in the
                                                                  29%               contribution of
                                                                                                                       100
                                                                                    installation to total
                                                                                    cost over past 5 years

                     74%
                                                                  60%

                                                                                                                                                                                                                    -78%
                    2015                                          2020
                                                                                                                          0
                    Equipment Cost          Installation Cost       All Other                                                  2010     2011     2012     2013     2014     2015     2016     2017     2018     2019

         Field labor has become one of the largest contributors to the cost
                                                                                                                                 …and hourly wages for construction workers are only rising
                         of building a solar energy project…

(1) Wood Mackenzie H1 2020 U.S. Solar PV System Pricing, June 2020. Based on average construction cost for a 50 MW ground-mounted solar energy project using single-axis trackers in the U.S. Installation cost includes labor,
    civil and EPC overhead and margin categories. Equipment costs include modules, inverter, mounting system and EBOS categories.
(2) Based on Bureau of Labor Statistics, Department of Labor annual mean wage data for 47-0000 Construction and Extraction Occupations.
(3) Installed cost of utility-scale solar using single-axis trackers per BloombergNEF 2H 2020 U.S. Renewable Energy Market Outlook, October 2020.

                                                                                            © 2022 Shoals Technologies Group                                                                                                 11
WE FOCUS ON CUSTOM “SYSTEM SOLUTIONS”

       Revenue Mix For the Year                                            System Solutions bundle…
       Ended December 31, 2021
                                                                            Proprietary components
                                                                            Pre-construction design and engineering,
                                                                             including specifying and optimizing the system
                                                                            Proprietary installation methods
                                                                            Technical support
27%
                                            73%                            System Solutions create…
                                                                            High customer engagement through a
                                                                             consultative sales process
                                                                            Revenue visibility ⇒ 12 months of lead time on
                                                                             most orders

      System Solutions   Solar Components                                   Higher margins
                                                                            Barriers to entry for competitors

                                             © 2022 Shoals Technologies Group                                                 12
PROVEN FINANCIAL PERFORMANCE

                 Revenues ($mm)                                Gross Profit ($mm)                  Adjusted EBITDA ($mm)

                                                  $213

                                                                                             $83                    $63
                                                                                                            $61
                               $176

                                                                             $67
            $144

                                                                                                    $37
                                                              $44

             2019              2020               2021        2019          2020            2021    2019    2020    2021

Note: See Appendix for reconciliation of non-GAAP measures.

                                                               © 2022 Shoals Technologies Group                            13
OUR COMMITMENT TO ESG
                                                                                               Safety is Our First Priority
     U.S. solar projects                                                                      Proactive safety environment
                                                                                            reflected in FY 2020 TRIR of 0.88
     shipped since 2017
     that use our products
     will annually offset…(1)                                        Greenhouse                                                            ISO 9001:2015
                                                                   Gas Emissions                                                           Certified to rigorous
      CO2: 19.7 million MT                                            Reduction                                                           quality management
                                                                                                                                           standards
      NOx: 11,389 MT                                                                                                                                                             Respect for our
                                                                                                                                                                                  customers, employees
      SO2: 11,343 MT
                                                                                                                                                                                  and the communities
      Particulate: 1,364 MT                                                                                                                                                      where we operate is
                                                           Water Withdrawals                                                               Shoals Commitment                      core to our culture
                                                                   Reduction(1)                                                            to Responsible
                                                            14.7 trillion gallons                                                          Business Principles                     Mandatory onboarding for all
                                                                                                                                                                                    employees to company
                                                                                                                                                                                    business principles

As a public company, we will                                                                          Recycling                                                                   Strong governance for pay
                                                                                                                                                                                    equity across roles, with third
   report ESG metrics using the                                                                Recycling program includes
                                                                                                                                                                                    party review
   SASB framework                                                                              substantially all waste from
                                                                                                 manufacturing inputs
  (1) Annual offsets estimated based on the emissions avoided by generating electricity with solar PV projects with cumulative capacity equivalent to Shoals’ shipments of solar products and solutions from January 1, 2017
  through December 31, 2020 as follows: (i) CO2, sulfur dioxide, nitrogen oxides, and particulate matter from 2019 national emission factors in EPA AVERT v3.0 Avoided Emission Factors 2017–2019 (September 2020); (ii) water
  withdrawals of solar PV compared to the weighted average of median natural gas and coal withdrawals per EIA 2019 data and “Operational Water Consumption and Withdrawal Factors for Electricity Generating Technologies: A
  Review of Existing Literature,” by Jordan Macknick et al., in Environmental Research Letters, Vol. 7, No. 4; December 20, 2012; and (iii) annual average capacity factor of 25.3% provided by EPA AVERT and 1.25 DC to AC
  conversion factor.

                                                                                             © 2022 Shoals Technologies Group                                                                                              14
TECHNOLOGY AND
VALUE PROPOSITION
EBOS IS A UNIQUE CATEGORY
                                         Cheap to buy…                                                                                              …but expensive to install

                  Contribution to Construction Cost (¢ per watt)                                                                 EBOS Contribution to Installation Cost (¢ per watt)(1)
                        50MW Solar Project Using Trackers                                                                                50MW Solar Project Using Trackers
                                                           11%
                                                           Other(2)
                          29%                                         12%                                                                                                         36%
                Installation(1)                                       Mounting System                                                                                             EBOS
                                                                                                                                                                          9.2 ¢   Installation(3)
                                                                           6%
                                            90.6 ¢               5.6 ¢     EBOS
                                                                                        Represents
                                                                         4%                                                                               16.6 ¢                         9.2 ¢
                                                                                         multiple                                                                                                = 1.6X
                                                                         Inverter      components                                                                                        5.6 ¢
                                                                                                                                                 64%
                                                                                                                                           All Other                                  Installation costs
                                  39%                                                                                                    Installation                                1.6x more than the
                                                                                                                                                                                        product itself
                          Solar Panels

                   The cost of installing an EBOS component can be equal to, or in excess of, the cost of the product itself,
                     which creates opportunities for high value innovation in product design and installation methods
Source: Wood Mackenzie H1 2020 U.S. Solar PV System Pricing, June 2020. Estimate for 50 MW site using single-axis trackers. Figures do not sum to 100% due to rounding.
(1) Includes labor, civil, and EPC overhead & margin categories.
(2) Includes design & engineering, permitting, logistics and taxes categories.
(3) Management estimates based on feedback from Tier 1 EPCs.

                                                                                            © 2022 Shoals Technologies Group                                                                               16
CONVENTIONAL HOMERUN EBOS SYSTEMS HAVE

                                          THREE BIG ISSUES

 Installation methods that require                  Redundant wiring that wastes                 Too much work done in the field
   electricians and special tools                        time and material                       where it’s hard to control quality

• Trenching                                      • Every string requires two wire runs           • Every connector fabricated onsite

• Underground conduit                            • Same distances covered multiple times         • “Crimped” connections prone to faults

• Six step process for every connection          • Multiple intermediate interconnection         • Systems vulnerable to human error
                                                   points (combiner boxes)
• Complex wiring architecture                                                                    • Significant rework

                                          Result = High installation costs and low reliability

                                                        © 2022 Shoals Technologies Group                                                   17
CONVENTIONAL HOMERUN EBOS REQUIRES
THOUSANDS OF WIRE RUNS & CONNECTIONS
30 PANELS PER STRING          24 STRINGS PER COMBINER             8 COMBINERS PER INVERTER       1 2.2 MW INVERTER

                                                                                             400 wire runs
                                                                                             2,192 connections
                                                                                             for every 2.2 MW inverter!

  Pos + Neg Wire Run

             A 100 MW solar project using conventional homerun EBOS will require approximately
                       18,000 individual wire runs and 100,000 connections
                                             © 2022 Shoals Technologies Group                                        18
INSTALLING CONVENTIONAL HOMERUN EBOS REQUIRES

                           LICENSED ELECTRICIANS

    LAY               MEASURE                STRIP                          CRIMP           INSPECT              INSTALL
Lay the wire out      Measure out the        Strip the                    Crimp on the       Inspect work     Install the finished
 to cut the wire    appropriate length to   cable jacket                appropriate end     for any defects   product down the
    to length      expose the copper wire                                (either positive                      row and into the
                                                                           or negative)                         combiner box

           Conventional Homerun EBOS requires a large number of time consuming, manual operations
                that need to be performed in the field using licensed electricians with special tools

                                                  © 2022 Shoals Technologies Group                                              19
SHOALS’ COMBINE-AS-YOU-GO SYSTEM
                         SOLVES THE ISSUES WITH CONVENTIONAL HOMERUN EBOS

 Big Lead Assembly (“BLA”)              Interconnect Harness                               Plug-n-Play Connectors

                                                                                          Simple push connectors speed
 Proprietary above ground feeder    Pre-fabricated wire harnesses with                 installation, reduce errors and make
  cable eliminates underground       inline fuses eliminate measuring,                  the system installable by general
conduits and combiner boxes and      cutting and crimping in the field                      labor rather than requiring
    installs using general labor     and reduce individual wire runs                            licensed electricians

                                                © 2022 Shoals Technologies Group                                                   20
 .                                                  © 2022 Shoals Technologies Group                                          20
THE SIX ADVANTAGES
                                   OF SHOALS’ COMBINE-AS-YOU-GO SYSTEM

       01                  02                    03                             04                  05                      06

     Can be             Enables              Reduces                                                                   Reduces
    installed        above-ground           wire runs                     Eliminates         Increases safety        maintenance
   by anyone          installation         dramatically                 combiner boxes        and reliability        requirements

    Plug-n-play        Hung from          Strings combined              Direct connections    Pre-terminated           Everything
  push connectors   mounting structure        in the row               between components       connectors            above ground

   Installable by     No trenching           67% Fewer                         Inline        Factory rather than     Less potential for
   general labor    or buried conduit        string runs                       fusing          field fabricated      installation errors

  No electricians        No wire              95% Fewer                     No complex          Fewer failure      83% Fewer connection
    required             fishing             inverter runs                    wiring               points            points to maintain

LOWER LABOR RATES                                                      LOWER LABOR RATES,                            LOWER ONGOING
                                         FEWER LABOR HOURS                                    LESS POTENTIAL
 AND FEWER LABOR     NO EXCAVATION                                     FEWER LABOR HOURS                              MAINTENANCE
                                          AND LESS MATERIAL                                    FOR FAILURE
      HOURS                                                             AND LESS MATERIAL                               EXPENSE

                                                   © 2022 Shoals Technologies Group                                                        21
WHAT THE
 INDUSTRY
                                                       “     Shoals has the better mousetrap… You don’t
                                                               need licensed electricians which is huge
                                                                                   – Project Manager, Solar Developer
                                                                                                                     ”
 SAYS
 ABOUT US                                                                   “    On projects of 100MW, it’s a seven-figure swing [versus
                                                                                 homerun]. I really can’t think of a reason we wouldn’t use BLA
                                                                                                                                    – Director of Construction, EPC/Developer   ”
                                                       “   The BLA is driving costs out and improving reliability – it’s the big players that are
                                                           leading the charge, switching to BLA, and more people seem to be doing it all the time
                                                                                                                                                                                    ”
 43%                                                                                                                                              – Vice President, Major Solar EPC

                                                                       “                                                                                                        ”
                                                 (1)
 Lower Installation Cost                                                   I’ve been to [Shoals’] facility and they’re incredible from a
                                                                           manufacturing standpoint… I think they actually exceed six sigma
                                                                                                                                                              – Engineer, EPC

 20%
 Lower Material Cost
                                           (1)
                                                       “    I deal with 100 vendors and Shoals has to be the
                                                            top 5%. They provide really good technical service
                                                                                                                               ”
                                                                                                – Site Operations, Public Utility

                                                                       “                                                                                                        ”
(1) Cost savings and customer feedback based on
    GRAPH survey of 120 solar industry participants.
    Figures represent median of responses.
                                                                           I honestly have not seen a single competitor come close to Shoals
                                                                                                                      – Director of Construction, Major EPC and Developer
                                                                           © 2022 Shoals Technologies Group                                                                             22
PATENTS, CONSULTATIVE SALES PROCESS AND PROPRIETARY MANUFACTURING

                                CREATE A COMPETITIVE MOAT

   Patents limit competitors’ ability to                                       Most of what we sell are custom             Proprietary manufacturing process
   develop products than can replicate                                          solutions that require a highly             that enables high customization
      the benefits that ours provide                                              consultative sales process                   with very high throughput

     • 36 Issued and pending patents                                       • Each project is unique                        • 750,000+ Parts per week

     • Cover prerequisites for labor savings                               • Deep subject matter expertise required to     • ~450 Changeovers per week
                                                                             design, specify and optimize each system
                                                                                                                           • Specialized manufacturing equipment
                                                                           • Requires customer-facing applications           developed and built in-house
                                                                             engineering capabilities

Note: Parts per week and changeovers are rounded based on data for year ended December 31, 2021.

                                                                                        © 2022 Shoals Technologies Group                                           23
GROWTH STRATEGY
OUR GROWTH STRATEGY

                  01                                                  02                                                   03                                               04                                               05
                                                                                                                                                                                                                 Introduce Labor Saving
       Win the Customer and                            Grow Wallet Share with                               Grow Wallet Size with                                        Expand
                                                                                                                                                                                                                Solutions for EV Charging
       Take Share with BLA                          Complementary Solar Products                           Battery Storage Products                                  Internationally
                                                                                                                                                                                                                      Infrastructure

        Estimated BLA Share                                    EBOS Customer                                 EBOS Spend per Watt                                2023 Ground Mounted                                  U.S. Investment in
            in the U.S.(1) (2)                                   “Wallet”(3)                                                                                     Installations (GW)(6)                                  EV Charging
                                                                                                                                                                                                                    Infrastructure ($B)(7)
                                                                                                                           +55%        8.6 ¢                             4.0 x Larger
                                  60%+
                                                                                                                                                                                                                         31% CAGR         $1.2
                                                               2.1¢              2.0¢
                                                                                                                5.6 ¢
                         36%                                          5.6¢/W                                                                                                            99.4
               28%
                                                                                                                                                                                                                      $0.5

      7%                                                                 1.5¢                                                                                     24.6

                                                         Current Products    Target Products
      2017     2020      2021     Target                 Not Targeted                                           Solar(4)          Solar + Storage (5)             U.S.          International (ex.                   2020                2023
                                                                                                                                                                                     China)

(1)   Based on the total MWs of BLA products shipped in the period compared to the total MWs of ground mounted solar installed over the same period per Wood Mackenzie US Solar Capacity Data: Q2 2022.
(2)   For the years ended December 31, 2017, 2020 and 2021.
(3)   Based on Wood Mackenzie H1 2020 U.S. Solar PV System Pricing, June 2020, and management estimates. Estimate for 50 MW site using single-axis trackers.
(4)   Wood Mackenzie H1 2020 U.S. Solar PV System Pricing, June 2020. Estimate based on a 50 MW solar energy project with single-axis trackers.
(5)   NREL 2018 U.S. Utility-Scale Photovoltaics-Plus-Energy Storage System Costs Benchmark, November 2018. Based on average of NREL estimates for EBOS cost for two- and four-hour duration 60 MW battery storage systems. Assumes 1 MW of battery
      capacity for every 4 MW of solar capacity.
(6)   Based on MWs of ground mounted solar installed in 2023 per IHS Markit PV Installations Tracker Q4-2020, January 2021.
(7)   Estimated annual public and commercial EV charging infrastructure investment in the U.S. as per BloombergNEF Charging Infrastructure Forecast Model (CIFM), June 2021.

                                                                                                       © 2022 Shoals Technologies Group                                                                                                               25
BLA CONTINUES TO GAIN SHARE
                                  EPCs and Developers
    At IPO
(January 2021)              Today

  Converted                  Converted                                       Highlights

     4                 18
                              25                    More than six-fold increase in number of EPC and developer
                                                     customers since IPO

                 3                                  7 customers converted to BLA in Q1 2022 representing
In Transition               In Transition            approximately 2 GWdc

   10                         15
                       5                            16% increase in BLA funnel since Q4 2021

                                                    Secured 3 international BLA orders in Q1 2022

  Prospects                  Prospects

   11                  48
                              59
                 +60

                                 © 2022 Shoals Technologies Group                                                 26
NEW PRODUCT INTRODUCTIONS ARE ON SCHEDULE
                                                                                                             2021                                                 2022
                                                                                        Q1              Q2          Q3           Q4            Q1            Q2           Q3            Q4

                                                                                     Complete                                         Wire-Panel Interface
                               Wire Management
    • Safely secures cabling
                                                                                             Complete                                               Wire-Wire Interface
    • Replaces “zip ties” that have a high rate of failure
    • High margin product category                                                                Complete                                                        Wire-Structure Interface

                                                                                     Complete                                         Base Model
                           IV Curve Benchmarking
                                                                                                                                                     High Current Model
    • Plug-n-play string-level monitoring (current, temp, IV curve trace, incline)
                                                                                                   Complete
    • Real-time data at thousands of points across the system                                                                                                             High Voltage Model
    • Cuts truck rolls and facilitates targeted maintenance                                  Complete

             High Capacity Plug-n-play Wire Harnesses
    • Extends plug-n-play to high capacity feeder cable category
                                                                                     Complete
    • Creates additional labor savings versus current products and methods
    • Enables greater site design flexibility

                                     “BLA 2.0”
    • Incorporates significant portion of EBOS content not currently addressed
                                                                                             Complete
    • Comprehensive solution that takes more labor out of the field
    • Potential to substantially increase customer wallet share

                                                                                     ■ Product Engineering      ■ Validation & Certification   ■ Commercial Launch        ★ Target First Sales

                                                                       © 2022 Shoals Technologies Group                                                                                          27
EV CHARGING IS AN
                     ATTRACTIVE MARKET FOR SHOALS
       Rapidly Growing Demand                                                           High Labor Content                                    Inefficient Means & Methods
        Spending on Public & Commercial                                                   Public & Commercial
                                                                                                                                              Duplicative homeruns
           EV Charging Infrastructure                                                   EV Charging Infrastructure
                        ($ in millions)(1)                                                   % of spend by cost category(1)
                                                                                                                                              Expensive trenching / boring
                                                  $1,196

                                                                                                                                              Wire run in underground conduit
                              $879
                                                                                   44%                                        56%
                                                                                                                                              Fabrication of components in the field
          $589                                                                Hardware                                        Installation

                                                                                                                                              Complex interconnection of components

                                                                                                                                              Skilled labor and special tools

          2021                 2022                 2023

      Spend on EV charging stations is forecast to                                          More than half of the cost of an                     Time consuming and costly means and
              double from 2021 to 2023                                                       EV charging station is labor                          methods that require skilled labor

(1) Based on BloombergNEF Charging Infrastructure Forecast Model (CIFM 2.0.1), June 2021.

                                                                                            © 2022 Shoals Technologies Group                                                            28
CONVENTIONAL EV CHARGING SYSTEMS
                                                                        Dispensers

                                                                                                                    3-4 Individual Wire
                                                                                                                     Runs from Each
Disconnect                       Distribution Panel                                                                  Dispenser to the
  Switch       Transformer       Boards (Breakers)                                                                  distribution panel

                                                                                                                     Wire runs fished
                                                                                                                     through conduit
                                                                                                                    buried in trenches
     Multiple equipment vendors
     Components arrive on site at different times
     Complex interconnections

             Commercial EV chargers                   Every dispenser is individually connected   Wire runs are made through underground
          require multiple components,                   to the distribution panel with three          conduit that requires trenching
          often from different suppliers                          to four homeruns                              across the site

                                                             © 2022 Shoals Technologies Group                                             29
SHOALS EV CHARGING SYSTEM SOLUTIONS
                                   Shoals eMobility charging product focuses on four product families

01 Fuel Power Center                        02 Raceways                                                                                03 EV-BLA
                                                                                                                                        Patented trunk bus solution similar to
                                                                                                                                         solar BLA

                                                                                                                                        Eliminates individual homeruns from
                                                                                                                                         each dispenser. Reduces wire runs by
                                                                                                                                         up to 75%

                                                                                                                                        Capable of above-ground installation

                                                                                                                                        Utilizes plug-n-play connectors for
                                                                                                                                         rapid deployment

                                                                                                                                        Estimated total deployed cost
                                             Above-ground cable                                                                         reduction of 30-40%
                                              raceway that eliminates
 Prefabricated plug-n-play EV power          the need for trenching                                  04 Quick Connect Bases for Chargers
  center
                                             Compatible with both                                     Prefabricated skidded dispenser with up to four Level 2 charge points
 All components installed in the factory     conventional cabling and
                                                                                                       Flexible choice of charger OEM
                                              EV-BLA
 Modular Interlocking system                                                                          Designed to install at the intersection of four parking spots
                                             Reduces cost of
 Reduce site disruption and overall time     deployment and time on                                   Reduces placement (fewer pads), cabling and interconnection costs
  on site                                     site by up to 40%
                                                                                                       Ideal solution for fleets, retail, office and MUD

              Targeting 20-30% reduction in installed cost versus conventional solutions

                                                                        © 2022 Shoals Technologies Group                                                                          30
EV BUSINESS MARKET ENTRY TIMELINE
                                                                  Q1 2021         Q2 2021   Q3 2021   Q4 2021   Q1 2022   Q2 2022

Complete Market Entry Plan

Phase I Products: Prototypes Complete and Testing in Factory

Phase I Products: Field Deployed Prototypes

Phase II Products: Products Designed and Prototyped

Phase II Products: Field Deployed Prototypes

First Sales

Phase I Products: Production Ramp Up

Phase II Products: Production Ramp Up

Full Market Launch

                                                 Innovation Center Unveiled

                                                      © 2022 Shoals Technologies Group                                              31
EV BUSINESS POTENTIAL
                                                                                                                                                                                                   717,489
                                                                                              YE2021             YE2025

     Number of Addressable Chargers in the U.S. (Points)(1)                                   186,277            717,489                                                               489,697
     Points Added in the U.S. During 2022 Through 2025(1)                                                        531,212

     Average Shoals Addressable Spend per Point(2)                                                               $5,000
                                                                                                                                                  233,273
                                                                                                                                                              186,277
     Implied 2022-2025 U.S. Market Opportunity                                                                   $2.7B

           Following announcements by the Biden Administration and                                                                                        2021                                 2025
           automakers of new incentives for EVs and EV Infrastructure,
                                                                                                                                                      Addressable U.S. Chargers as of Year End
           BNEF has more than doubled their estimate for 2021 to 2025
                           charge point additions(3)
                                                                                                                                                January 2021 Forecast(4)                     June 2021 Forecast(1)

                                              EV Charging solutions can be a significant business for Shoals
(1) Based on BloombergNEF Charging Infrastructure Forecast Model (CIFM 2.0.1), June 2021. Assumes all U.S. chargers except Home chargers are addressable by Shoals equipment
(2) Shoals management estimate.
(3) Based on BloombergNEF Charging Infrastructure Forecast Model (CIFM 1.0.1), January 2021 of 256,424 points added in the U.S. during 2022 through 2025, compared with 531,212 points added in the U.S. during 2022
    through 2025 in BloombergNEF Charging Infrastructure Forecast Model (CIFM 2.0.1), June 2021.
(4) Based on BloombergNEF Charging Infrastructure Forecast Model (CIFM 1.0.1), January 2021. Assumes all U.S. chargers except Home chargers are addressable by Shoals equipment.

                                                                                         © 2022 Shoals Technologies Group                                                                                              32
FINANCIAL OVERVIEW AND
BUSINESS UPDATE
SIMPLE MODEL THAT DELIVERS
                    STRONG FINANCIAL RESULTS

Core Objectives                          Tactics                                                  Results
Grow faster than
                    • Take market share with disruptive products                  22% CAGR in revenues from 2019-2021
the market

                                                                                  ~400 bps increase in EBITDA margins
                    • Locate manufacturing in low-cost regions
                                                                                  from 2019-2021

                    • Use automation to reduce labor content                      Direct labor
HIGH REVENUE VISIBILITY DRIVEN BY LONG PROJECT
LEAD TIMES…
                                                                                           Shoals
       Project Identified                            EPC Award
                                                                                           Purchase Order
       Shoals receives preliminary                   Shoals receives
                                                                                           Shoals receives binding
       design drawings                               verbal award
                                                                                           purchase order

                                                                                               Pre-EBOS
               Project Development                     Pre-Construction                                                  EBOS Delivery
                                                                                              Construction

                   6 months                              3 months                               3 months                    2-3 months

 • EPC advances preliminary engineering          • EPC completes                        • EPC completes pre-EBOS     • Shoals delivers
   and design                                      final design                           construction activities      system

 • Shoals prepares preliminary design, layout,   • Shoals completes final               • Shoals production
   and pricing                                     design, layout, and pricing            lead time

   The procurement process typically gives us 12+ months of visibility on demand and many customers
              give us long-term forecasts with their needs, further enhancing our visibility

                                                     © 2022 Shoals Technologies Group                                                    35
Backlog and Awarded Orders

ORDER BOOK                                                                                                              as of Mar 31st ($mm)(1)

CONTINUES
TO GROW                                                                                                                                    $302

First quarter quotes up [162]% year-
over-year                                                                                                                $181

Backlog and awarded orders up [67]%
from first quarter 2021

                                                                                                                         2021              2022

(1) Backlog defined as signed purchase orders and take or pay contracts with volume
    commitments. Awarded orders defined as orders where we are in the process of
    documenting a contract but for which a contract has not yet been signed.

                                                                                      © 2022 Shoals Technologies Group                            36
THREE SIMPLE REASONS TO INVEST IN SHOALS

      Gain Exposure to the Largest Part                                           …With a Company that Can Grow                                          …And Deliver Strong Returns
            of the Solar Market…                                                     Faster Than the Market…                                                  for Shareholders

          Ground mount solar is the fastest growing                                 “Category killer product” that’s gaining                             20%+ top line growth(4)
          source of new generation in the U.S.(1)                                   share from conventional solutions

                                                                                    Increasing wallet share with new products                            ~30% EBITDA Margins(4)
         Utility-scale market is over 6X the size of
         residential market(2)
                                                                                    Growing wallet size with energy storage
                                                                                                                                                         Strong free cash flow generation
         EBOS is required for every project
                                                                                    Large overseas growth opportunity –
                                                                                    international market is 4.0X size of U.S.(3)
         EBOS is less exposed to price pressure                                                                                                          Self-funding – no new equity capital
                                                                                    Significant additional upside from EV
         than other equipment categories                                                                                                                 required to grow the business
                                                                                    charging products

(1)   Comparison of generation growth based on FERC data for new generation with capacities in excess of 1 MW placed in service between 2015 and 2020.
(2)   IHS Markit Solar Market Tracker – North America: First Half 2021.
(3)   IHS Markit PV Installations Tracker Q2-2021, June 2021. Based on 2023 estimated market sizes. International market excludes China.
(4)   Based on historical results for 2019, 2020 and 2021.

                                                                                           © 2022 Shoals Technologies Group                                                                     37
APPENDIX
RECONCILIATION OF NON-GAAP MEASURES
                                                                                                                                                                                         3 Months Ended March 31,
                                                                                                                                                                                            2022                       2021
                                                                                                                  Net Income (loss)                                                                4,649                  (8,334)
                                                                                                                  Interest expense, net                                                            3,836                    3,709
                                                                                                                  Income tax expense                                                               1,522                  (1,475)
                                                                                                                  Depreciation expense                                                               424                      405
                                                                                                                  Amortization of intangibles                                                      2,270                    1,996
                                                                                                                  Tax receivable agreement liability adjustment                                      -                        -
                                                                                                                  Loss on debt repayment                                                             -                    15,990
                                                                                                                  Equity-based compensation                                                        3,831                    1,392
                                                                                                                  Acquisition-related expenses                                                       -                        -
                                                                                                                                           (1)
                                                                                                                  COVID-19 expenses                                                                  -                          55
                                                                                                                                                              (2)
                                                                                                                  Non-recurring and other expenses                                                  -                         339
                                                                                                                  Adjusted EBITDA                                                                16,532                    14,077

                                                                                                                                                                                         3 Months Ended March 31,
                                                                                                                                                                                            2022                       2021
                                                                                                                  Net income (loss) attributable to Shoals
                                                                                                                  Technologies Group, Inc.                                                         2,640                   (2,859)
                                                                                                                  Net income (loss) impact from pro forma
                                                                                                                  conversion of Class B common stock to Class A
                                                                                                                                     (3)
                                                                                                                  common stock                                                                     2,009                   (5,475)
                                                                                                                                                                         (4)
                                                                                                                  Adjustment to the provision for income tax                                        (475)                   1,134
                                                                                                                  Tax effected net income (loss)                                                   4,174                   (7,200)
                                                                                                                  Amortization of intangibles                                                      2,270                    1,996
                                                                                                                  Amortization of deferred financing costs                                           276                      370
                                                                                                                  Tax receivable agreeement liability adjustment                                     -                        -
                                                                                                                  Loss on debt repayment                                                             -                     15,990
                                                                                                                  Equity-based compensation                                                        3,831                    1,392
                                                                                                                  Acquisition-related expenses                                                       -                        -
                                                                                                                                           (1)
                                                                                                                  COVID-19 expenses                                                                  -                          55
                                                                                                                                                              (2)
                                                                                                                  Non-recurring and other expenses                                                   -                         339
                                                                                                                                                    (5)
                                                                                                                  Tax impact of adjustments                                                      (1,508)                   (4,171)
                                                                                                                  Adjusted Net Income                                                             9,043                     8,771

(1)   Represents costs incurred as a direct impact from the COVID-19 pandemic, disinfecting and reconfiguration of facilities, medical professionals to conduct daily screenings of employees, premium pay during the pandemic to hourly workers and direct legal costs associated with the pandemic.
(2)   Represents certain costs associated with non-recurring professional services, Oaktree’s expenses and other costs.
(3)   Reflects net income (loss) to Class A common shares from pro forma exchange of corresponding shares of our Class B common shares held by our founder and management.
(4)   Shoals Technologies Group, Inc. will be subject to U.S. Federal income taxes, in addition to state and local taxes with respect to its allocable share of any net taxable income of Shoals Parent, LLC. The adjustment to the provision for income tax reflects the effective tax rates below, assuming Shoals Technologies Group, Inc. owns
      100% of the units in Shoals Parent, LLC.
(5)   Represents the estimated tax impact of all Adjusted Net Income add-backs, excluding those which represent permanent differences between book versus tax.

                                                                                                                                                 © 2022 Shoals Technologies Group                                                                                                                                                                    39
You can also read