An early dynamical instability among the Solar System's giant planets triggered by the gas disk's dispersal
←
→
Page content transcription
If your browser does not render page correctly, please read the page content below
An early dynamical instability among the Solar System’s giant planets triggered by the gas disk’s dispersal Beibei Liu ( bbliu@zju.edu.cn ) Zhejiang Institute of Modern Physics & Zhejiang University-Purple Mountain Observatory Joint Research Center for Astronomy Sean Raymond CNRS https://orcid.org/0000-0001-8974-0758 Seth Jacobson Michigan State University https://orcid.org/0000-0002-4952-9007 Physical Sciences - Article Keywords: astronomy, solar system, planets Posted Date: December 30th, 2020 DOI: https://doi.org/10.21203/rs.3.rs-128128/v1 License: This work is licensed under a Creative Commons Attribution 4.0 International License. Read Full License

An early dynamical instability among the Solar System’s
giant planets triggered by the gas disk’s dispersal
Beibei Liu 1,2‹ , Sean N. Raymond 3 , and Seth A. Jacobson 4

1
    Zhejiang Institute of Modern Physics, Department of Physics & Zhejiang University-Purple
Mountain Observatory Joint Research Center for Astronomy, Zhejiang University, 38 Zheda Road,
Hangzhou 310027, China
2
    Department of Astronomy and Theoretical Physics, Lund Observatory, Box 43, SE–22100, Swe-
den
3
    Laboratoire dAstrophysique de Bordeaux, Univ. Bordeaux, CNRS, B18N, allée Geoffroy Saint-
Hilaire, 33615 Pessac, France
4
    Department of Earth and Environmental Sciences, Michigan State University, East Lansing, MI
48824, USA
*To whom correspondence should be addressed; Email: bbliu@zju.edu.cn

The Solar System’s orbital structure is thought to have been sculpted by a dynamical in-
stability among the giant planets1–4 . Yet the instability trigger and exact timing have proved
hard to pin down5–9 . The giant planets formed within a gas-dominated disk around the young
Sun. Motivated by giant exoplanet systems found in mean motion resonance10 , hydrodynam-
ical modeling has shown that while the disk was present the giant planets migrated into a
compact orbital configuration, in a chain of resonances2, 11 . Here we use a suite of dynamical
simulations to show that the giant planets’ instability was likely triggered by the dispersal of
the Sun’s gaseous disk. As the disk evaporated from the inside-out, its inner edge swept suc-
cessively across and dynamically perturbed each planet’s orbit in turn. Saturn and each ice
giants’ orbits were torqued strongly enough to migrate outward. As a given planet migrated
outward with the disk’s inner edge the orbital configuration of the exterior system was com-
pressed, triggering dynamical instability. The final orbits of our simulated systems match
those of Solar System for a viable range of astrophysical parameters. Our results demon-
strate that the giant planet instability happened as the gaseous disk dissipated, constrained
by astronomical observations to be a few to ten million years after the birth of the Solar
           12
System          . Late stage terrestrial planet formation would occur mostly after such an early

                                                  1
13, 14
giant planet instability            , thereby avoiding the possibility of de-stabilizing the terrestrial
planets 15 and naturally accounting for the small mass of Mars relative to Earth and the mass
depletion of the main asteroid belt 16 .

      The evolution of gaseous protoplanetary disks is jointly controlled by viscous-driven accre-
tion and wind-driven mass-loss17 . In the early phase, the disk predominantly undergoes viscous
evolution, as gas accretes at a considerable rate onto the central star for a few Myr. Meanwhile,
the disk gas is photo-evaporated at a low rate by UV and X-ray photons from the central star18 .
Once the disk’s surface density drops sufficiently that the disk accretion rate M9 is lower than the
photoevaporating mass-loss rate M9 pho , the disk begins to dissipate from the inside-out 19 . The disk
is truncated at a characteristic radius Rin ; the gas interior to Rin rapidly viscously drains onto the
star, and an inner hole is formed. At this point the main outer disk is exposed to direct stellar radia-
tion. Gas-free inner cavities have been directly detected in several disks that appear to be in the act
of dispersing 20 . As photo-evaporation continues, the inner cavity expands outward until the disk
is gone. While disks may also be evaporated from the outside-in by high-energy photons in dense
stellar environments21 , inside-out dispersal appears to be an ubiquitous process in disk clearing18 .
This dispersal can be characterized by three physical parameters: the onset mass-loss rate when
photoevaporation takes over M9 pho , the final gas disk dispersal timescale τd , and the inner cavity
expansion rate vr .

      A dispersing protoplanetary disk has a direct effect on the orbital evolution of embedded
planets. Angular momentum transfer between the planets’ orbits and the gas leads to orbital mi-
gration, the shrinking or expansion of the planets’ orbital radii22 . Meanwhile, drag forces act to
damp their orbital eccentricities and inclinations23 . As the disk starts to disperse and an inner cav-
ity is formed, planet migration at the inner disk edge is different than for planets fully embedded
within the disk24, 25 . Embedded planets undergo “two-sided” gravitational torques from both the
interior and exterior parts of the disk. In contrast, planets at the disk’s inner edge only interact
with gas on the outside of their orbits. As a result of larger-amplitude Lindblad and corotation
torques, a planet below the mass threshold for opening a gap stops migrating inward at the disk
inner edge 25, 26 . If the disk inner edge is itself moving radially outward due to disk dispersal, then
the planet may subsequently migrate outward along with the expanding inner edge (see Supple-
mentary Information). This mechanism is termed “rebound”, and was first applied in the context

                                                      2
of the magnetospheric cavity on sub-AU scales to explain the architecture of close-in super-Earth
planets24, 27 . In contrast, a planet massive enough to open a gap in the disk migrates interior to the
cavity and its orbits is not affected as the cavity expands.

      Here we show that the inside-out dispersal of the Sun’s gaseous disk likely triggered a
dynamical instability in the giant planets’ orbits. Such an instability has been invoked to ex-
plain a number of the Solar System’s features such as the giant planets’ orbits1, 3 and those of
Trans-Neptunian objects28 , Jupiter’s co-orbital Trojan asteroids29 , and the giant planets’ irregular
satellites30 . Previous dynamical studies have almost universally relied on interactions between
the giant planets and an outer planetesimal disk to trigger the instability on timescales of tens to
hundreds of Myr5, 7, 9, 31 . In the framework of the disk dispersal-driven instability, the primordial
outer planetesimal disk – whose existence is inferred from the present-day population of Trans-
Neptunian objects32 – did not trigger the instability but still contributed to shaping the system’s
orbital architecture.

      Figure 1 presents a dynamical simulation of an instability triggered by the disk’s dispersal.
This simulation starts from a system with five giant planets, including Jupiter and Saturn and three
ice giant planets, one of which was removed during the instability33 . The planets’ initial orbits
reflect an earlier phase of growth and migration, such that each pair of neighboring planets is in
mean motion resonance: Jupiter and Saturn are in the 2:1 resonance and all other planet pairs are
in 3:2 resonances. The system was integrated taking into account the mutual gravitational forces
between the planets and the effect of the dispersing gaseous disk.

      The expanding edge of the inner disk cavity does not affect all planets equally. Because
Jupiter opens a deep gap around its horseshoe region and the corresponding corotation torque
diminishes, the rebound is quenched (see Supplementary Information) and Jupiter simply enters
the cavity as the inner disk edge sweeps by. When the disk edge approaches Saturn at t“0.6 Myr,
the one-sided torque is strong enough to expand its orbit outward. Jupiter and Saturn exit their
resonant state, as Saturn migrates outward with the expanding cavity, pushing into the orbits of the
outer planets. The eccentricities of the ice giants become excited by this dynamical compression.
Saturn is left behind and enters the cavity at „9 AU at t“0.7 Myr. Meanwhile, the innermost (blue
in Figure 1) ice giant planet becomes excited to the point that its orbit crosses Saturn’s, and the

                                                   3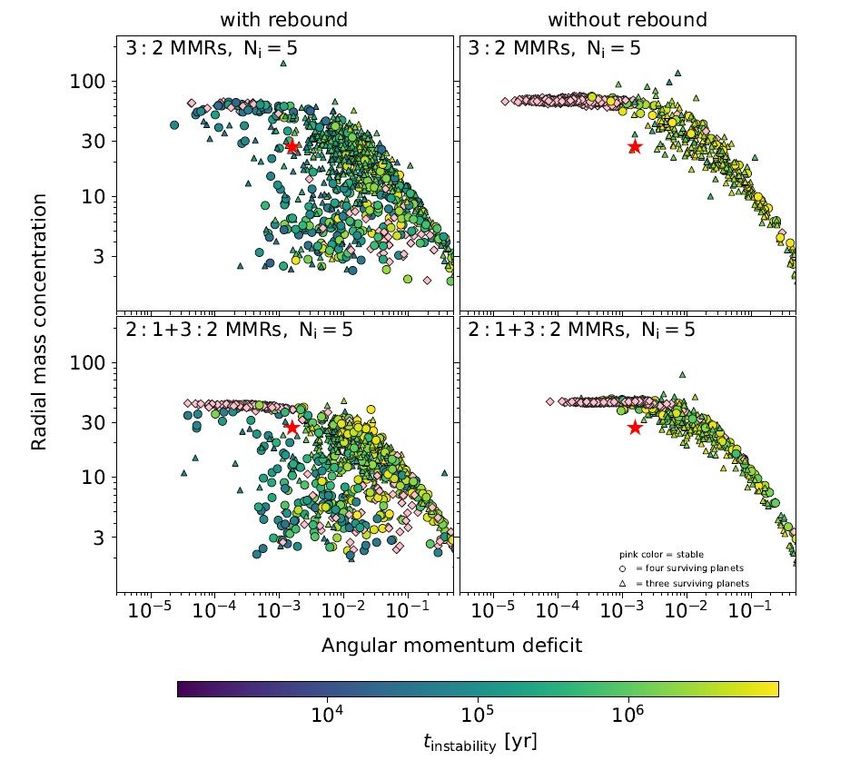
two planets undergo a close gravitational encounter. This triggers a dynamical instability and the
system becomes chaotic: the third ice giant is scattered outward, while the innermost ice giant is
eventually ejected towards interstellar space at t«0.8 Myr after a series of close encounters with
Jupiter. After the disk’s inner edge has swept past all of the planets, their final orbits are close to
those of the present-day Solar System giant planets (Figure 1).

      It is worth noting that our simulations neglected the outer disk of planetesimals. Such a disk
played a central role in triggering the instability and shaping the planets’ final orbits in previous
work1, 5, 7, 9, 31, 33 , which invoked a mass of „20 Earth masses within 30 AU. Within the context
of a rebound-triggered instability, the giant planets’ orbits are basically decoupled from the mass
in an outer planetesimal disk. Gravitational interactions with a remnant planetesimal disk would
modestly expand the orbital radii of Uranus and Neptune and decrease their eccentricities on a
10-100 Myr timescale.

      A rebound-triggered instability is consistent with the Solar System’s orbital architecture. To
demonstrate this we carried out 1.4ˆ104 dynamical simulations like the one from Figure 1. We
varied three different aspects of these simulations (see Table 1). First, we tested a wide range of
plausible starting configurations for the giant planets’ orbits, including varying the number of ice
giants (2, 3, or 4) and their initial resonant states. Second, we used a Monte Carlo method to test the
effects of the three physical parameters – the onset mass-loss rate M9 pho , the disk dispersal timescale
τd , and the rate of expansion of the inner cavity vr – across the full range of astronomically-allowed
values. Third, we ran each simulation twice; once including the effect of inside-out disk dissipation
(with rebound) and once assuming the disk to dissipate smoothly at all radii (without rebound).

      It is an ongoing challenge to use numerical simulations of the instability to concurrently
match all of the Solar System’s dynamical constraints1, 3, 4, 16, 33, 34 . Our goal is to demonstrate our
new instability trigger, so we used two broad dynamical indicators to show that our simulated
systems are indeed consistent with the global properties of the Solar System without attempt-
ing to match each detailed constraint. The first is the normalized angular momentum deficit35 :
        ř ? ´                b
                                     2
                                       ¯ ř
                                               ?
AMD“ mj aj 1 ´ cospij q 1 ´ ej { mj aj , where mj , aj , ej and ij are the mass, semi-
major axis, eccentricity, and inclination of each giant planet. The AMD increases with increasing
orbital eccentricities and inclinations, because eccentric or inclined orbits have a lower angular

                                                   4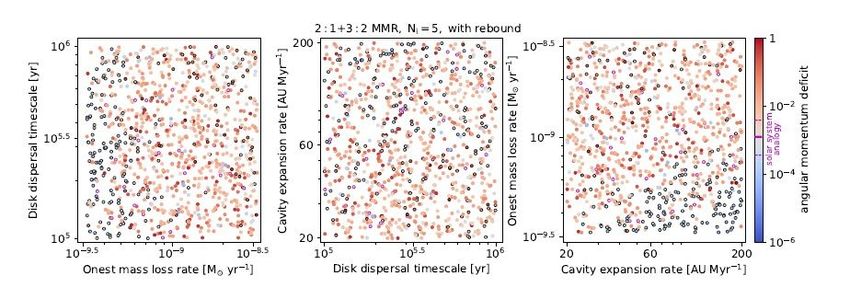
momentum than circular, coplanar ones at the same semimajor axes. The second indicator is the
radial mass concentration36 : RMC “ max p mj { mj rlog10 pa{aj qs2 q, which measures the de-
                                          ř      ř

gree of radial mass concentration in a given system, with higher RMC corresponding to a more
tightly packed system.

      Figure 2 shows the distribution of AMD and RMC values among a subset of our surviving
planetary systems at the end of our simulations (t“10 Myr). Distinctive features can be seen in
Figure 2 when comparing the cases with and without rebound. First of all, dynamical instabilities
are much less frequent when rebound is excluded. Among systems starting in 3:2 resonances (top
panels), roughly 40% were unstable when rebound was ignored but more than 90% were unstable
when it was included. In systems with a chain of 2:1 (Jupiter and Saturn) and 3:2 resonances
(bottom panels), about 30% were unstable when the rebound effect was ignored34 whereas roughly
80% went unstable when rebound was included. In addition, when rebound is taken into account,
the distribution of final systems is more shifted from the initial low AMD and high RMC states
towards final high AMD and low RMC states. A significant fraction of systems end up with an
architecture similar to the Solar System (red star in Figure 2) with an instability timescale shorter
than 10 Myr. This is not observed when rebound is not considered.

      A rebound-triggered instability at the time of disk dispersal fills an important gap in Solar
System chronology. Observations of the frequency of disks in star clusters of different ages find
that the typical disk lifetime is a few to ten Myr12 . Our Solar System’s disk is thought to have
lasted perhaps 5 Myr, spanning the age of the youngest chondritic meteorites37 . The instability
among the Solar System’s giant planets was initially invoked as a delayed event to coincide with
the “late heavy bombardment”31 . However, recent re-appraisal of the cosmochemical constraints
indicates that there was likely no late heavy bombardment38, 39 . Instead, constraints from a binary
Jupiter Trojan6 and from ages of meteoritic inclusions8 suggest that the instability took place no
later than „20-100 Myr after CAIs. An instability within 10 Myr after CAIs would have perturbed
the final assembly of the terrestrial planets and may explain a number of features of the inner Solar
System including the large Earth/Mars mass ratio and the excitation level of the asteroid belt 16 . In
addition, a disk-driven instability removes the dynamical link between the giant planets’ instability
and the mass of the outer planetesimal disk, which may have important consequences for studies of
planetesimal formation and cratering in the outer Solar System. For instance, the cratering record

                                                  5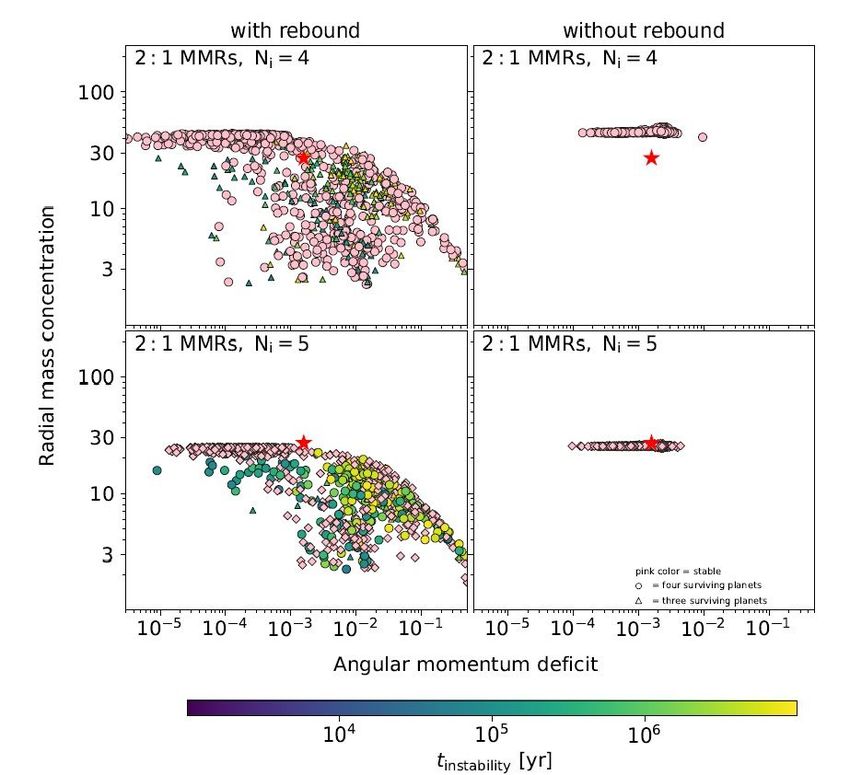
on outer Solar System moons does not appear to match predictions from models of the collisional
evolution of the massive primordial Kuiper Belt needed to trigger the giant planets’ instability40, 41 .

      The rebound-triggered instability occurs across all astrophysically-relevant disk parameter
values. Figure 3 shows the distribution of outcomes of our simulations across the three parameters
(M9 pho , τd , and vr ) for one set of starting conditions, with five giant planets in a chain of 2:1 and
3:2 resonances (run C5R in Table 1). For this setup the systems with five surviving planets (black
edgecolor) are likely to form when the onset mass-loss rate M9 pho is low. We note that for the above
explored range of parameters, the final architectures are not strongly sensitive to the disk dispersal
timescale τd and cavity expansion rate vr . Solar System analogs (magenta edgecolor) preferentially
form when M9 pho À10´9 Md yr´1 . Such ranges of parameters are also broadly consistent with
astrophysical constraints. See the Supplementary Information for equivalent plots for our other
starting conditions and for a discussion of observational constraints on the relevant parameters.

      Our results show that the dispersal of the nebular gas may act as an instability trigger for
nascent planetary systems. Specifically, the rebound effect may explain the apparent ubiquity of
dynamical instability observed in exoplanetary systems42 . The broad eccentricity distribution of
giant exoplanets can be matched if 75-95% of all giant planet systems we see are the survivors of
dynamical instabilities43 . Likewise, the orbital period ratio distribution of close-in small planets is
consistent with the vast majority of systems having undergone dynamical instabilities44 . Thus, the
rebound effect during disk dispersal may be a near universal process effecting not just our Solar
System but planetary systems across the galaxy.

Correspondence and requests for materials Correspondence and requests for materials should be ad-
dressed to B. L. (email: bbliu@zju.edu.cn).

Acknowledgements . B. L. is supported by the European Research Council (ERC Consolidator Grant
724687- PLANETESYS), the Swedish Walter Gyllenberg Foundation, and start-up grant of Bairen program
from Zhejiang University. S. N. R. is grateful to the CNRS’s PNP program for funding.

Author contributions S. N. R. and S. A. J. proposed this idea and initiated the collaboration. B. L.
examined the feasibility and conducted numerical simulations. All authors contributed to analyzing and
discussing the numerical results, editing and revising the manuscript.

                                                     6
Author information The authors declare that they have no competing interests.

                                                 7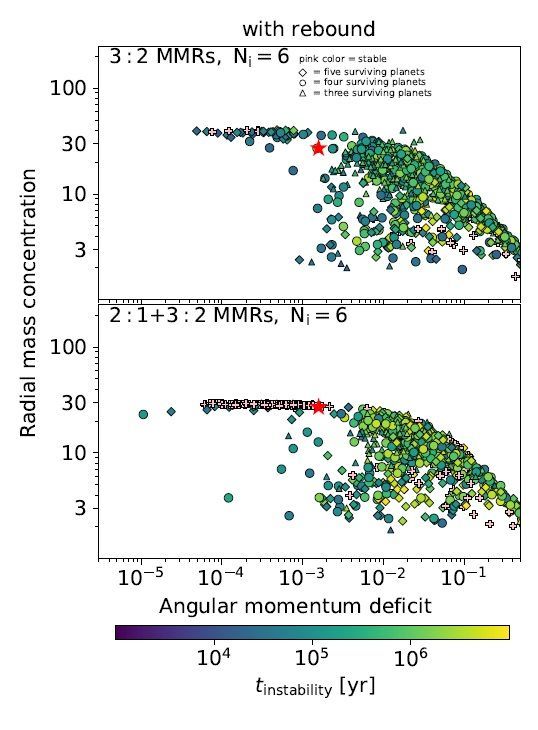
Jupiter
                            Saturn
                            ice giant
                      100   Uranus
                            Neptune
                                                                                                r edge
Semimajor axis [AU]

                                                                                            e
                                                                                    disk inn

                      40

                      20

                      10

                       5
                                        0.5        1                     1.5                       2
                                                Time [Myr]

 Figure 1: An early dynamical instability triggered by the dispersal of the Sun’s protoplane-
 tary disk. The initial system consisted of five giant planets: Jupiter (magenta), Saturn (orange),
 and three ice giants, each of which is 15 M‘ and one of which (blue) was ejected into interstellar
 space during the instability. The curves show the orbital evolution of each body including its peri-
 helion, semimajor axis, and aphelion (thin, thick, and thin curves, respectively). The black dashed
 line tracks the edge of the disk’s expanding inner cavity. We do not follow the early evolution
 through the entire gas-rich disk phase, so the onset of disk dispersal is set arbitrarily to be 0.5 Myr
 after the start the simulation. The semimajor axes and eccentricities of the present-day giant plan-
 ets are shown at the right, with vertical lines extending from perihelion to aphelion. The adopted
 disk parameters are: M9 pho “4 ˆ 10´10 Md yr´1 , τd “8.6 ˆ 105 yr, and vr “35 AU Myr´1 .

                                                   8
with rebound without rebound
3 : 2 MMRs, Ni = 5 3 : 2 MMRs, Ni = 5
100
30
10
Radial mass concentration
3
2 : 1+3 : 2 MMRs, Ni = 5 2 : 1+3 : 2 MMRs, Ni = 5
100
30
10
3 pink color = stable
= four surviving planets
= three surviving planets
10 5 10 4 10 3 10 2 10 1 10 5 10 4 10 3 10 2 10 1
Angular momentum deficit
104 105 106
tinstability [yr]
Figure 2: The radial mass concentration (RMC) and normalized angular momentum deficit
(AMD) distributions among surviving planetary systems in a subsample of our simulations.
The simulations on the left included the rebound effect and those on the right did not. Each
simulation started with our four present-day giant planets plus one additional ice giant planet.
In the top panels, the giant planets were initially placed in a chain of 3:2 orbital resonances. In
the bottom panels, Jupiter and Saturn were in 2:1 resonance and other neighboring planets in 3:2
resonances. Each symbol represents the outcome of a given simulation. The color indicates the
timing of the instability after the start of gas disk dispersal; pink systems did not undergo an
instability (no collision/ejection). Circles and triangles correspond to systems with four and three
or fewer surviving planets, respectively. The Solar
9 System is marked as a red star for comparison.
Comparable figures starting from different orbital configurations are included in the Supplementary
Information.2 : 1+3 : 2 MMR, Ni = 5, with rebound
106 200 10 8.5 1
Cavity expansion rate [AU Myr 1]
Onest mass loss rate [M yr 1]
Disk dispersal timescale [yr]
angular momentum deficit
10 2
---
--
solar system
analogy
105.5 60 10 9
10 4
105 20 10 9.5
10 6
10 9.5 10 9 10 8.5 105 105.5 106 20 60 200
Onest mass loss rate [M yr 1] Disk dispersal timescale [yr] Cavity expansion rate [AU Myr 1]
Figure 3: Simulation outcomes as a function of disk parameters. Each simulation started with
four four present-day giant planets plus one ice giant planet in a series of 2:1 and 3:2 orbital
resonances (run C5R in Table 1). The color bar corresponds to the system’s angular momentum
deficit (AMD). The circles with black edgecolor refer to the systems whose planets all survive
in the end, while the circles with magenta edgecolor represent the Solar System analogs, defined
as systems with four surviving planets in the right order and their AMDs and RMCs are within
a factor of three of our Solar System’s values. Comparable figures starting from different orbital
configurations are included in the Supplementary Information.
10Methods
Disk model. The evolution of protoplanetary disks is thought to be driven by a combination of
internal stress from the gas’ viscosity and external stellar UV/X-ray photoevaporation 17, 18, 45 . At
early times the influence of stellar photoevaporation is negligible and the disk evolves viscously
in a quasi-steady state such that M9 “3πνΣ, where M9 is the gas disk accretion rate, Σ is the gas
surface density, ν“αcs H is the gas turbulent viscosity 46 , α is the viscous efficiency parameter, and
cs and H are the gas disk sound speed and scale height, respectively. At late times, after the disk
accretion rate M9 drops below the stellar photoevaporation mass-loss rate M9 pho , disk dissipation is
dominated by the photoevaporative wind originated from stellar high-energy radiation 19, 47 .
When the thermal energy of disk gas is greater than its gravitational bounding energy beyond
a threshold disk radius Rin , the disk gas escapes as a wind. Gas interior to Rin is rapidly accreted
through a short, viscous timescale. Hence, an inner disk cavity is opened and the main outer disk
19
is optically thin to the direct radiation from the central star . Under such a circumstance, the
18
photoevaporating mass-loss rate is given by
ˆ ˙1{2 ˆ ˙1{2
Φ Rin
M9 pho » 10 ´9
Md yr´1 , (1)
1041 s´1 5 AU
where Φ represents the ionizing flux from the central star and Rin is the initial size of inner cavity.
We note that photoevaporation is a complicated process coupled with radiative transfer and disk
hydrodynamics. The mass-loss rate depends on the primary incident spectrum of the central star
(EUV, FUV, or X-ray), grain abundance, and disk chemistry. The fiducial value of the onset mass-
loss rate M9 pho of 10´9 Md yr´1 in Eq. (1) is taken from models of EUV-driven stellar radiation
19
. If the photoevaporation is instead dominated by X-ray radiation, the mass-loss rate can be even
higher 47 . We vary M9 pho from 3ˆ10´9 to 3ˆ10´10 Md yr´1 in the parameter study.
In this photoevaporation-driven disk dispersal phase, the gas surface density can be written
M9 pho
„ „
t t
Σptq “ Σpho exp ´ “ exp ´ , (2)
τd 3πν τd
where Σpho is the gas surface density when the stellar photoevaportation becomes dominant and
τd is the disk dispersal timescale. Noticeably, two different timescales are related to the gas disk
dissipation. First, the disk lifetime is inferred to be 1´10 Myr with a median value of „3 Myr 48, 49 .
11Second, since a small fraction of young stars have evolved disks being a transition between disk-
bearing and diskless, the disk clearing is expect to be very rapid, typically an order of magnitude
50–52
shorter than the disk lifetime . Based on these observational constraints, it is reasonable to
assume that the disk dispersal timescale τd is in a range between 0.1 and 1 Myr.
In this paper we assume a optically thin stellar irradiation dominant flaring disk 53 in which
the disk temperature and aspect ratio can be expressed as
ˆ ˙1{4 ˆ ˙´1{2 d ˆ ˙1{4
L‹ r H kB T {µmp r
T “ “ Tin , h“ “ “ hin , (3)
16πσSB r2 Rin r GM‹ {r Rin
where M‹ and L‹ are the stellar mass and luminosity, r is the disk radial distance, G is the gravi-
tational constant, σSB is the Stefan-Boltzmann constant, kB is the Boltzmann constant, µ is the gas
53
mean molecule weight and mp is the proton mass. Ref calculated that h “ 0.033 at 1 AU by
adopting L‹ “1 Ld . However, during the pre-main-sequence (age of ă a few Myr), the Sun under-
went gravitational contraction and was far more luminous („1´10 Ld , along the Hayashi track)
than its main-sequence stage. Hence, we choose a higher luminosity for a solar-mass pre-main-
sequence star of L‹ “4 Ld and assume it remains constant during relatively rapid disk dispersal
phase. In this circumstance, the disk aspect ratio is 0.04 at 1 AU. We adopt Rin “5 AU and there-
fore hin “0.06 and Tin “180 K, where the notation Xin indicates the quantity X evaluated at the
inner disk edge Rin when the stellar photoevaporation dominates. Based on the quasi-steady state
assumption, we rewrite the gas surface density as
˙´1
M9 pho
„ ˆ „
t r t
Σptq “ exp ´ “ Σin exp ´ , (4)
3πν τd Rin τd
where Σin “4 g cm´2 for the fiducial disk parameters of M9 pho “10´9 Md yr´1 and α“0.005.
As disk gas disperses from inside-out the inner cavity spreads outward. For simplicity,
we adopt a constant vr to represent the cavity expansion speed. This quantity is not well con-
strained from a observational perspective. The cavity expansion rate should be principally deter-
mined by stellar ionizing flux, size and mass of the disk, and hence, it is not a full-independent
variable. Nonetheless, when the dispersal time and disk mass are fixed, the expansion rate di-
rectly reflects the size of the disk. To a first order approximation, for a disk with an outer edge
Rout of 30 AU and dispersal timescale of 0.5 Myr, the cavity expansion rate approximates as
12vr „Rout {τd “60 AU Myr´1 . Due to the uncertainties in Rout and τd , the cavity expansion speed
could plausibly span two orders of magnitude from 10 to 103 AU Myr´1 .
In brief, the final photoevaportation-driven disk dispersal can be featured by three key model
parameters: the disk dispersal timescale τd , the onset mass-loss rate when photoevaporation dom-
inates M9 pho , and the inner disk cavity expansion speed vr .
Planet migration. We summarize the formulas of planet migration torques based on ref. 24 . When
the planet is far from the inner edge of the disk, it feels the torque from disk gas on its both sides.
54
The two-sided torque is adopted from Eq. (49) of ref. , which reads
Γ2s qp
2
“ ´2.3qd 2 , (5)
mp prp Ωp q h
where ΩK is the Keplerian angular velocity, and qd ”Σg rp2 {M‹ and qp ”mp {M‹ are the mass ratio
between the local gas disk and star and mass ratio between the planet and star, respectively. When
the planet is at the disk edge, only the one-sided torque exists, which is given by
Γ1s ´ q ¯1{2
p qp
2
“ C hs q d 3
` C L qd 3 , (6)
mp prp Ωp q h h
where the first and second terms on the right side of Eq. (6) are the corotation and Lindblad torque
components, and Chs “2.46, CL “ ´ 0.65 are the corresponding coefficients. In order to derive the
corotation torque in Eq. (6), we assume that at the disk inner edge, the gas removal time tremoval
is faster than the gas liberation time in the planet horseshoe region tlib . We demonstrate that this
is a justified treatment as follows. First, at the inner disk edge the gas removal time should be no
longer than the viscous diffusion time tvis ; otherwise the gas would be accumulated. Thus, we have
a
tremoval Àtvis »x2hs {ν, where xhs „rp qp {h is the half-width of the planet horseshoe region. The gas
liberation time for a planet can be written as tlib „8πr{p3ΩK xhs q. Then tremoval ătlib is required for
one-sided corotation torque in Eq. (6). The above condition is satisfied as long as tvis ătlib , and one
can obtain that qÀ8π{3α2{3 h7{3 »2.4 ˆ 10´4 by adopting α“0.005 and h “ 0.07 (at the location
of the 2:1 MMR with Jupiter). In other words, the planet needs to be no more massive than Saturn
to fulfill the above condition. Therefore, the large amplitude one-sided corotation torque condition
holds for our considered planet and disk circumstances.
For a general situation, the total torque can be expressed by interpolating the torques in the
13above two regimes
Γ “ Cmig f Γ1s ` p1 ´ f qΓ2s , (7)
where f “ exp r´prp ´ rin q{xhs s is a smooth fitting function, rp is the planet disk location, and
f “1 (f “0) refers to the planet at the disk edge (far away from the disk edge). Although the above
equations are derived analytically, we note that the termination of planet migration at the inner
disk edge due to one-sided torque induced from a steep density transition is also obtained from
hydrodynamic simulations 25, 26 .
In order to satisfy the planet outward migration at the inner disk edge, the one-sided corota-
tion torque needs to be larger than that the one-sided Lindblad torque. Thus, from Eq. (6) the planet
needs to satisfy qp ăpChs {CL q2 h3 . On the other hand, the above formulas are derived by assuming
that the planet torques are in the linear-regime. When the planet is massive enough to progres-
sively clear the local surrounding gas in its horseshoe region, an annular gap can be formed. In
this case the disk feedback is non-trivial, and Eqs. (5) and (6) are not applicable anymore. Because
the positive corotation torque diminishes due to gap formation, the planet beyond the gap-opening
mass fails to undergo outward migration. The gap-opening first requires the planet’s Hill sphere
RH ”pmp {3M‹ q1{3 r larger than the disk scale height H. Therefore, qp ă3h3 is needed for torques
in the linear regime. Dedicated hydrodynamic simulations further indicated that the planet mass
needs to fulfill 55
3 H 50
` ą 1, (8)
4 R H qp R e
where Re is the Reynolds number r2 ΩK {ν. We name qp,c as the maximum non-gap opening
mass ratio obtained from Eq. (8). To summarize, the planet-to-star mass ratio needs to satisfy
qp ă minrpChs {CL q2 h3 , 3h3 , qp,c s for planet outward migration at the disk edge.
For our adopted disk model, Saturn, Uranus and Neptune are in the linear type I torque
regime. More massive Jupiter is in the type II gap-opening regime, and rebound fails to operate
for Jupiter. Since the timescale of type II migration is much longer than that of the type I and our
study merely focuses on the time span of rapid disk dispersal, we neglect the migration of Jupiter
for simplicity.
Numerical methods. In order to study the evolution of multi-planet systems during gas disk dis-
persal, we carried out numerical simulations using a modified version of the publicly available N-
14body code HERMIT4 56 . The code is designed for accurate calculations of both gravitational inter-
actions among multi-bodies and their tidal interactions with the protoplanetary disk gas 24, 57 . The
gravitational forces among planets are integrated with a time-symmetric scheme and the Burdet-
Heggie regularization, while the planet-disk interaction is taken into account by implementing the
torque recipes mentioned previously. The code enables fast and reliable integration of the orbital
evolution of multiple planets associated with close-encounters and collisions for millions of orbits,
well suited for this study.
Parameter study. We conduct a high number of numerical simulations to study the evolution of
planetary systems during the final gas disk dispersal phase. The initial disk and planet conditions
are listed in Table 1. We consider three different planet configurations: all planets in nearly 2:1
resonances, 3:2 resonances and a combination of 2:1 and 3:2 resonances. Different initial numbers
of planets have also been explored for Ni “4, 5 and 6. In order to study the results in a statistical
manner, for each planetary configuration, we have performed 103 simulations by Monte Carlo
sampling their initial disk conditions (M9 pho , τd and vr ) from log-uniform distributions. Besides,
we have considered both simulations with and without rebound to evaluate the efficacy of this
mechanism. Planets feel the classical type I torques 54 when rebound is absent, whereas one-sided
torque component in Eq. (6) is accounted for when rebound is present. For instance, Figure 2
demonstrates the results of run B5R/B5N/C5R/C5N in Table 1.
The initial eccentricities and inclinations of the planets are assumed to follow Rayleigh dis-
tributions, where e0 “2i0 “10´3 is the scale parameter. The other orbital phase angles are randomly
distributed between 0˝ and 360˝ . We start the initial planet period ratios 5% percent higher than
the exact resonance values. For the first 0.5 Myr, we only turned on the migration of the outer most
planet, and remain the cavity and gas surface density unchanged. This ensures the planets get into
the desired resonant chains. After that we turn on the mentioned migration prescription and let the
disk starts to deplete. Since we only focus on the early instabilities, simulations are run until t“10
Myr. It is noteworthy that the assumed values of initial eccentricities barely matter the subsequent
evolution since the orbits would quickly get regulated by resonance trapping.
Similar to Figure 2, Figure 4 illustrates the RMC and AMD distributions among surviving
planetary systems for initial four-planet systems starting with 3:2 resonances and a chain of 2:1 and
3:2 resonances. Figure 5 is for initial four and five planetary systems starting with 2:1 resonances,
15Table 1: Initial conditions for a parameter study. The second, third and fourth columns corre-
spond to the initial number, period ratio and the order of the system (from inner to outer), where J,
S, U, N are short for the planet with the mass of Jupiter, Saturn, Uranus and Neptune, respectively.
The disk parameters M9 pho , τd and vr are adopted from log-uniform distributions.
run ID number period mass with M9 pho τd vr
Ni ratio order rebound [ Md yr´1 ] [ yr] [ AU Myr´1 ]
run A4R 4 all 2:1 J, S, U, N Yes r10´9.5 , 10´8.5 s r105 , 106 s r20, 200s
run A4N 4 all 2:1 J, S, U, N No r10´9.5 , 10´8.5 s r105 , 106 s r20, 200s
run B4R 4 all 3:2 J, S, U, N Yes r10´9.5 , 10´8.5 s r105 , 106 s r20, 200s
´9.5 ´8.5 5 6
run B4N 4 all 3:2 J, S, U, N No r10 , 10 s r10 , 10 s r20, 200s
´9.5 ´8.5 5 6
run C4R 4 2:1,3:2,3:2,3:2 J, S, U, N Yes r10 , 10 s r10 , 10 s r20, 200s
run C4N 4 2:1,3:2,3:2,3:2 J, S, U, N No r10´9.5 , 10´8.5 s r105 , 106 s r20, 200s
run A5R 5 all 2:1 J, S, U, U, N Yes r10´9.5 , 10´8.5 s r105 , 106 s r20, 200s
run A5N 5 all 2:1 J, S, U, U, N No r10´9.5 , 10´8.5 s r105 , 106 s r20, 200s
run B5R 5 all 3:2 J, S, U, U, N Yes r10´9.5 , 10´8.5 s r105 , 106 s r20, 200s
run B5N 5 all 3:2 J, S, U, U, N No r10´9.5 , 10´8.5 s r105 , 106 s r20, 200s
run C5R 5 2:1,3:2,3:2,3:2 J, S, U, U, N Yes r10´9.5 , 10´8.5 s r105 , 106 s r20, 200s
run C5N 5 2:1,3:2,3:2,3:2 J, S, U, U, N No r10´9.5 , 10´8.5 s r105 , 106 s r20, 200s
run B6R 6 all 3:2 J, S, U, U, N, N Yes r10´9.5 , 10´8.5 s r105 , 106 s r20, 200s
run C6R 6 2:1,3:2,3:2,3:2 J, S, U, U, N, N Yes r10´9.5 , 10´8.5 s r105 , 106 s r20, 200s
while Figure 6 is for initial six-planet systems. The crucial influence of rebound during disk
dispersal on final architecture of the systems is clear present in these figures as well. In addition,
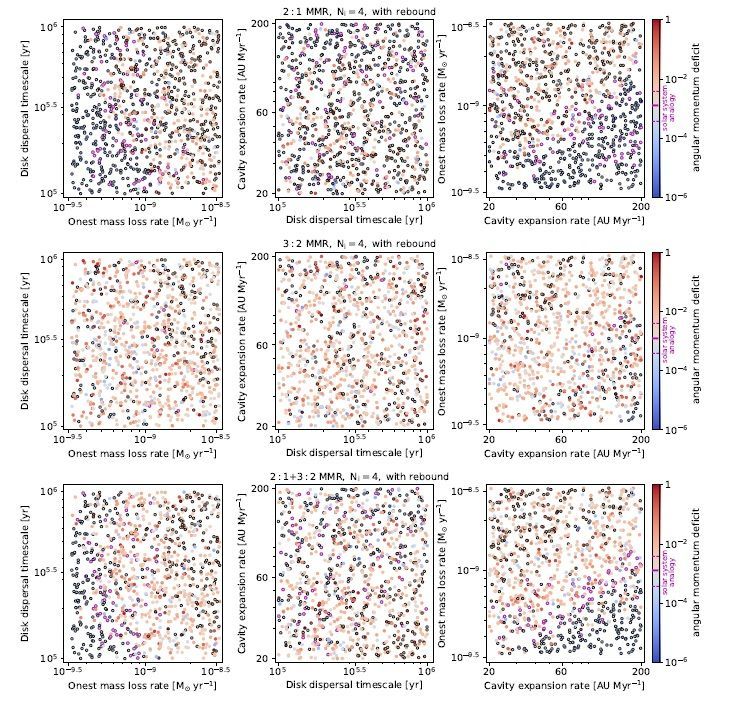
the AMDs of systems with initial four, five and six planets as a function of disk parameters are
presented in Figures 7, 8 and 9, respectively. The model parameter setups and numerical outcomes
can be found in Table 1 and Table 2.
Data availability
The data that support the plots within this paper and other findings of this study are available from
the corresponding author upon reasonable request.
16Table 2: Simulation results for a parameter study. The second, third, fourth and fifth columns
show the probability of systems with final number of planets Nf “6, 5, 4 and ď3, respectively.
The sixth column represents the probability of forming Solar System analogs, defined as systems
with four surviving planets with right orders and their AMDs and RMCs within a factor of three
compared to the Solar System values.
run ID pNf “6 pNf “5 pNf “4 pNf ă“3 pSSA
run A4R 0% 0% 73.6% 26.4% 7.7%
run A4N 0% 0% 100.0% 0.0% 89.7%
run B4R 0% 0% 23.1% 76.9% 0.9%
run B4N 0% 0% 84.5% 15.5% 0.0%
run C4R 0% 0% 45.1% 54.9% 6.4%
run C4N 0% 0% 77.9% 22.1% 58.8%
run A5R 0% 69.3% 26.9% 3.8% 1.7%
run A5N 0% 100.0% 0.0% 0.0% 0.0%
run B5R 0% 7.1% 29.4% 63.5% 1.9%
run B5N 0% 61.2% 7.3% 31.5% 2.4%
run C5R 0% 22.3% 40.6% 36.1% 2.5%
run C5N 0% 69.1% 10.7% 20.2% 3.3%
run B6R 3.1% 19.1% 39.7% 38.1% 1.4%
run C6R 15.4% 30.1% 37.9% 16.6% 0.3%
17with rebound without rebound
3 : 2 MMRs, Ni = 4 3 : 2 MMRs, Ni = 4
100
30
10
Radial mass concentration
3
2 : 1 + 3 : 2 MMRs, Ni = 4 2 : 1 + 3 : 2 MMRs, Ni = 4
100
30
10
3 pink color = stable
= four surviving planets
= three surviving planets
10 5 10 4 10 3 10 2 10 1 10 5 10 4 10 3 10 2 10 1
Angular momentum deficit
104 105 106
tinstability [yr]
Figure 4: The radial mass concentration and normalized angular momentum deficit distri-
butions among surviving planetary systems in our simulations. The simulations on the left
included the rebound effect and those on the right did not. For this subset of our simulations, the
four giant planets were included, initially in a chain of 3:2 (top) or a combination of 2:1 and 3:2
(bottom) orbital resonances. Circles and triangles correspond to systems with four and three or
fewer surviving planets, respectively. The pink refers to stable systems while the color bar indi-
cates the time when the instability occurs after the start of gas disk dispersal. The Solar System is
marked as a red star for comparison.
18with rebound without rebound
2 : 1 MMRs, Ni = 4 2 : 1 MMRs, Ni = 4
100
30
10
Radial mass concentration
3
2 : 1 MMRs, Ni = 5 2 : 1 MMRs, Ni = 5
100
30
10
3 pink color = stable
= four surviving planets
= three surviving planets
10 5 10 4 10 3 10 2 10 1 10 5 10 4 10 3 10 2 10 1
Angular momentum deficit
104 105 106
tinstability [yr]
Figure 5: The radial mass concentration and normalized angular momentum deficit distri-
butions among surviving planetary systems in our simulations. The simulations on the left
included the rebound effect and those on the right did not. Systems are started with initial four
(top) and five giant planets (bottom) in a chain of 2:1 orbital resonances. Squares, circles and
triangles correspond to systems with five, four and three or fewer surviving planets, respectively.
The pink refers to the system without any dynamical instability (no collision/ejection), while the
color bar indicates the time when the instability occurs after the start of gas disk dispersal. The
Solar System is marked as a red star for comparison.
19with rebound
3 : 2 MMRs, Ni = 6 pink=color = stable
five surviving planets
100 = four surviving planets
= three surviving planets
30
Radial mass concentration
10
3
2 : 1+3 : 2 MMRs, Ni = 6
100
30
10
3
10 5 10 4 10 3 10 2 10 1
Angular momentum deficit
104 105 106
tinstability [yr]
Figure 6: The radial mass concentration and normalized angular momentum deficit distribu-
20
tions among surviving planetary systems in our simulations. For this subset of our simulations,
the six giant planets were included, initially in a chain of 2:1 (top) or a combination of 2:1 and 3:2
(bottom) orbital resonances. Plus, squares, circles and triangles correspond to systems with six,
five, four and three or fewer surviving planets, respectively.The pink refers to the system without2 : 1 MMR, Ni = 4, with rebound
106 200 10 8.5 1
Cavity expansion rate [AU Myr 1]
Onest mass loss rate [M yr 1]
Disk dispersal timescale [yr]
angular momentum deficit
10 2
---
--
solar system
analogy
105.5 60 10 9
10 4
105 20 10 9.5
10 6
10 9.5 10 9 10 8.5 105 105.5 106 20 60 200
Onest mass loss rate [M yr 1] Disk dispersal timescale [yr] Cavity expansion rate [AU Myr 1]
3 : 2 MMR, Ni = 4, with rebound
106 200 10 8.5 1
Cavity expansion rate [AU Myr 1]
Onest mass loss rate [M yr 1]
Disk dispersal timescale [yr]
angular momentum deficit
10 2
---
--
solar system
analogy
105.5 60 10 9
10 4
105 20 10 9.5
10 6
10 9.5 10 9 10 8.5 105 105.5 106 20 60 200
Onest mass loss rate [M yr 1] Disk dispersal timescale [yr] Cavity expansion rate [AU Myr 1]
2 : 1+3 : 2 MMR, Ni = 4, with rebound
106 200 10 8.5 1
Cavity expansion rate [AU Myr 1]
Onest mass loss rate [M yr 1]
Disk dispersal timescale [yr]
angular momentum deficit
10 2
---
--
solar system
analogy
105.5 60 10 9
10 4
105 20 10 9.5
10 6
10 9.5 10 9 10 8.5 105 105.5 106 20 60 200
Onest mass loss rate [M yr 1] Disk dispersal timescale [yr] Cavity expansion rate [AU Myr 1]
Figure 7: Simulation outcomes of systems with initial four planets as a function of disk pa-
rameters. Each simulation started with our four present-day giant planets in a series of 2:1 (top)
and 3:2 (middle) and a combination of 2:1 and 3:2 (bottom) orbital resonances. The color bar
corresponds to the system’s angular momentum deficit AMD. The circles with black edgecolor
refer to the systems whose planets all survive in the end, while the circles with magenta edgecolor
represent the Solar System analogs, defined as systems with final four surviving planets with right
orders and their AMDs and RMCs are within a factor of three compared to those of our Solar
System.
212 : 1 MMR, Ni = 5, with rebound
106 200 10 8.5 1
Cavity expansion rate [AU Myr 1]
Onest mass loss rate [M yr 1]
Disk dispersal timescale [yr]
angular momentum deficit
10 2
---
--
solar system
analogy
105.5 60 10 9
10 4
105 20 10 9.5
10 6
10 9.5 10 9 10 8.5 105 105.5 106 20 60 200
Onest mass loss rate [M yr 1] Disk dispersal timescale [yr] Cavity expansion rate [AU Myr 1]
3 : 2 MMR, Ni = 5, with rebound
106 200 10 8.5 1
Cavity expansion rate [AU Myr 1]
Onest mass loss rate [M yr 1]
Disk dispersal timescale [yr]
angular momentum deficit
10 2
---
--
solar system
analogy
105.5 60 10 9
10 4
105 20 10 9.5
10 6
10 9.5 10 9 10 8.5 105 105.5 106 20 60 200
Onest mass loss rate [M yr 1] Disk dispersal timescale [yr] Cavity expansion rate [AU Myr 1]
Figure 8: Simulation outcomes of systems with initial five planets as a function of disk param-
eters. Each simulation started with our four present-day giant planets plus one additional ice giant
planet in a series of 2:1 (top), 3:2 (bottom) orbital resonances. The color bar corresponds to the
system’s angular momentum deficit AMD. The circles with black edgecolor refer to the systems
whose planets all survive in the end, while the circles with magenta edgecolor represent the Solar
System analogs, defined as systems with four surviving planets with right orders and their AMDs
and RMCs are within a factor of three compared to those of our Solar System.
223 : 2 MMR, Ni = 6, with rebound
106 200 10 8.5 1
Cavity expansion rate [AU Myr 1]
Onest mass loss rate [M yr 1]
Disk dispersal timescale [yr]
angular momentum deficit
10 2
---
--
solar system
analogy
105.5 60 10 9
10 4
105 20 10 9.5
10 6
10 9.5 10 9 10 8.5 105 105.5 106 20 60 200
Onest mass loss rate [M yr 1] Disk dispersal timescale [yr] Cavity expansion rate [AU Myr 1]
2 : 1+3 : 2 MMR, Ni = 6, with rebound
106 200 10 8.5 1
Cavity expansion rate [AU Myr 1]
Onest mass loss rate [M yr 1]
Disk dispersal timescale [yr]
angular momentum deficit
10 2
---
--
solar system
analogy
105.5 60 10 9
10 4
105 20 10 9.5
10 6
10 9.5 10 9 10 8.5 105 105.5 106 20 60 200
Onest mass loss rate [M yr 1] Disk dispersal timescale [yr] Cavity expansion rate [AU Myr 1]
Figure 9: Simulation outcomes of systems with initial six planets as a function of disk pa-
rameters. Each simulation started with our four present-day giant planets plus two additional ice
giant planet in a series of 2:1 (top) and a combination of 2:1 and 3:2 (bottom) orbital resonances.
The color bar corresponds to the system’s angular momentum deficit AMD. The circles with black
edgecolor refer to the systems whose planets all survive in the end, while the circles with magenta
edgecolor represent the Solar System analogs, defined as systems with four surviving planets with
right orders and their AMDs and RMCs are within a factor of three compared to those of our Solar
System.
23Code availability
The source code and simulation output for the model used in this study are available on request
from the corresponding authors. The original version of the HERMIT4 N-body code is publicly
available in Sverre Aarseth’s homepage https://people.ast.cam.ac.uk/˜sverre/
web/pages/nbody.htm.
241. Tsiganis, K., Gomes, R., Morbidelli, A. & Levison, H. F. Origin of the orbital architecture of
the giant planets of the Solar System. Nature 435, 459–461 (2005).
2. Morbidelli, A., Tsiganis, K., Crida, A., Levison, H. F. & Gomes, R. Dynamics of the Giant
Planets of the Solar System in the Gaseous Protoplanetary Disk and Their Relationship to the
Current Orbital Architecture. Astron. J. 134, 1790–1798 (2007).
3. Batygin, K., Brown, M. E. & Betts, H. Instability-driven Dynamical Evolution Model of a
Primordially Five-planet Outer Solar System. Astrophys. J. Lett. 744, L3 (2012).
4. Nesvorný, D. Dynamical Evolution of the Early Solar System. Ann. Rev. Astron. Astrophys.
56, 137–174 (2018).
5. Levison, H. F., Morbidelli, A., Tsiganis, K., Nesvorný, D. & Gomes, R. Late Orbital Insta-
bilities in the Outer Planets Induced by Interaction with a Self-gravitating Planetesimal Disk.
Astron. J. 142, 152 (2011).
6. Nesvorný, D., Vokrouhlický, D., Bottke, W. F. & Levison, H. F. Evidence for very early
migration of the Solar System planets from the Patroclus-Menoetius binary Jupiter Trojan.
Nat. Astron. 2, 878–882 (2018).
7. Quarles, B. & Kaib, N. Instabilities in the Early Solar System Due to a Self-gravitating Disk.
Astron. J. 157, 67 (2019).
8. Mojzsis, S. J., Brasser, R., Kelly, N. M., Abramov, O. & Werner, S. C. Onset of Giant Planet
Migration before 4480 Million Years Ago. Astrophys. J. 881, 44 (2019).
9. de Sousa, R. R. et al. Dynamical evidence for an early giant planet instability. Icarus 339,
113605 (2020).
10. Rivera, E. J. et al. The Lick-Carnegie Exoplanet Survey: a Uranus-Mass Fourth Planet for GJ
876 in an Extrasolar Laplace Configuration. Astrophys. J. 719, 890–899 (2010).
11. Pierens, A., Raymond, S. N., Nesvorny, D. & Morbidelli, A. Outward Migration of Jupiter
and Saturn in 3:2 or 2:1 Resonance in Radiative Disks: Implications for the Grand Tack and
Nice models. Astrophys. J. Lett. 795, L11 (2014).
2512. Williams, J. P. & Cieza, L. A. Protoplanetary Disks and Their Evolution. Ann. Rev. Astron.
Astrophys. 49, 67–117 (2011).
13. Touboul, M., Kleine, T., Bourdon, B., Palme, H. & Wieler, R. Late formation and prolonged
differentiation of the Moon inferred from W isotopes in lunar metals. Nature 450, 1206–1209
(2007).
14. Jacobson, S. A. et al. Highly siderophile elements in Earth’s mantle as a clock for the Moon-
forming impact. Nature 508, 84–87 (2014).
15. Kaib, N. A. & Chambers, J. E. The fragility of the terrestrial planets during a giant-planet
instability. Mon. Not. R. Astron. Soc. 455, 3561–3569 (2016).
16. Clement, M. S., Kaib, N. A., Raymond, S. N. & Walsh, K. J. Mars’ growth stunted by an early
giant planet instability. Icarus 311, 340–356 (2018).
17. Armitage, P. J. Dynamics of Protoplanetary Disks. Ann. Rev. Astron. Astrophys. 49, 195–236
(2011).
18. Alexander, R., Pascucci, I., Andrews, S., Armitage, P. & Cieza, L. The Dispersal of Protoplan-
etary Disks. In Beuther, H., Klessen, R. S., Dullemond, C. P. & Henning, T. (eds.) Protostars
and Planets VI, 475 (2014).
19. Alexander, R. D., Clarke, C. J. & Pringle, J. E. Photoevaporation of protoplanetary discs - I.
Hydrodynamic models. Mon. Not. R. Astron. Soc. 369, 216–228 (2006).
20. Espaillat, C. et al. An Observational Perspective of Transitional Disks. In Beuther, H.,
Klessen, R. S., Dullemond, C. P. & Henning, T. (eds.) Protostars and Planets VI, 497 (2014).
21. Adams, F. C., Hollenbach, D., Laughlin, G. & Gorti, U. Photoevaporation of Circumstellar
Disks Due to External Far-Ultraviolet Radiation in Stellar Aggregates. Astrophys. J. 611,
360–379 (2004).
22. Goldreich, P. & Tremaine, S. Disk-satellite interactions. Astrophys. J. 241, 425–441 (1980).
23. Cresswell, P. & Nelson, R. P. Three-dimensional simulations of multiple protoplanets embed-
ded in a protostellar disc. Astron. Astrophys. 482, 677–690 (2008).
2624. Liu, B., Ormel, C. W. & Lin, D. N. C. Dynamical rearrangement of super-Earths during
disk dispersal. I. Outline of the magnetospheric rebound model. Astron. Astrophys. 601, A15
(2017).
25. Masset, F. S., Morbidelli, A., Crida, A. & Ferreira, J. Disk Surface Density Transitions as
Protoplanet Traps. Astrophys. J. 642, 478–487 (2006).
26. Romanova, M. M. et al. 3D simulations of planet trapping at disc-cavity boundaries. Mon.
Not. R. Astron. Soc. 485, 2666–2680 (2019).
27. Liu, B. & Ormel, C. W. Dynamical rearrangement of super-Earths during disk dispersal. II.
Assessment of the magnetospheric rebound model for planet formation scenarios. Astron.
Astrophys. 606, A66 (2017).
28. Levison, H. F., Morbidelli, A., Van Laerhoven, C., Gomes, R. & Tsiganis, K. Origin of the
structure of the Kuiper belt during a dynamical instability in the orbits of Uranus and Neptune.
Icarus 196, 258–273 (2008).
29. Morbidelli, A., Levison, H. F., Tsiganis, K. & Gomes, R. Chaotic capture of Jupiter’s Trojan
asteroids in the early Solar System. Nature 435, 462–465 (2005).
30. Nesvorný, D., Vokrouhlický, D. & Morbidelli, A. Capture of Irregular Satellites during Plan-
etary Encounters. Astron. J. 133, 1962–1976 (2007).
31. Gomes, R., Levison, H. F., Tsiganis, K. & Morbidelli, A. Origin of the cataclysmic Late
Heavy Bombardment period of the terrestrial planets. Nature 435, 466–469 (2005).
32. Morbidelli, A. & Nesvorný, D. Kuiper belt: formation and evolution. (Elsevier, 2020).
33. Nesvorný, D. & Morbidelli, A. Statistical Study of the Early Solar System’s Instability with
Four, Five, and Six Giant Planets. Astron. J. 144, 117 (2012).
34. Clement, M. S. et al. Born eccentric: Constraints on Jupiter and Saturn’s pre-instability orbits.
Icarus 355, 114122 (2021).
35. Laskar, J. Large scale chaos and the spacing of the inner planets. Astron. Astrophys. 317,
L75–L78 (1997).
2736. Chambers, J. E. Making More Terrestrial Planets. Icarus 152, 205–224 (2001).
37. Krot, A. N., Amelin, Y., Cassen, P. & Meibom, A. Young chondrules in CB chondrites from a
giant impact in the early Solar System. Nature 436, 989–992 (2005).
38. Zellner, N. E. B. Cataclysm No More: New Views on the Timing and Delivery of Lunar
Impactors. Origins of Life and Evolution of the Biosphere 47, 261–280 (2017).
39. Morbidelli, A. et al. The timeline of the lunar bombardment: Revisited. Icarus 305, 262–276
(2018).
40. Zahnle, K., Schenk, P., Levison, H. & Dones, L. Cratering rates in the outer Solar System.
Icarus 163, 263–289 (2003).
41. Singer, K. N. et al. Impact craters on Pluto and Charon indicate a deficit of small Kuiper belt
objects. Science 363, 955–959 (2019).
42. Raymond, S. N., Izidoro, A. & Morbidelli, A. Solar System Formation in the Context of
Extra-Solar Planets. arXiv e-prints (2018).
43. Raymond, S. N., Armitage, P. J. & Gorelick, N. Planet-Planet Scattering in Planetesimal
Disks. II. Predictions for Outer Extrasolar Planetary Systems. Astrophys. J. 711, 772–795
(2010).
44. Izidoro, A. et al. Breaking the chains: hot super-Earth systems from migration and disruption
of compact resonant chains. Mon. Not. R. Astron. Soc. 470, 1750–1770 (2017).
45. Ercolano, B. & Pascucci, I. The dispersal of planet-forming discs: theory confronts observa-
tions. Royal Society Open Science 4, 170114 (2017).
46. Shakura, N. I. & Sunyaev, R. A. Black holes in binary systems. Observational appearance.
Astron. Astrophys. 500, 33–51 (1973).
47. Owen, J. E., Ercolano, B. & Clarke, C. J. Protoplanetary disc evolution and dispersal: the
implications of X-ray photoevaporation. Mon. Not. R. Astron. Soc. 412, 13–25 (2011).
48. Haisch, J., Karl E., Lada, E. A. & Lada, C. J. Disk Frequencies and Lifetimes in Young
Clusters. Astrophys. J. Lett. 553, L153–L156 (2001).
2849. Mamajek, E. E. Initial Conditions of Planet Formation: Lifetimes of Primordial Disks. In
Usuda, T., Tamura, M. & Ishii, M. (eds.) American Institute of Physics Conference Series, vol.
1158 of American Institute of Physics Conference Series, 3–10 (2009).
50. Wolk, S. J. & Walter, F. M. A Search for Protoplanetary Disks Around Naked T Tauri Stars.
Astron. J. 111, 2066 (1996).
51. Luhman, K. L., Allen, P. R., Espaillat, C., Hartmann, L. & Calvet, N. The Disk Population of
the Taurus Star-Forming Region. Astrophys. J. Suppl. 186, 111–174 (2010).
52. Koepferl, C. M. et al. Disc clearing of young stellar objects: evidence for fast inside-out
dispersal. Mon. Not. R. Astron. Soc. 428, 3327–3354 (2013).
53. Hayashi, C. Structure of the Solar Nebula, Growth and Decay of Magnetic Fields and Ef-
fects of Magnetic and Turbulent Viscosities on the Nebula. Progress of Theoretical Physics
Supplement 70, 35–53 (1981).
54. Paardekooper, S. J., Baruteau, C., Crida, A. & Kley, W. A torque formula for non-isothermal
type I planetary migration - I. Unsaturated horseshoe drag. Mon. Not. R. Astron. Soc. 401,
1950–1964 (2010).
55. Crida, A., Morbidelli, A. & Masset, F. On the width and shape of gaps in protoplanetary disks.
Icarus 181, 587–604 (2006).
56. Aarseth, S. J. Gravitational N-Body Simulations. (Cambridge University Press, 2003).
57. Liu, B., Zhang, X., Lin, D. N. C. & Aarseth, S. J. Migration and Growth of Protoplanetary
Embryos. II. Emergence of Proto-Gas-Giant Cores versus Super Earth Progenitors. Astrophys.
J. 798, 62 (2015).
29Figures Figure 1 An early dynamical instability triggered by the dispersal of the Sun’s protoplanetary disk. (see Manuscript le for full caption)
Figure 2

The radial mass concentration (RMC) and normalized angular momentum de cit (AMD) distributions
among surviving planetary systems in a subsample of our simulations. (see Manuscript le for full
caption)
Figure 3

Simulation outcomes as a function of disk parameters. (see Manuscript le for full caption)
Figure 4

(see Manuscript le for full caption)
Figure 5

The radial mass concentration and normalized angular momentum de cit distributions among surviving
planetary systems in our simulations. (see Manuscript le for full caption)
Figure 6

The radial mass concentration and normalized angular momentum de cit distributions among surviving
planetary systems in our simulations.(see Manuscript le for full caption)
Figure 7

Simulation outcomes of systems with initial four planets as a function of disk parameters. (see
Manuscript le for full caption)
Figure 8

Simulation outcomes of systems with initial ve planets as a function of disk parameters.(see
Manuscript le for full caption)
Figure 9

Simulation outcomes of systems with initial six planets as a function of disk parameters. (see
Manuscript le for full caption)
You can also read