The experience of traffic safety in the shared space behind Amsterdam Central Station: a comparison between tourists and locals - Sarah Quta ...
←
→
Page content transcription
If your browser does not render page correctly, please read the page content below
The experience of traffic safety in the shared space behind
 Amsterdam Central Station:
 a comparison between tourists and locals

 Sarah Quta
The experience of traffic safety in the shared space behind
 Amsterdam Central Station:
 a comparison between tourists and locals

 Bachelor Thesis

 By

 Sarah Quta
 4838696

 October 18, 2021

 in partial fulfillment of the requirements for the degree of

 Bachelor of science
 in Civil Engineering
 at the Delft University of Technology

 Supervisors: Dr. Ir. A.Gavriilidou
 Dr. Ir. Y.Yuan

 i
Preface
This thesis is written for the completion of the bachelor’s degree Civil Engineering at Delft
University of Technology. The subject of this research is chosen within the department of
Transport & Planning. The research has been conducted from September to October 2021.

I would like to thank my supervisors, Yufei Yuan and Alexandra Gavriilidou, and fellow
students who supported me with their meaningful guidance, help and feedback. I would also
like to thank Ruwan Aluvihare for taking the time to conduct the interview and provide me
with useful information. Lastly, I would like to thank the respondents of the survey, because
their input made it possible to conduct this research.

 Sarah Quta
 Amsterdam, October 2021

 i
Summary
The focus of this research is to investigate how international inbound tourists experience the
traffic safety compared to locals in the shared space behind Amsterdam Central Station. This
means a subjective study on traffic safety is conducted. The type of road users that is
focused on are pedestrians and cyclists as they are the most vulnerable road users
(European Commission, 2016).

For this research a literature study was conducted to obtain more information on the concept
of a shared space and the different factors that influence the traffic safety. To provide a good
overview of these factors a conceptual framework was created. Only the traffic safety factors
that are relevant for the research at the shared space were selected and based on these
factors a survey was created.

The first part of the survey consisted of multiple choice questions about personal data. The
second part of the survey consisted of questions about the feeling of traffic safety in relation
to the design of the shared space. The respondents had to rate these questions from 1 to 6,
where 1 indicated a very unsafe feeling or a strong disagreement and 6 indicated a very safe
feeling or strong agreement. The last part of the survey consisted of questions about the
feeling of traffic safety in relation to the traffic conditions at the shared space and contained
some questions about the overall experience. The data of the survey was analyzed by
performing the Mann-Whitney U test and the Kruskal-Wallis test, which are statistical
significance tests.

Regarding the analysis of the results, it was concluded that a slight majority of the
international inbound tourists and locals feel safe in the shared space. This means there is
no difference in experience in the overall traffic safety between these groups. However, when
zooming in on the design factors, international inbound tourists feel more unsafe compared
to locals regarding the absence of traffic lights, kerbs and a sidewalk/bike path.

As a result of this research, the municipality of Amsterdam is advised to evaluate the shared
space more often and to include the experience of all road users, including tourists. In
addition, more studies should be conducted on the experience of tourists as well as on the
possible relation of different safety factors in order to make a more reliable assessment.

 ii
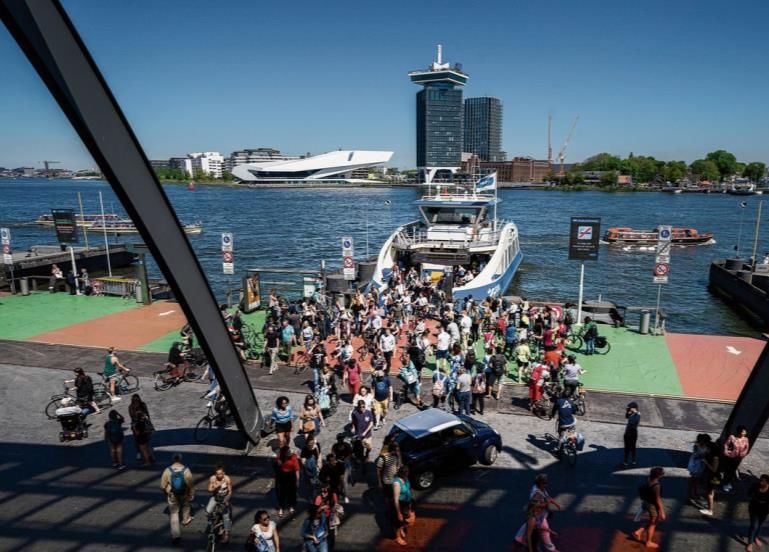
Table of contents
Preface ...............................................................................................................................................i
Summary ........................................................................................................................................... ii
1. Introduction ................................................................................................................................... 1
 1.1 Problem Statement ............................................................................................................................ 2
 1.2 Objective ............................................................................................................................................. 2
 1.3 Research questions ........................................................................................................................... 3
 1.4 Stakeholders....................................................................................................................................... 4
 1.5 Outline report ...................................................................................................................................... 4
2. Literature study ............................................................................................................................. 5
 2.1 Concept of a shared space .............................................................................................................. 5
 2.2 Design shared space Amsterdam Central Station ........................................................................ 6
 2.3 Traffic safety factors .......................................................................................................................... 8
 2.3.1 Listed traffic safety factors ........................................................................................................ 8
 2.3.2 Conceptual framework ............................................................................................................. 10
3. Methodology ............................................................................................................................... 12
 3.1 Literature study ................................................................................................................................ 12
 3.2 Interview ............................................................................................................................................ 12
 3.3 Survey description ........................................................................................................................... 12
 3.4 Data analysis .................................................................................................................................... 15
 3.4.1 Descriptive analysis ................................................................................................................. 15
 3.4.2 Mann-Whitney U test ............................................................................................................... 15
 3.4.3 Kruskal-Wallis test .................................................................................................................... 17
4. Results ........................................................................................................................................ 18
 4.1 Interview ............................................................................................................................................ 18
 4.2 Survey................................................................................................................................................ 19
 4.2.1 Descriptive analysis ................................................................................................................. 20
 4.2.2 Mann-Whitney U test ............................................................................................................... 24
 4.2.3 Kruskal-Wallis test .................................................................................................................... 28
5. Discussion .................................................................................................................................. 29
6. Conclusion .................................................................................................................................. 30
References ..................................................................................................................................... 32
Appendix A: Interview ..................................................................................................................... 36
Appendix B: Survey ........................................................................................................................ 42
Appendix C: Results Mann-Whitney U test .................................................................................... 48
Appendix D: Results Kruskal-Wallis test ........................................................................................ 55

 iii
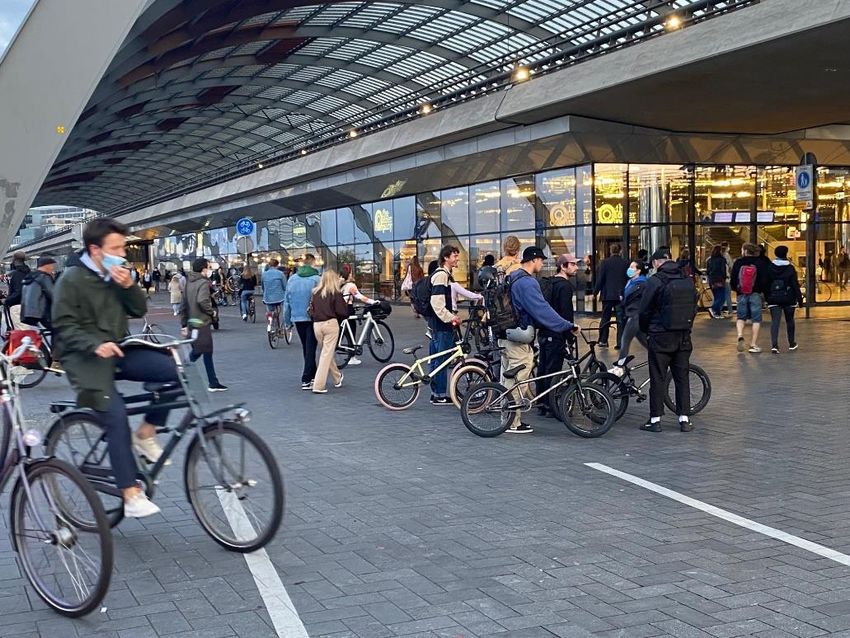
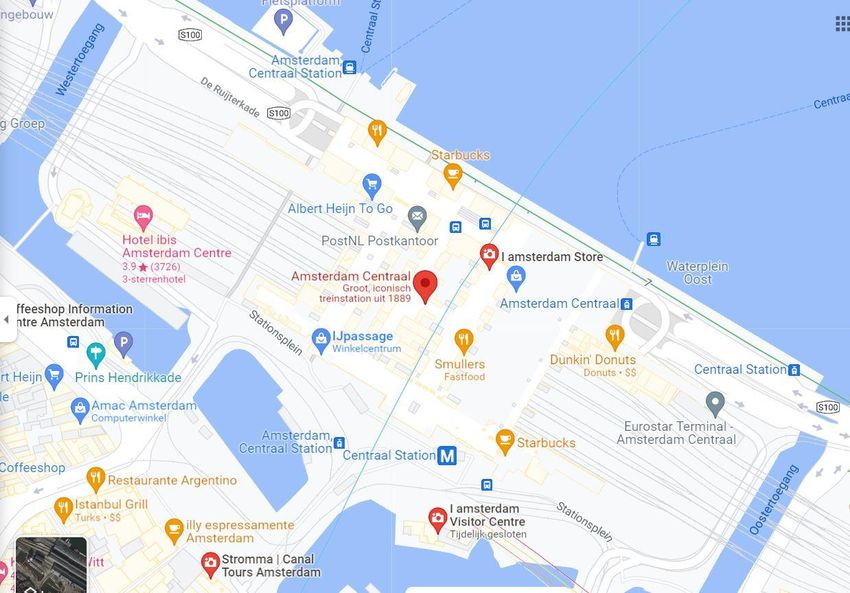
1. Introduction

In the last 20 years, several locations in the Netherlands have been designed according to
an urban design approach called “shared space” (CROW, 2011). The founder of this
concept, Hans Monderman, wanted to encourage road users to become more alert, interact
with each other and slow down their speed to create a safer traffic environment (Project for
Public Spaces, 2008). He thought this could be accomplished by redesigning several major
streets in such a way that the layout “clearly indicates the primary function is residential” and
the “traffic is a guest” (Project for Public Spaces, 2017). To express this function in the
design, in most of the shared spaces a reduced speed limit is applied and traditional street
elements such as traffic signs, kerbs and road surface markings are minimized or removed
(Project for Public Spaces, 2008).
One of the shared spaces is located behind the Central Station of Amsterdam (highlighted in
green on the map in figure 2). In this area only mopeds, cyclists and pedestrians are
permitted (with the exception of certain vehicles such as an ambulance or working purpose
vehicles). They enter the shared space from different directions: the bicycle tunnel, the city
ferry lines, adjacent bike paths and sidewalks and the Central Station. As there are no traffic
lights and no separate road sections in this area, the road users have to rely on and interact
with each other when crossing this area.

 Figure 1: Shared space behind Amsterdam Central Station

The surrounding of this shared space is an important aspect as it is located behind the
station and next to the river ‘t IJ. People walk along this river enjoying their view, while others
are waiting on the city ferry line to cross this river. The central station is also an important
contribution to this shared space as this station is not only the biggest spot for public
transport in Amsterdam, but it is also a place where there are shops and restaurants.
Therefore, this contributes to the function of a residential place. In addition, the main

 1
Amsterdam Tourist Office and departure quays for the tourist boats (highlighted in yellow on
the map in figure 2) are located next to this station which attracts many tourists as well
(Amsterdam.info, z.d.).

 Figure 2: Map of Amsterdam Central Station (Google Maps, n.d.)

1.1 Problem Statement
As stated before, the shared space behind Amsterdam Central Station can be entered from
several directions. People who visit this shared space more often might get used to this busy
place and now just ‘go with the flow’. But what about people who may not be familiar with
such a shared space, like tourists? They might feel insecure or even panic when entering this
area with cyclists, mopeds and pedestrians moving along each other without clear traffic
regulations. It is important to look at their opinion as well. Therefore, the focus of this
research is on the experience of traffic safety of tourists and locals in the shared space
behind Amsterdam Central Station. This means a subjective study on traffic safety is
conducted. The type of road users that is focused on are pedestrians and cyclists as they are
the most vulnerable road users (European Commission, 2016).

1.2 Objective
The goal of this research is to investigate how tourists experience the traffic safety compared
to locals in the shared space behind Amsterdam Central Station. If the outcome of this
research shows that either tourists, locals or both groups feel unsafe in this shared space,
the municipality of Amsterdam could be advised to perhaps adjust certain aspects of this
shared space or intervene by providing more information about the concept, for example at

 2

Schiphol Airport. Furthermore, suggestions about, for example, the setup of the survey,
certain influential factors or suggested further research could be made to other researches.

1.3 Research questions
For this problem the following research question is formulated:

How do international inbound tourists experience traffic safety in the shared space
behind Amsterdam Central Station compared to locals?

In this research, locals refer to Dutch inhabitants. International inbound tourists are defined
as “people who travel to a country other than in which they have their usual residence for a
period not exceeding 12 month for leisure, business or other personal purposes, and not for
permanent work” (Eurostat, n.d.). In this research, sometimes only the word tourist is
mentioned, but this always refers to the international inbound tourists.

To answer the main research question, four sub-questions are formulated:

 1. What is the definition of a shared space?
 This sub question is relevant to the main research question as it is crucial to properly
 understand the concept of a shared space before investigating the traffic safety in
 that area. To answer this question, a literature study will be done.

 2. What are the design characteristics of the shared space behind Amsterdam Central
 Station?
 This question is related to the main research question as this research will be focused
 on the shared space behind Amsterdam Central Station and therefore the specific
 design guidelines of this shared space must be known. To answer this sub question a
 literature study will be done.

 3. Which factors play a role in the feeling of traffic safety?
 This sub question is crucial to be able to answer the main research question,
 because before investigating how tourists experience traffic safety it must be clear
 which factors contribute to the feeling of safety (regarding traffic safety). To answer
 this question, a literature study will be done and a conceptual framework will be
 created to provide a good overview of these factors. These factors can then be used
 in the survey and data analysis of the results of the survey.

 4. What were the intentions of the municipality of Amsterdam to develop a shared space
 behind Amsterdam Central Station?
 This sub question is related to the main research question as it is relevant to know
 why the municipality of Amsterdam decided to design the shared space at that
 particular location, as it is one of the places in Amsterdam where there are many
 tourists. To answer this question, an interview will be held with an employee of the
 municipality of Amsterdam.

 3
1.4 Stakeholders
The stakeholders that are relevant for this research include the tourists, the locals, the
municipality of Amsterdam, Central Station and GVB. Their role is described in table 1.
Table 1: Stakeholders and their role

 Stakeholder Role

 Tourists (pedestrians & cyclists) They make use of the shared space, but
 might have never seen such a concept in
 real life. It is important to investigate how
 they experience the safety.

 Locals (pedestrians & cyclists) They make use of the shared space. It is
 important to investigate their safety feeling
 in the shared space as well. In this way the
 opinion of the tourists can be put in a better
 perspective.

 Municipality of Amsterdam They have made the decision to design a
 shared space behind Amsterdam Central
 Station and are responsible for the
 development of this area.

 Central Station (CS) This station is relevant as most of the road
 users might use station facility. It is a central
 place for accommodation that attracts many
 tourists and locals.

 GVB (municipal transport company) They are responsible for the city ferry lines
 which play an important role in the traffic
 flow. When more than hundred people
 leave the ferry at once, the traffic density at
 the shared space increases very rapidly.

1.5 Outline report
This report consists of 6 chapters. Chapter 2 provides a literature study about the concept of
a shared space and traffic safety factors. Chapter 3 describes the methodology for this
research. This includes the literature study, the preparation for the interview with an
employee of the municipality of Amsterdam, the setup of the survey and the type of data
analyses that will be done. In chapter 4 the results of the interview and the survey analyzed
and discussed. In chapter 5 a discussion on the results is provided and a conclusion on the
results and discussion will be drawn in chapter 6. The questions of the interview can be
found in appendix A. Appendix B contains the questions of the survey. In appendix C and D
the results of the Mann-Whitney U test and the Kruskal-Wallis test can be found.

 4
2. Literature study
This chapter provides background information about shared space and an analysis of the
factors that influence the traffic safety. Section 2.1 explains the concept of a shared space.
The design of the shared space behind Amsterdam Central Station is described in section
2.2. Section 2.3 provides an overview of the factors that influence the traffic safety.

2.1 Concept of a shared space
In the 1980s, the Dutch traffic engineer Hans Monderman introduced the idea of redesigning
several major streets and the surrounding public space in such a way that road users are
encouraged to become more alert, interact with each other and slow down their speed. He
suggested that if road users will take more responsibility, a safer traffic environment is
created. This led to the development of a new urban design approach called ‘shared space’
(Project for Public Spaces, 2008).

According to CROW (2011) a shared space consists of three aspects:
 1. A traffic space:
 This space is designed according to the corresponding design guidelines in order to
 handle the traffic in a smooth and safe way. Road users must respect the traffic rules.

 2. A residential area:
 The design of this area must show that all the road users and functions are equally
 important. This can for example be an area surrounded by shops, a hospital or a train
 station. The focus is on the freedom of movement and the social interaction with other
 road users. Motorized vehicles and bicycles have to adjust to lower speeds and
 everyone has to take into account the unpredictable behavior of others.

 3. A transition area:
 The transition between the traffic space and the residential area must be gradual. A
 transition area is needed to provide road users sufficient time and the opportunity to
 anticipate the situation in the residential area.

The concept does thus not only involve the design of a single street, but it includes the
design of a whole public space. In a residential area the “traffic is a guest” (Jorna et al.,
2013). To express this function in the design, a reduced speed limit is applied and traditional
street elements such as traffic signs, kerbs and road surface markings are minimized or
removed, resulting in a flat and even surface (Project for Public Spaces, 2008).

 5
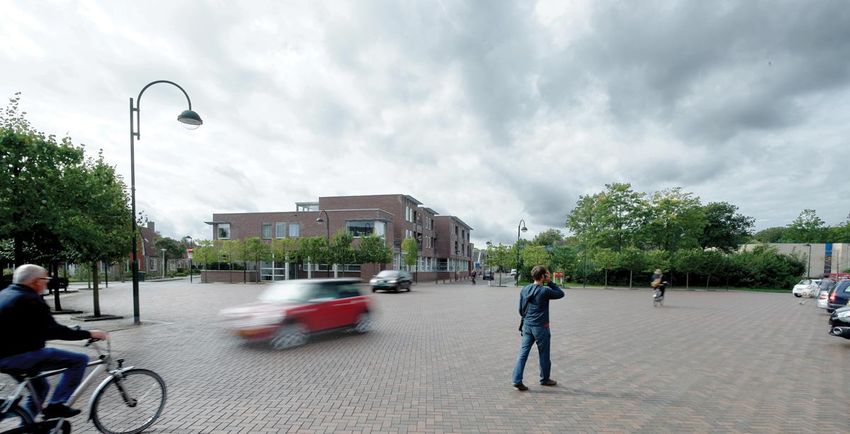
Figure 3: Shared space in Oosterwolde (Bilak, 2013)

The removal of these traffic features are not mandatory as there are no fixed rules or design
requirements for a shared space. The decision of which traffic features should or should not
be implemented depends on the location, the environment and discussions with those
involved. The only strict constraint of a shared space is the absence of traffic lights as in this
way there will be no segregation of road users, which is what this concept is all about
(CROW, 2011).

Monderman has developed over 100 shared spaces and in 2004 his work also reached
outside Europe (Project for Public Spaces, 2008). The concept sparked many interests, but
also many discussions have taken place regarding the traffic safety (CROW, 2011). The
Directorate General for Public works was not fully convinced. Political pressure and the
negative public image has in some cases resulted in replacing the shared space by the
“traditional” street type including zebra crossings. Even though research has shown that the
absence of traditional street elements improves the road safety, residents felt less safe (Van
de Vliet, 2013). However, this is not surprising as a shared space results in increased
interactions between the road users and this suggests that the number of conflicts will also
increase (Gkekas et al., 2020). This will give the road users a feeling of insecurity, as Hans
Monderman suggested in his approach. But at the same time: this is how a shared space
works. It is assumed that in this way the road user, especially motorized vehicles, will be
more “responsible, alert and responsive to evidence of safety and danger” (Adams, 2008).

2.2 Design shared space Amsterdam Central Station
Every shared space has its own characteristics. In the shared space behind Amsterdam
Central Station only pedestrians, cyclists and mopeds are allowed (with the exception of
certain vehicles such as vehicles that clean the street).

 6
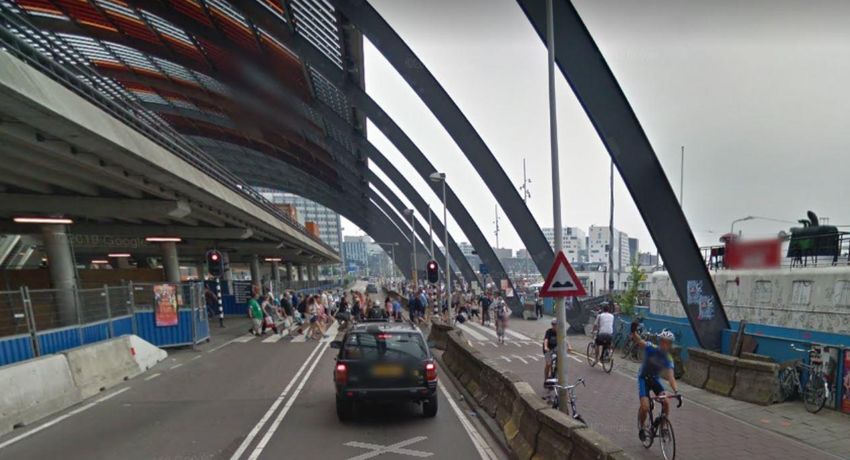
Figure 4: Area behind Amsterdam Central Station in 2015 (Google maps, 2015)

Figure 4 shows how the area behind Amsterdam Central Station looked like in 2015. It can
be observed that at that time there were separate road sections for vehicles, cyclists and
pedestrians, road surface markings (such as zebra crossings), traffic signs and traffic lights.
Also road bumps just before the zebra crossing can be observed. Now, the area consists of a
big grey flat surface, as can be seen in figure 5. The only traffic signs in this area can be
found at the entrance of the shared space and only include a speed limit sign of 15
kilometers an hour and a blue pedestrian sign under which it is stated that mopeds and
cyclists are permitted.

 Figure 5: Shared space behind Amsterdam Central Station

When comparing the area in 2015 to the current situation it can be observed that the
following traditional street elements have been removed or minimized:
 - Traffic lights
 - Traffic signs
 - Separate road sections
 - Road surface markings

 7
The absence of these traffic design features should increase a residential-like feeling. These
are a couple of the features that are used for the survey as these distinguish a shared space
from a traditional road intersection.

2.3 Traffic safety factors
Before investigating the experience of traffic safety at the shared space, it is important to
distinguish the factors that influence the traffic safety. Not many studies have been
conducted on the subjective traffic safety. Therefore, factors influencing both subjective and
objective traffic safety in any traffic surrounding (so not only a shared space) will be looked
at. It should be noted that there are many different factors, but only a selection is made and
discussed here.

2.3.1 Listed traffic safety factors

Age
Furian et al. (2016) have researched the influence of age on the perception of traffic safety.
They conducted a survey and asked the respondents to rate their concern on road accidents
and traffic congestion from 1 to 4, where 1 indicates to be very concerned and 4 indicates to
be not concerned at all. They looked at three different age groups: 18 – 34, 35 – 54 and 55+.
Their research shows that the older the age group, the more concerned people are regarding
road accidents and traffic congestion. According to the statistics on crash rates, injuries and
deaths in the United States in 2014-2015, the most fatal crash involvements include the age
group of 80 years and older (Tefft, 2017). European Commission (2015) states this can be
related to the fact that visual functions decrease as people get older. This includes the visual
acuity, which is the ability to see details and thus very important for the perception of traffic
signs, signals and long-distance sight.

Gender
Furian et al. (2016) also researched the influence of gender on the perception of safety.
Women appeared to be more concerned about road accidents compared to men. However,
when looking at the concerns regarding traffic congestion this is the other way around:
slightly more men are concerned about a traffic congestion compared to women. A study by
Al-Balbissi (2003) focused on the objective safety and observed that male drivers were more
involved in accidents compared to female drivers. Globally, almost three times as many
males compared to females die in traffic accidents (World Health Organization, 2002).

Residence
A literature research by J. Lee et al. (2014) revealed that the place of residence in the United
States affects the involvement of fatal crashes. By registering ZIP codes it was concluded
that residents from a rural area are more likely to be involved in fatal crashes. Foreign drivers
appear to be more at risk and more involved in traffic accidents as well. This is because they
are unfamiliar with the environment and the associated traffic characteristics, which they do
not always understand (Yannis et al., 2007).

Mode of transportation
Pedestrians and cyclists are considered the most vulnerable road users, because they
cannot protect themselves against traffic with high speed and mass (European Commission,
2016). Globally, almost half of all fatalities in road traffic crashes involve vulnerable road
users (Yannis et al., 2020). In Europe, 80% of the vehicles that causes fatalities among

 8
pedestrians and cyclists are motor vehicles (cars, lorries, buses) (European Commission,
2016).

Road design
According to the European Commission (2019) more than 30% of the crashes are related to
road infrastructure and surroundings. Several studies have shown that roundabouts are safer
compared to intersections were stop signs or signals are applied. This is because drivers
must slow down when entering a roundabout and it is a one-way-travel (Washington State
Department of Transportation, n.d.). In the Long-term Traffic Safety Plan of the municipality
of Amsterdam it is stated that 35 % of the bicycle accidents are caused by obstacles on the
road, such as (high) curbstones, street lights and street signs (Gemeente Amsterdam, 2016).

Accompanied people
Several studies have been conducted to research the impact of passengers on driving
behaviour. Some studies have shown that drivers accompanied by passengers are less at
risk of an accident compared to those who drive alone (Vollrath et al., 2002, Rueda-
Domingo, Lardelli-Claret, et al., 2004). A study by C. Lee and Abdel-Aty (2008) showed that
strong correlations exist between passenger and crash characteristics. When accompanied
by one or more passengers, the driving behaviour of the driver is generally safer. An
increase of passengers accompanying the driver shows a decrease in the driver’s crash
potential. Only younger driver’s crash potential increases when accompanied by a younger
passenger. Other studies have shown that an increase in the amount of passengers leads to
more distractions and an increased risk of accident. For example, research by Hing et al.
(2003) revealed that older drivers (75+) show a relatively higher crash causing ratio when
accompanied by two or more passengers.

Route familiarity
Route familiarity can have an influence on the driving behaviour and this can have an impact
on the safety aspects. According to Intini et al. (2019 ) a route familiar driver is a “driver who
is travelling on a route well-known from long or close association, and the travelling on that
specific route composed of different road elements has been the stimulus repeatedly
experienced.” Intini et al. (2018) researched the impact by conducting a macro-analysis and
analysis of more detailed levels considering specific accident, vehicle and person-related
variables. It was concluded that route familiarity is an influential factor on the accident risk,
which may be due to the over-confidence that lead to distractions and dangerous behaviour.
Also research by Burdett et al. (2017) has shown that drivers perform more traffic violations
and dangerous behaviour, such as curve cutting tendency and higher speeds, on roads that
are familiar to them.

Driver behaviour
Almost 90% of the traffic accidents in Amsterdam are caused by people’s unsafe behaviour
(Gemeente Amsterdam, 2016). According to the literature research conducted in the United
States by Lancaster and Ward (2002) an increased risk in driving behaviour was observed
with “personality characteristics among which sensation seeking scales, thrill-seeking,
impulsiveness, hostility/aggression, emotional instability and depression”. Examples of
personality characteristics that influence crash involvement are sensation seeking, low
tension tolerance, immaturity and personality disorder.

Weather conditions
During periods of precipitation the visibility of road users is reduced. In addition, aquaplaning
can occur due to a layer of water on the road that can cause the vehicle to lose contact with

 9
the surface and slip. On a bright day, the bright rays of the sun can also hinder the view of
road users. Furthermore, high wind pressures can push vehicles off course and under
extreme conditions can even cause them to roll over. Also pedestrians and two-wheelers can
be affected by these high wind pressures and this can be a hindrance to other road users
(SWOV, 2012).

Traffic density
A study by Duivenvoorden (2010) revealed that a higher traffic density results in an increase
in the number of crashes on 80 km/h roads. This increase was also observed by Kononov et
al. (2011), who researched the relation of flow and density of Urban Freeways. The rate of
accidents appeared to increase faster when a certain traffic density was reached.

Collision
The municipality of Amsterdam has analyzed incidents involving road users at the shared
space behind Amsterdam Central Station to measure the objective safety (V&OR, 2016). An
increase in the number of collisions creates a less safe environment.

Other factors
Four other factors, which do not come from literature study, are also considered to be
relevant. These factors are listed in table 2.

Table 2: Other influential traffic safety factors

 Influential factor Assumption

 Familiarity with concept Someone who is familiar with the concept of a shared space
 already know the traffic rules in this area and therefore they
 might feel more safe than other participants to who this concept
 is all new.

 Purpose of visit Someone who visits the shared space in their free time might
 feel more safe as they choose to be at that location compared to
 someone who has to cross this area as it is part of their route.

 Interaction with other The interaction at a shared space is different as there are no
 road users traffic regulations and people have to be more alert and and
 interact with each other which could make them feel less safe
 than a situation where there is little interaction and everything is
 arranged with traffic lights and rules.

 Time of day During peak hours the traffic density is higher and therefore the
 chance of an accident is also higher which can make people feel
 unsafe

2.3.2 Conceptual framework

To provide a good overview of all the factors discussed above a conceptual framework is
created.

 10
Personal information
 • Age
 • Gender Externalities
 • Residence
 • Mode of transportation • Weather conditions
 • Purpose of visit • Time of day
 • Route familiarity
 • Accompanied people
 • Familiarity concept
 • Behaviour

 Traffic safety

 Design
 Traffic conditions
 • Traffic lights
 • Traffic signs
 • Interaction other road users
 • Speed limit
 • Traffic density
 • Road surface markings
 • Collision with other road users
 • Kerbs
 • Space to walk/cycle
 • Zebra crossings
 • Roundabouts

 Figure 6: Factors traffic safety

The factors that were discussed in section 3.2.1 have been divided among four different
groups: personal information, design, traffic conditions and externalities. Among the design
factors, traffic elements have been added that are usually removed in a shared space (which
were also discussed in section 2.2). The factors in bold are used for the survey as these
seem to be relevant to investigate at the shared space.

 11
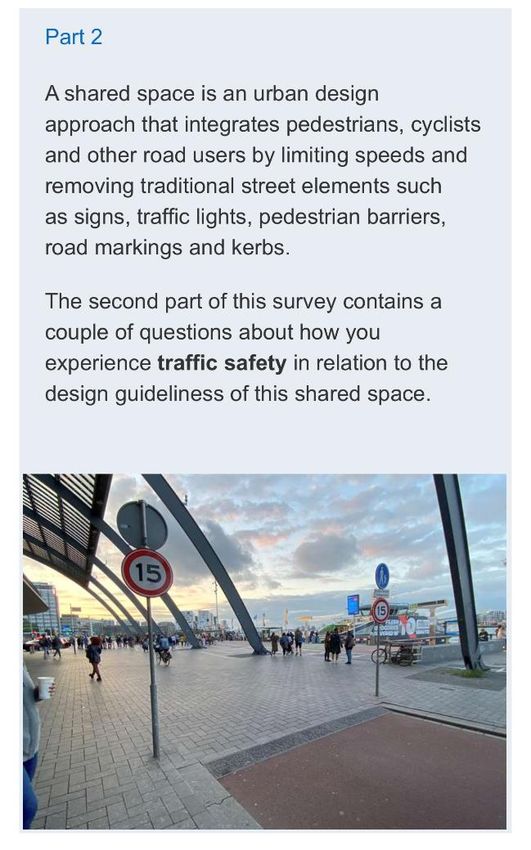
3. Methodology
In order to properly conduct this research, a methodology is described.

First a literature study will be conducted to gain more knowledge about the concept of a
shared space and the specific shared space behind Amsterdam Central Station. Information
obtained from this literature study will be used to answer the first two sub-questions. To be
able to answer the third sub-question different factors that influence traffic safety must be
distinguished. This information will be obtained from a literature study as well. To provide a
good overview of the various factors a conceptual framework will be created.

The fourth sub-question requires a better understanding about the intentions of the
development of the shared space behind Amsterdam Central Station. Therefore, an interview
with Ruwan Aluvihare will be conducted. Ruwan Aluvihare is a landscape architect and
senior chief designer at the municipality of Amsterdam. He will thus be the right person to
ask questions about the shared space behind Amsterdam Central Station.

Furthermore, as this research focusses on the subjective safety, a survey will be conducted.
This will provide a good overview of the various opinions of tourists and Dutch inhabitants
regarding the traffic safety in that shared space.

The following sections explain how each method will be conducted. Section 3.1 explains how
the literature study will be conducted. Section 3.2 describes the type of questions that will be
asked during the interview with Ruwan Aluvihare. The setup of the survey is explained in
section 3.3. Section 3.4 describes how the results of the survey will be analyzed.

3.1 Literature study
To conduct the literature study, sources on the internet are used. Google Scholar is used to
search for scientific papers. Search terms that are used include ‘influencing factors (traffic
OR road) safety’, ‘demographic factors (traffic OR road) safety’, ‘design factors (traffic OR
road) safety’. When relevant articles and reports have been found, the reference list of these
reports will also be reviewed.

3.2 Interview
For the interview with Ruwan Aluvihare, questions about the intentions of the development
and particular location of the shared space, the traffic safety, the stakeholders and whether
(and if so how) they have included the tourists in their design are asked. The interview will be
held outside and will be recorded (with permission from Ruwan Aluvihare). To be sure that
no valuable information will be lost, notes are taken during the interview as well. The
interview can be found in appendix A.

3.3 Survey description
The questions for the survey are based on the safety factors obtained from the literature
study. These include the personal data, design components of the shared space and traffic

 12
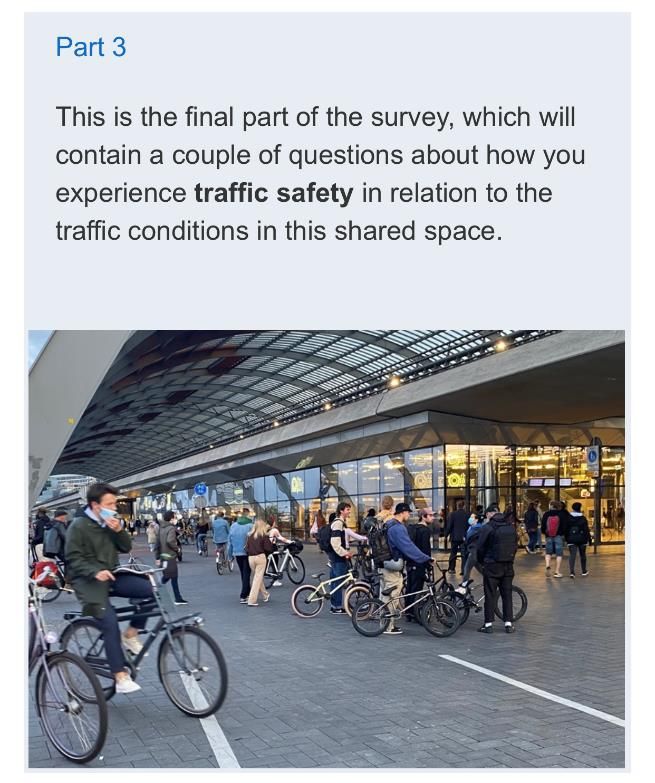
conditions. The survey is therefore divided into three parts. The survey questions can be
found in appendix B.

Part 1: Personal information

The first part of the survey consists of multiple choice questions about personal information.
This includes the following information:

 • Age
 • Gender
 • Residence
 • Mode of transportation
 • Number of people accompanying
 • Familiarity with concept
 • Purpose of visit
 • Number of previous visits

These are factors that have been discussed in the literature study and have been chosen to
be important for the research on the experience of safety at the shared space.

Part 2: Design components
The second part of the survey consists of questions about the feeling of traffic safety in
relation to the design of the shared space. This includes the following design components:

 • Absence of traffic lights
 • Limited number of traffic signs
 • Absence of road surface markings
 • Absence of kerbs
 • Absence of a clear sidewalk and bike path
 • Applied speed limit of 15 km/h
 • The space to walk and cycle.

It is crucial to investigate how participants experience traffic safety regarding these
components as these are usually applied in a traditional road intersection, but are minimized
or removed in a shared space (except for the speed limit and the space to walk and cycle,
because these are design components that usually do not apply at a traditional road
intersection but do apply at the shared space). For this part, the participants have to rate the
questions from 1 to 6, where 1 indicates a very unsafe feeling or a strong disagreement and
6 indicates a very safe feeling or a strong agreement. This means the participants have to
choose between feeling (slightly) more safe or (slightly) more unsafe.

Part 3: Traffic conditions
The last part of the survey consists of questions about the feeling of traffic safety in relation
to the traffic conditions at the shared space and contains some questions about the overall
experience. This includes the following:

 • Interaction with other road users
 • Experience of a traffic congestion
 • Experience of a collision with another road user

 13
• Experience of the overall traffic safety
 • Whether they would visit the shared space again

This part includes multiple choice and rating questions (rating from 1 to 6). The final question
provides respondents the opportunity to give feedback or comment on the research and
explain their opinion.

Setup
The survey is created using Microsoft Forms and is provided in both English and Dutch. The
survey is spread through WhatsApp and is conducted at the shared space behind
Amsterdam Central Station in order to make sure that the right respondent group is reached.
A QR code is used to share the link of the survey. The first data has been collected on Friday
September 17th. On this day 35 respondents have been reached. This data collection was a
trial and based on this trial the standard deviation (σ) for the full set of responses can be
calculated. For this calculation the question about the experience of the overall traffic safety
is used. This results in a standard deviation of 1.03. By using an accuracy (d) of 0.20 and a
Z-value of 1.96 (reliability of 95% is chosen) the sample size (n) is calculated using the
following formula:

 2
 ∝/2
 ≥ 2
 2
 Equation 1: Sample size

This results in a sample size of 102 per group (international inbound tourists and Dutch
inhabitants) and thus a sample size of 204 for the entire group. The number of days the data
needs to be collected at the shared space can now be calculated by subtracting the 35
respondents that have already been reached from the 204 that needs to be reached in total,
and dividing this number by 30 (it is assumed that 30 respondents will be reached per day).
From this it follows that the survey must be conducted for 6 more days. However, the survey
is also spread through WhatsApp and therefore it has been decided to conduct the survey at
the shared space for 5 more days. It was decided to do this on working days and mostly in
the evening as it was expected to be more busy on these days and times. Table 3 provides
an overview with the dates and times.

Table 3: Date and time survey

 Date Time

 Friday September 17th 19:30 – 21:30

 Monday September 20th 16:00 – 17:30

 Tuesday September 21st 19:30 – 21:30

 Wednesday September 22nd 18:00 – 19:30

 Thursday September 23rd 14:00 – 16:00

 Friday September 24th 20:30 – 21:30

 14
3.4 Data analysis
After the survey has been conducted, the data will be analyzed. Section 3.4.1 explains how
the descriptive analysis will be conducted. In section 3.4.2 the Mann-Whitney U test is
described. Section 3.4.3 describes the Kruskal-Wallis test.

3.4.1 Descriptive analysis

First, a descriptive analysis of the survey results will be done. Bar charts are used to
visualize the different outcomes of the survey questions that consists of more than three
answers. These include the percentage of:

 • Different age groups
 • Different types of neighbourhood
 • Number of ccompanied people
 • Purposes of the visits

By first analyzing the different groups a conclusion can be made on whether or not the
formulated null hypotheses can be tested with the Mann-Whitney U test or Kruskal-Wallis
test. If certain groups are too small they can be grouped together, but if the difference is still
too small after grouping them they are not analyzed any further.

3.4.2 Mann-Whitney U test

One of the statistical tests that will be performed is the Mann-Whitney U test. This is a
nonparametric test that compares the difference between two independent groups. In order
to use this test the data must comply with four requirements (Laerd Satistics, n.d.):
 1. Dependent variable should be ordinal or continuous
 2. Independent variable should consist of two categorical groups (for example male and
 female)
 3. Observations should be independent
 4. Variables must not be normally distributed

The hypotheses are tested by ranking the results of the survey. The lowest score is given the
lowest rank and the highest score the highest rank. The ranks of each group have to be
summed up (Field, 2009). If the ranks of the two groups differ from each other, it needs to be
determined if this difference is statistically significant. Only when the significant level is lower
than 0.05, the null hypotheses must be rejected (Hulp bij Onderzoek, 2021).

The null hypotheses that are formulated based on the suggested safety factors and safety
factors found in the literature study will be tested and are listed in table 4.

 15
Table 4: Null hypotheses Mann-Whitney U test

 1 There is no difference in the overall experience of traffic safety between different
 genders.

 2 There is no difference in the overall experience of traffic safety between different
 modes of transportation.

 3 There is no difference in the overall experience of traffic safety regarding being
 familiar with the concept.

 4 There is no difference in opinion between tourists and locals regarding the clarity of
 the traffic rules at the shared space.

 5 There is no difference in opinion between tourists and locals regarding the space to
 walk or cycle at the shared space.

 6 There is no difference in the experience of traffic safety between tourists and locals
 regarding the absence of traffic lights in the shared space.

 7 There is no difference in the experience of traffic safety between tourists and locals
 regarding the limited number of traffic signs in the shared space.

 8 There is no difference in the experience of traffic safety between tourists and locals
 regarding the absence of road surface markings in the shared space.

 9 There is no difference in the experience of traffic safety between tourists and locals
 regarding the absence of kerbs in the shared space.

 10 There is no difference in the experience of traffic safety between tourists and locals
 regarding the absence of a sidewalk/bike path in the shared space.

 11 There is no difference in the experience of traffic safety between tourists and locals
 regarding the applied speed limit (15 km/h) in the shared space.

 12 There is no difference in the experience of traffic safety between tourists and locals
 regarding the interaction with other road users at the shared space.

 13 There is no difference in the overall experience of traffic safety between tourists
 and locals.

It is expected that the following hypotheses will be rejected:

 • Null hypothesis 1
 Due to the general assumption that men are less fearful compared to women

 • Null hypotheses 3
 Someone who is familiar with the concept knows what to expect of the traffic
 situation and therefore might feel more safe than someone who is unfamiliar.

 • Null hypothesis 10
 A lot of countries do not have (as many) bike paths as the Netherlands does.
 Therefore, tourists might not miss this design aspect in the shared space

 16
• Null hypotheses 12
 Tourists might not be used to the many cyclists that we have in the Netherlands.
 Therefore, this interaction might be overwhelming for them compared to locals who
 are already used to the behaviour of the cyclist.

 • Null hypotheses 13
 It is assumed that locals are used to the traffic situations in the Netherlands, while
 tourists might have never even seen such a shared space in their own country.

3.4.3 Kruskal-Wallis test

The other statistical test that is performed is the Kruskal-Wallis test. This test follows the
same steps as the Mann-Whitney U test. The only difference is that this test compares the
difference between three or more independent groups. The null hypotheses that will be
tested with the Kruskal-Wallis test are listed in table 5. These hypotheses are formulated
based on the safety factors found in the literature study.

Table 5: Null hypotheses Kruskal-Wallis test

 14 There is no difference in the overall experience of traffic safety between different age
 groups.

 15 There is no difference in the overall experience of traffic safety regarding the purpose
 of the visit to the shared space.

 16 There is no difference in the overall experience of traffic safety regarding the number
 of accompanied people to the shared space.

 17 There is no difference in the overall experience of traffic safety regarding the number
 of previous visits to the shared space.

 18 There is no difference in the overall experience of traffic safety regarding different
 types of neighbourhood where respondents live.

It is expected that the following null hypotheses will be rejected:

 • Null hypothesis 14
 Elderly people might feel less safe than younger people as they are less responsive
 to a traffic situation, which can scare them off and make them feel unsafe

 • Null hypothesis 16
 The larger the number of accompanying people, the more safe one might feel
 because it can feel more protected.

 • Null hypothesis 18
 Someone who lives in a rural area might not be used to such a busy space and might
 feel less safe than someone who is already used to the busy city life with a high
 traffic density.

 17
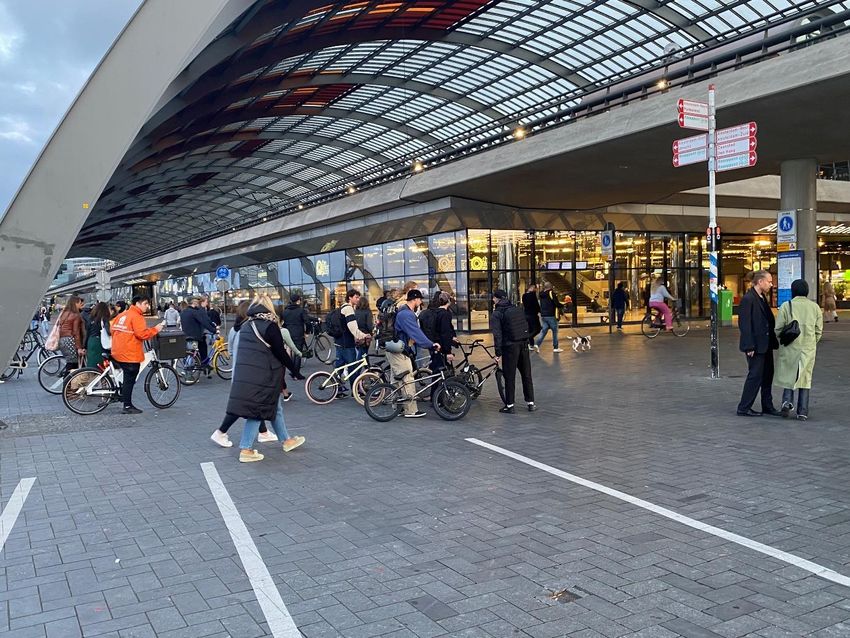
4. Results
This chapter gives an overview of the results of the research. Section 4.1 provides a
summary of the interview with Ruwan Aluvihare. The full interview can be found in appendix
A. In section 4.2 the results of the survey are analyzed.

4.1 Interview
Ruwan Aluvihare, landscape architect and senior chief designer at the municipality of
Amsterdam, provided more information about the shared space behind Amsterdam Central
Station during an interview. He has spent years trying to get this concept through in
Amsterdam and became a spokesperson for the promotion of this project (shared space
behind Amsterdam Central Station). Though he is not the designer of this project, he played
a major role in designing the shared space at Leidseplein as well as many other public
spaces.

 NORTHSIDE

 WEST SIDE EAST SIDE
 SHARED SPACE

 TAXI LOOP
 SOUTH
 SIDE

 Figure 7: Top view shared space (V&OR, 2016)

The research at the location behind Central Station took some time before the conclusion on
how the traffic regulations in the area was arrived at. It revealed that normal traffic rules
would not be applicable here because of the abnormal traffic flows that converge from
different directions. For example, road users via the tunnel as well as those using the bike
paths and the passengers from the city ferry lines which adds to the crowd density when they
leave the ferry simultaneously. Therefore, the city ferry lines were the main reason to
suggest a shared space.

 18
Figure 8: City ferry line (NRC, n.d.)

A lot of politicians as well as disabled people had serious doubts about this project. There
were about thirty to forty stakeholders involved, including the traffic committee (the police,
fire brigade, etc.), the GVB and Central Station. Tourists were not involved in this project.
Eventually, alderman Litjens decided to conduct a pilot project for six months to see whether
the concept works. This led to the development of the shared space.

One of the important aspects of the shared space was the size. A shared space should be
spacious enough for the road users to pass each other. Another important aspect were the
mopeds, because they sometimes drive very fast. By introducing road bumps and traffic
signs, that indicate a speed limit of 15 kilometers per hour, before the shared space they
should be aware that they have to slow down their speed.

To measure the objective safety at the shared space, the municipality of Amsterdam
analyses incidents involving road users. They film the area 24/7 and register the number of
incidents. No research has been conducted regarding the traffic safety of tourists and
therefore Ruwan thinks this is very relevant as Amsterdam attracts so many of them.

An interesting fact is that Ruwan developed a bicycle street (‘fietsstraat’) at the
Sarphatistraat. In this street cars have to give priority to cyclists. Even though it has the same
principle, it is not officially applied as a shared space because of the rules applied. The
development of this street resulted in an increase of cyclists on this street by 16%. People
felt thus more safe in this street than they did before and it has become an even bigger
success than shared space.

4.2 Survey
In this section the results of the survey are analyzed. Section 4.2.1 provides a descriptive
analysis of the survey results. In section 4.2.2 the results of the Kruskal-Wallis test are
provided. Section 4.2.3 provides the results of the Mann-Whitney U test.

 19
4.2.1 Descriptive analysis

In total 254 respondents have filled out the survey, including 85 international inbound
tourists. While filtering the data it was observed that ten respondents indicated to be an
international inbound tourist while also selected Amsterdam as their place of residence.
These two answers contradict each other and therefore all the answers of these ten
respondents have been removed from the list. Furthermore, one respondent answered
‘prefer not to say’ to multiple questions, including the question whether he or she is an
international inbound tourist or not. Therefore it has been decided to remove the answers of
this respondent from the list as well. This means 75 international inbound tourists and 168
locals remain for further data analysis.

Residence
53.5% of the respondents live in Amsterdam. Only 14% lives at a different location in the
Netherlands. This could be explained by the fact that the survey was conducted at the
shared space in Amsterdam and therefore there is a higher chance that people who walk
there live in Amsterdam. 30% of the respondents live in Europe and only 2.5% lives outside
Europe. This means the majority of the tourists live in Europe.

Type of neighbourhood
When looking at the different types of neighbourhood in figure 9, it is observed that 74.7% of
the tourists and 79.2% of the locals live in a city. This is 77.8% of the total respondents. Only
a small percentage lives either in a suburb, village, countryside or another type of
neighbourhood. It is no surprise that the majority of the respondents live in a city, because
more than half of the respondents indicated to live in Amsterdam, which is a city. The
difference in percentage between living in a city and living in any other type of
neighbourhood is too big to give a reliable comparison. Therefore, hypothesis 18 will not be
analyzed any further and will thus also not be tested with the Kruskal-Wallis test.

 Type of neighbourhood
 90
 79,2
 80 74,7
 Percentage of respondents

 70

 60

 50

 40

 30

 20 13,1
 10,7
 8 6,6
 10 3,6
 2,4 1,7
 0
 0
 City Countryside Suburb Village Other

 Tourist Local

 Figure 9: Type of neighbourhood

Gender
The gender distribution is not equal among the respondents. 2% of the respondents
preferred not to mention their gender. From the respondents who did indicate their gender,
58.1% are female and 41.9% are male. Hypothesis 1, which is related to the experience of
traffic safety between different genders, can be tested with the Mann-Whitney U test because
the difference between the total amount of respondents is not too big. However, the sub-
groups are also analyzed separately, because a different distribution between the sub-

 20
groups can have an influence on the other safety factors. It is observed that both groups
consist of more women than men. 60.8% of the tourists are female while 39.2% are male.
Among the locals the difference is smaller: 56.9% are female and 43.1% are male. This
should be taken into account when the test indicates a statistically significant difference
between genders.

Age groups
43.2% of the total respondents are between 18 and 25 years old. As can be seen I figure 10
this includes 48% of the tourists and 41.1% of the locals. 28% of both subgroups are
between 26 and 35 years old. Other age groups are much less in common among the
respondents. The age group 65+ has the lowest percentage and none of the tourists are
aged 56 or older. This can be explained by the fact that there were not many elderly people
present when conducting the survey at the shared space. This could be related to other
factors, such as the time at which the survey was conducted or they might rather avoid this
busy traffic space. To be able to investigate whether there is a difference in the experience of
traffic safety between different age groups, the groups must be large enough to compare
them to each other. Therefore, the age group below 18 years old is grouped together with the
age group 18 – 25 and the age groups of 46 – 55, 56 – 65 and >65 are grouped together with
the age group of 36 – 45. In this way three age groups are formed: below 26, 25 – 36 and
above 36. The Kruskal-Wallis test is performed to compare these age groups.

 Age groups
 60
 Percentage of respondents

 50 48

 41,1
 40

 30 28 28

 20
 10,7 11,3
 8 7,1 8,3
 10 5,3
 3,6
 0 0 0,6
 0
 < 18 18 - 25 26 - 35 36 - 45 46 - 55 56 - 65 > 65

 Tourist Local

 Figure 10: Age groups

Mode of transportation
The distribution of cyclists and pedestrians is almost equal: 47.7% of the respondents walked
in the shared space, 50.6% cycled and 1.7% preferred not to mention their mode of
transportation. Out of the tourists who did indicate their mode of transportation, 78.4%
walked and only 21.6% cycled. This is a very large difference. When comparing this to the
locals it is distributed the other way around: 64.8% cycled and 35.2% walked to the shared
space. This could be explained by the fact that the Netherlands is a cycling country and a lot
of locals use a bike. Null hypothesis 2 is related to the entire group of respondents and as
this only differs by 2.9%, the difference in experience of traffic safety with different modes of
transportation (that is either walk or bicycle) can be tested with the Mann-Whitney U test.
However, also in this case it must be taken into account that a statistically significant
difference between different modes of transportation can influence the outcome of other tests
regarding different safety factors because the subgroups are not equally distributed.

 21
Accompanied people
0.4% of the respondents preferred not to mention how many people accompanied them.
42.4% of the respondents entered the shared space by themselves. Only a few respondents
were accompanied by two, three or more than three people. As these groups are quite small
they are grouped together. In this way a more reliable outcome can be obtained when
comparing the different groups to each other. This means that three groups are formed: the
group that visited the shared space by themself, the group that was accompanied by one
other person and the group that was accompanied by two or more people. These groups are
tested with the Kruskal-Wallis test. When looking at the subgroups in figure 11, it is observed
that 35.1% of the tourists were accompanied by one other person. An equal amount of
tourists were just by themselves or accompanied by three or more people. This could be
explained by the fact that most of the tourists travel within a group when visiting a country.
When looking at the locals, the majority visited the shared space by themselves and only
4.1% were accompanied by more than three people. This unequal division can have an
influence on the statistical tests related to other safety factors and therefore has to be taken
into account when hypothesis 16 is found to be statistically significant different.

 Accompanied people
 60
 53

 50
 Percentage of respondents

 40
 35,1

 28,6
 30

 18,9 17,6 18,9
 20

 9,5 10,7
 10
 3,6 4,1

 0
 By myself +1 +2 +3 >3

 Tourist Local

 Figure 11: Accompanied people

Purpose visit
Of the total respondents, 0.4% preferred not to indicate the purpose of their visit. ‘On the go’
was the most common answer: 44.9% of the respondents indicated this. 25.9% visited the
shared space for leisure, 8.6% for study and 15.2% for work. The number of respondents
who visited the area for study or work are added together to make the group bigger and a
more reliable comparison can be made. The option ‘other’ was chosen by 5% of the
respondents and as it is not known what other purposes are meant, this group will be left out
when comparing them with the Kruskal-Wallis test. This means again three groups are
formed: on the go, leisure and study/work. When looking at the tourists and locals separately
in figure 12, it can be observed that 50% of the locals visited the shared space for leisure,
while 43.3% of the tourists were on the go when visiting the shared space. This should be
kept in mind when performing the Kruskal-Wallis test.

 22
You can also read