Evaluation of Integrated Nowcasting through Comprehensive Analysis (INCA) precipitation analysis using a dense rain-gauge network in southeastern ...
←
→
Page content transcription
If your browser does not render page correctly, please read the page content below
Hydrol. Earth Syst. Sci., 25, 4335–4356, 2021
https://doi.org/10.5194/hess-25-4335-2021
© Author(s) 2021. This work is distributed under
the Creative Commons Attribution 4.0 License.

Evaluation of Integrated Nowcasting through Comprehensive
Analysis (INCA) precipitation analysis using a dense
rain-gauge network in southeastern Austria
Esmail Ghaemi1,2 , Ulrich Foelsche1,2 , Alexander Kann3 , and Jürgen Fuchsberger2
1 Institute
         for Geophysics, Astrophysics, and Meteorology/Institute of Physics (IGAM/IP),
NAWI Graz, University of Graz, Graz, Austria
2 Wegener Center for Climate and Global Change (WEGC), University of Graz, Graz, Austria
3 Department of Forecasting Models, Central Institute for Meteorology and Geodynamics (ZAMG), Vienna, Austria

Correspondence: Esmail Ghaemi (esmail.ghaemi@uni-graz.at)

Received: 18 January 2021 – Discussion started: 15 February 2021
Revised: 22 June 2021 – Accepted: 30 June 2021 – Published: 6 August 2021

Abstract. An accurate estimate of precipitation is essential     than during the second period, with an average of 12.5 %. Re-
to improve the reliability of hydrological models and helps in   garding precipitation detection, INCA performs better during
decision making in agriculture and economy. Merged radar–        the wet seasons. Generally, false events in INCA happen less
rain-gauge products provide precipitation estimates at high      frequently in the cells closer to the ZAMG stations than in
spatial and temporal resolution. In this study, we assess the    other cells. The number of true events, however, is compa-
ability of the INCA (Integrated Nowcasting through Com-          rably low closer to the ZAMG stations. The difference be-
prehensive Analysis) precipitation analysis product provided     tween INCA and WegenerNet estimates is more noticeable
by ZAMG (the Austrian Central Institute for Meteorology          for extremes. We separate individual events using a 1 h mini-
and Geodynamics) in detecting and estimating precipitation       mum inter-event time (MIT) and demonstrate that INCA un-
for 12 years in southeastern Austria. The blended radar–         derestimates the events’ peak intensity until 2012 and over-
rain-gauge INCA precipitation analyses are evaluated us-         estimates this value after mid-2012 in most cases. In gen-
ing WegenerNet – a very dense rain-gauge network with            eral, the precipitation rate and the number of grid cells with
about one station per 2 km2 – as “true precipitation”. We        precipitation are higher in INCA. Considering four extreme
analyze annual, seasonal, and extreme precipitation of the       convective short-duration events, there is a time shift in peak
1 km × 1 km INCA product and its development from 2007           intensity detection. The relative differences in the peak inten-
to 2018. From 2007 to 2011, the annual area-mean precip-         sity in these events can change from approximately −40 % to
itation in INCA was slightly higher than WegenerNet, ex-         40 %. The results show that the INCA analysis product has
cept in 2009. However, INCA underestimates precipitation         been improving; nevertheless, the errors and uncertainties of
in grid cells farther away from the two ZAMG meteorolog-         INCA to estimate short-duration convective rainfall events
ical stations in the study area (which are used as input for     and the peak of extreme events should be considered for fu-
INCA), especially from May to September (“wet season”).          ture studies. The results of this study can be used for further
From 2012 to 2014, INCA’s overestimation of the annual-          improvements of INCA products as well as for future hydro-
mean precipitation amount is even higher, with an average        logical studies in regions with moderately hilly topography
of 25 %, but INCA performs better close to the two ZAMG          and convective dominance in summer.
stations. Since new radars were installed during this period,
we conclude that this increase in the overestimation is due to
new radars’ systematic errors. From 2015 onwards, the over-
estimation is still dominant in most cells but less pronounced

Published by Copernicus Publications on behalf of the European Geosciences Union.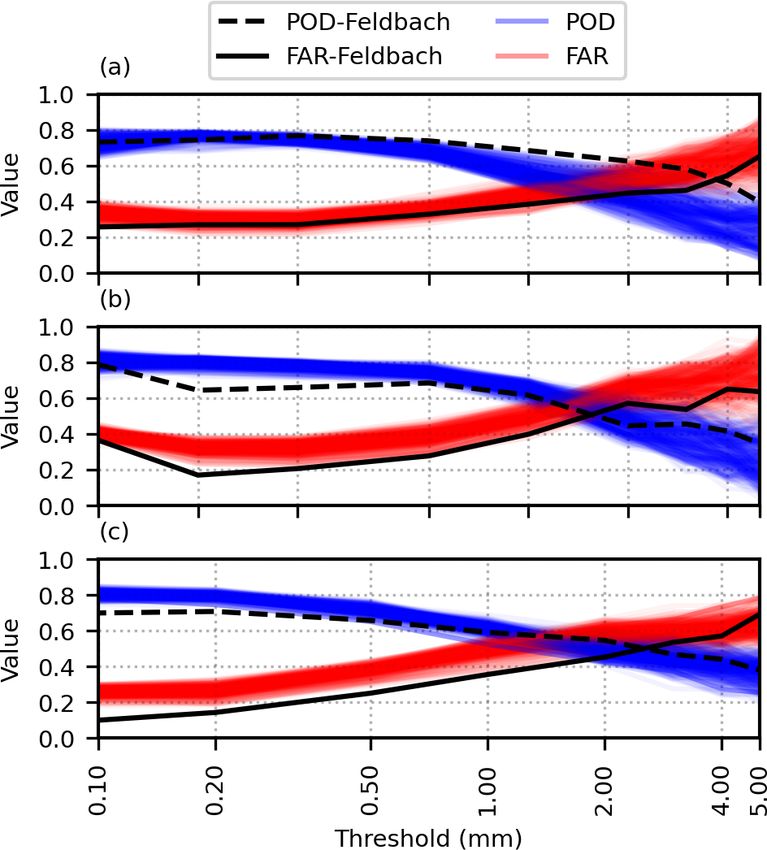
4336 E. Ghaemi et al.: Evaluation of INCA precipitation analysis using a dense rain-gauge network
1 Introduction rology and Geodynamics (ZAMG) provides high-resolution
precipitation analyses and nowcasts by combining ground
Precipitation is one of the most important components of the station, remote sensing, high-resolution topographic data,
hydrological cycle and plays a crucial role in shaping the and NWP data. INCA’s meteorological products are used, for
Earth’s climate. It can trigger numerous natural hazards such example, as inputs for flood forecasting in the Alpine region
as flash floods, soil erosion, and landslide, which often jeop- and winter rail maintenance (Kann and Haiden, 2011).
ardize human life and can cause tremendous economic loss The aim of this study is to evaluate INCA precipitation
(Lengfeld et al., 2020). More accurate precipitation estimates analyses over a period of 12 years, using gridded precipita-
improve the reliability of hydrological models and numerical tion fields that are generated based on the dense WegenerNet
weather prediction models (NWPs) and can lead to a better weather and climate station network in southeastern Austria.
understanding of uncertainties in climate model outputs. Fur- The main focus lies on analyzing the ability of INCA to de-
thermore, having a reliable estimate of precipitation is vital tect and estimate precipitation and on studying the impact
for decision making in hydrology, agriculture, and the econ- of modifications of INCA algorithms and input data during
omy (Ebert et al., 2007). Since the characteristics of a pre- these 12 years. We analyze annual data, seasonal data, and
cipitation event can change rapidly in both time and space, extremes using different metrics. Moreover, INCA’s detec-
accurate estimates with high spatial and temporal resolution tion skill is studied using categorical metrics. Furthermore,
remain challenging, especially in smaller-scale events (Vil- we identify individual events using a simple threshold based
larini et al., 2008). on the interval between two consecutive events and compare
Rain gauges have been used as direct measuring devices the events’ characteristics in both datasets. Finally, we sep-
to estimate precipitation for decades. Besides station-based arately study extreme convective short-duration events and
data, remote sensing estimates, such as weather radar and demonstrate four representative examples. The following re-
satellite data, are meanwhile widely used. Each of these ap- search questions are addressed and discussed in this study.
proaches has its strengths and weaknesses. For instance, rain
gauges are more accurate in measuring intensity due to their 1. How well can INCA detect and estimate precipitation in
direct measurement techniques. However, a spatially dense an area with a moderate topography?
gauge network is required to detect small-scale convective 2. How did the developments in the Austrian radar net-
events. Moreover, gauge data are subject to different types work affect INCA’s performance?
of errors, such as wind undercatch (Habib et al., 2001; Pol-
lock et al., 2018; Schleiss et al., 2020). Furthermore, most 3. How reliable are INCA estimates of extremes?
rain gauges in mountainous areas are located in the valleys,
which can lead to an underestimation of orographic rainfall This paper is structured as follows. In Sect. 2, we introduce
in those areas (Ebert et al., 2007). the study area and each dataset’s main features; in Sect. 3,
On the other hand, satellites can cover the entire globe, and the methodology is described. The results based on different
weather radars have a high spatial resolution. They can esti- timescales and individual events are discussed in Sect. 4, and
mate precipitation using various ranges of electromagnetic we conclude in Sect. 5.
waves. Radar estimates are based on converting reflectivity
of hydrometeors to rain rate (also known as the Z–R rela- 2 Study area and datasets
tionship), and different sources of errors and uncertainties
can have considerable effects on these estimates. Beam over- 2.1 WegenerNet
shooting, partial beam filling, non-uniformity in the vertical
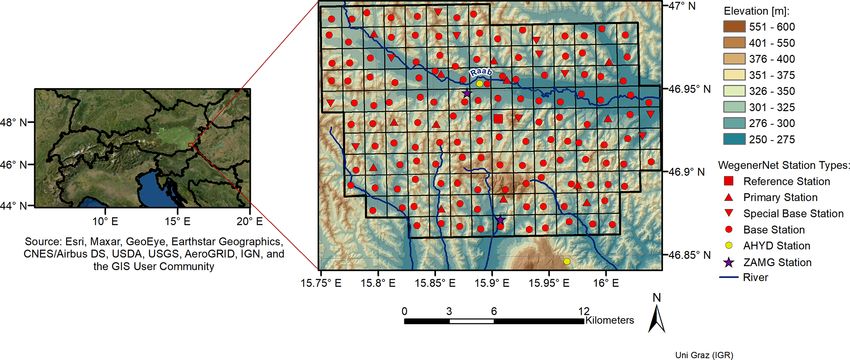
profile of reflectivity (VPR), hardware calibration, a fixed Z– The WegenerNet network is a dense climate station network
R relationship for different precipitation types, and random located in the Feldbach region in southeastern Austria (see
sampling errors are some examples of weather radar errors Fig. 1). The network includes 155 ground stations, almost
(AghaKouchak, 2010). uniformly spread over an area of about 22 km × 16 km (i.e.,
In general, considering these two approaches to be com- about 1 station per 2 km2 ) provided by the Wegener Cen-
plementary and merging them can lead to more reliable es- ter for Climate and Global Change, University of Graz, Aus-
timates with a higher resolution (Goudenhoofdt and De- tria (Kirchengast et al., 2014; Fuchsberger et al., 2021b). The
lobbe, 2009). Using multiple sources of data, including radar, highest altitude in this region is 609 m a.m.s.l. (above mean
gauges, and model outputs, is beneficial to overcome some sea level), located in the southern part. The altitude decreases
of the limitations addressed above (Ayat et al., 2021). How- northward to the valley of the Raab River (see Fig. 1). The
ever, the aforementioned errors and weaknesses in both rain Feldbach region is affected by both Mediterranean and con-
gauges and radar estimates can still affect the reliability of tinental climates. Most of the precipitation occurs from May
the merged data and need to be considered (Haiden et al., until September (here defined as the “wet season”), when
2011). The Integrated Nowcasting through Comprehensive monthly average precipitation is approximately twice as high
Analysis (INCA) of the Austrian Central Institute for Meteo- as during the “dry season” from October to April (O and
Hydrol. Earth Syst. Sci., 25, 4335–4356, 2021 https://doi.org/10.5194/hess-25-4335-2021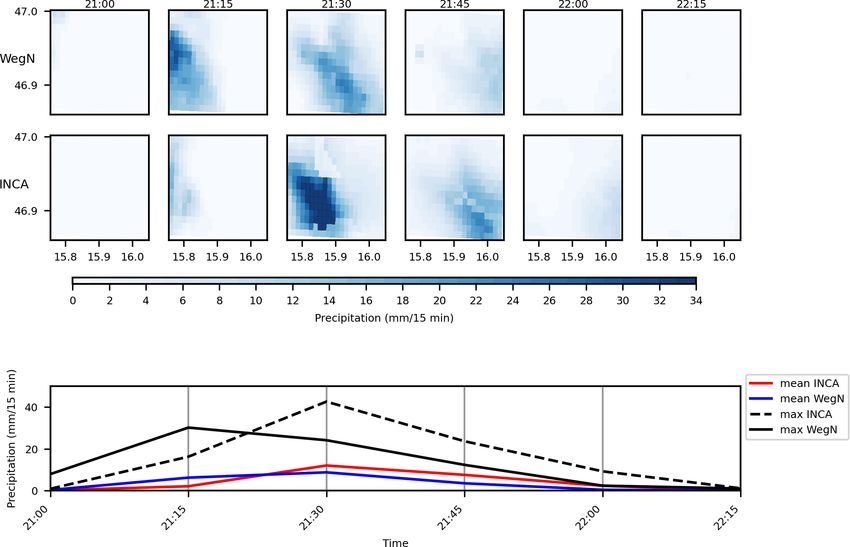
E. Ghaemi et al.: Evaluation of INCA precipitation analysis using a dense rain-gauge network                               4337

Foelsche, 2019). Considering that the average number of            ber, the spatial variability in rainfall is higher than from
days with fresh snow in this area is less than 15 d during 1971    October to April due to a higher proportion of convective
to 2000 (Prettenthaler et al., 2010) and has been decreasing       events. Based on their results, the high density and the reg-
over time, snowfall is relatively unimportant in this area.        ular distribution of WegenerNet stations generate spatially
   Based on different instrumentations, WegenerNet includes        homogeneous gridded rainfall fields. A complete up-to-date
five different station types (reference, primary, special base,    list of WegenerNet-related literature can be found at https:
base, and external stations). The base and special base sta-       //wegcenter.uni-graz.at/en/wegenernet/publications/ (last ac-
tions in addition to an external station (141 stations in total)   cess: 30 June 2021).
have unheated sensors to measure liquid precipitation. On
the other hand, the primary and reference stations and an-         2.2   INCA
other external station (14 stations in total) are equipped with
heated sensors, and therefore they can measure snow and            The INCA precipitation analysis provides data on a
other forms of frozen precipitation too. We refer to Fuchs-        1 km × 1 km spatial grid with 15 min temporal resolution,
berger et al. (2021b) for more details on the different station    using a combination of rain-gauge data, weather radar esti-
types. WegenerNet has provided station time series and grid-       mates, and high-resolution topography (Haiden et al., 2011).
ded datasets (based on the station data) of temperature, hu-       The following data are used as input for generating the INCA
midity, precipitation, and other parameters with 5 min tempo-      precipitation analysis product.
ral resolution since January 2007. The raw measurements are          – The topography, based on digital elevation data pro-
checked by seven layers of the quality control system (QCS),           vided by the United States Geological Survey (USGS).
from checking station operation and availability to intersta-
tion consistency. For detailed descriptions of the quality con-      – Precipitation data from about 250 semi-automatic
trol system, we refer to Kabas et al. (2011b), Kirchengast et          ground stations (Teilautomatische Wetterstationen,
al. (2014), Scheidl (2014), and Fuchsberger et al. (2021b). In         TAWES), operated by the ZAMG, with an average inter-
this study, we used WegenerNet gridded data from Wegen-                station distance of 18 km, all of them located in Austria
erNet’s level-2 data (Fuchsberger et al., 2021a), generated            and two of them in the study area. Note that more sta-
with the inverse-distance-squared weighting method based               tions have been added to the INCA analysis algorithm
on quality-controlled station data and provided on a 200 m             during the study period.
grid. WegenerNet data have been validated against data from
operational weather stations (O et al., 2018) and are shown          – Precipitation data from the Austrian hydrographic ser-
to have a reliable performance in terms of magnitude, fre-             vice (AHYD), which were added over time.
quency, and the exact location of extreme events (O and              – Radar data from five Austrian C-band radars, supple-
Foelsche, 2019). The data have been used as a reference in             mented by data from weather radars of neighboring
multiple validation studies, a selection of which is addressed         countries. Starting from 2011, four of the Austrian
below.                                                                 radars were replaced by new ones (see Table B1 for
   Kann et al. (2015) used WegenerNet data to validate                 more details).
6 months of INCA data (see Sect. 2.2), and O et al. (2017)
used WegenerNet data as a reference to evaluate satellite          INCA data are generated based on a Lambert conformal
data from the Global Precipitation Measurement (GPM) mis-          conic projection as a coordinate system, with reference lati-
sion. Based on half-hourly Integrated Multi-satellitE Re-          tudes 46 and 49◦ N and a central reference point at 47◦ 300 N,
trievals for GPM (IMERG) rainfall estimates for the period         13◦ 200 E. Steps taken to produce INCA precipitation analy-
of April–October in 2014 and 2015, the results indicate that       ses are described by Haiden et al. (2011). A brief summary
all IMERG products perform better in estimating moderate           of this process is given below.
rainfall (0.3 to 3 mm per 30 min) than light and heavy rainfall
events. In general, IMERG Early and IMERG Late overesti-            1. Interpolation of station data using inverse-distance-
mate low rain rates, and all three IMERG runs tend to under-           squared weighting. Note that there are two ZAMG sta-
estimate heavy rain. In another study, Lasser et al. (2019) di-        tions in the study area, namely, Feldbach station (11298)
rectly evaluated space-based GPM dual-frequency precipita-             and Bad Gleichenberg (11244), which measure precip-
tion radar (DPR) estimates using WegenerNet gridded fields             itation with 1 min temporal resolution. These two sta-
and showed that GPD DPR products tend to underestimate                 tions were added to this step in September 2011. Note
rainfall.                                                              that the average horizontal distance between ZAMG sta-
   O and Foelsche (2019) analyzed the spatial variability of           tions is approximately 18 km for the whole of Austria.
heavy rainfall events using WegenerNet gridded data. In ad-            The distance between Station 11298 and Station 1224,
dition, they described the dependency of area-mean rain-               however, is approximately 10 km.
fall on the number of gauges and temporal resolution during
heavy events. The study showed that from May to Septem-

https://doi.org/10.5194/hess-25-4335-2021                                       Hydrol. Earth Syst. Sci., 25, 4335–4356, 2021
4338                        E. Ghaemi et al.: Evaluation of INCA precipitation analysis using a dense rain-gauge network

Figure 1. Location and topography of the study area and locations of WegenerNet stations.

  2. Climatological scaling of the radar data using a clima-           ting, and errors due to non-meteorological echoes may still
     tological scaling factor to partially correct topographic         exist in INCA precipitation products.
     shielding. The scaling factor is the ratio between the               The WegenerNet and INCA datasets are generated dif-
     multi-year, 3-monthly accumulated precipitation from              ferently regarding topography; i.e., WegenerNet is based on
     the station data and the corresponding accumulated                a simple inverse distance weighting (IDW) method, while
     radar precipitation data.                                         INCA is generated considering the elevation effect. It should
                                                                       be noted that the INCA analysis dataset is produced for the
  3. Rescaling radar data using the latest observations: based         whole of Austria. Since parts of Austria are covered by the
     on the comparison of observations and radar fields at             Alps and their topography can significantly affect the precip-
     the station locations, the fields from the last step are          itation estimates, these effects are considered in the INCA
     rescaled again. The rescaling is a weighted average of            algorithm. However, the Feldbach region is located in a mod-
     the ratio between the data from the radar and the nearest         erately hilly landscape, and the difference between the high-
     rain gauge, where the weight decreases with increasing            est and lowest altitudes is approximately 300 m. So, we do
     distance, increasing difference in climatological scal-           not expect that topography can significantly affect the re-
     ing, and decreasing rain at the station.                          sults in this area. Also, we did not find any systematic ef-
                                                                       fect due to topography in our study (see Sect. 3.4). Haiden
  4. Final combination: the precipitation fields from steps 1
                                                                       et al. (2011) presented INCA analysis and nowcasting prod-
     and 3 are combined into INCA fields through a weight-
                                                                       ucts. In the study, they verified these products for the whole
     ing relationship, where the weight factor decreases with
                                                                       of Austria for a summer month and a winter month in 2009
     increasing climatological scaling. At the station loca-
                                                                       and 2010, respectively. Kann and Haiden (2011) assessed
     tions, INCA is equal to the interpolated station field of
                                                                       the INCA analysis product for four events in 2008 in four
     step 1. Between the stations, the weight of radar infor-
                                                                       different regions. Kann et al. (2015) used WegenerNet sta-
     mation increases. In the areas where the radar return is
                                                                       tion data to evaluate 5 min INCA analysis data (rapid-INCA)
     weak due to orographic shielding, the analysis reduces
                                                                       for the wet season (April–September) of 2011 and four dif-
     to station interpolation, considering elevation effects.
                                                                       ferent heavy precipitation events. The study showed a gen-
Related to this study, it should be noted that the closest             eral underestimation in rapid-INCA during the wet season.
radars to the study area are Zirbitzkogel (approx. 100 km)             The rapid-INCA also underestimated the average precipita-
and Rauchenwarth (approx. 140 km) (see Table B1). Consid-              tion rate in three out of four events. They also showed the
ering these distances and the mountains between the study              roles of rain gauges and radars in rapid-INCA analysis per-
area and radars, the minimum detection height by the radar             formance.
network in the study area is about 2000 m above the ground,               However, the purpose of this study is to evaluate the INCA
leading to detection and estimation errors. Based on Kann et           analysis product for 12 years (from 2007 to 2018) to show
al. (2015), the ground clutter correction is the only correction       the changes in the INCA performance due to the installation
of radar data. Hence, some errors such as bright band, signal          of new radars and improving the INCA algorithm. Also, the
attenuation, scan strategy, radar miscalibration, radome wet-          performance of INCA to estimate precipitation extremes is

Hydrol. Earth Syst. Sci., 25, 4335–4356, 2021                                           https://doi.org/10.5194/hess-25-4335-2021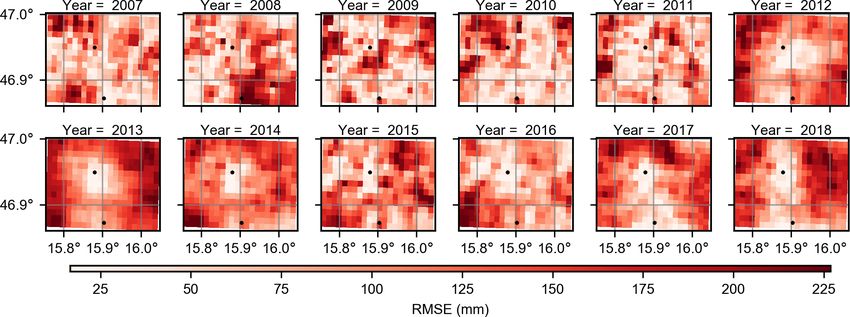
E. Ghaemi et al.: Evaluation of INCA precipitation analysis using a dense rain-gauge network                                     4339

shown using 12 years of data. In addition, an event-based            a high proportion of convective events, and the other months
approach is implemented to analyze all the individual events         (October to April) have noticeably less precipitation (here-
during these 12 years.                                               after dry season). To determine possible dependencies on the
                                                                     seasonality, we separately compare INCA and WegenerNet
                                                                     in the wet and dry seasons, respectively.
3     Methodology                                                       Since the Austrian weather radars overlook events that
                                                                     happen lower than about 2000 m above the ground in this re-
3.1    Data preparation
                                                                     gion (due to radar beam blockage by the surrounding moun-
Precipitation data from 2007 to 2018 are used in this study.         tains) and the radar data are only corrected for ground clutter,
After transforming WegenerNet gridded data to the Lam-               some detection errors such as missing events and classify-
bert conformal conic projection, we used the conservative            ing non-precipitation phenomena as precipitation can occur.
remapping scheme (Jones, 1999) to generate 1 km gridded              We implement three indices, probability of detection (POD),
fields (see Fig. B1). The conservative remapping scheme is           false alarm ratio (FAR), and critical success index (CSI)
based on preserving water flux and has been widely used as a         (Wilks, 2011), to address these errors in INCA. We calcu-
remapping scheme for precipitation observations and climate          late POD and FAR indices for each grid cell, classifying them
model outputs (e.g., Chen and Knutson, 2008; O’Gorman,               into seven different precipitation intensities from 0.1 to 5 mm
2012; Nikulin et al., 2012; Sillmann et al., 2013; Prein and         per 15 min. We then illustrate them for each pixel in order to
Gobiet, 2017; Tapiador et al., 2020; Fallah et al., 2020). We        analyze possible dependencies on the distance from the two
accumulated the 5 min WegenerNet data to 15 min to have              ZAMG stations.
the same temporal resolution in both datasets. As an exam-              One way to address extreme precipitation is to consider the
ple, Fig. 2 shows an intense precipitation event in May 2009         higher part of the intensity distribution (e.g., 99th quantile)
in INCA and WegenerNet gridded data with 15 min temporal             as a threshold and calculate the average intensity of all time
resolution.                                                          steps with higher intensities (the highest 1 %). The benefit of
   Although WegenerNet gridded data are generated from               using this approach is that it includes changes in all events
quality-controlled station data (Kirchengast et al., 2014),          above the threshold (Haylock and Nicholls, 2000). We con-
some errors may still remain in the data. The Mahalanobis            sider all events equal to or more than 0.1 mm per 15 min that
distance method – an approach to find multivariate outliers          happened in both datasets simultaneously and then calculate
(Ben-Gal, 2005) – was implemented to detect these possible           the average intensity of the highest 1 % for each dataset.
errors in WegenerNet gridded data. A brief explanation of               Since event-based analysis is important for some hydro-
this approach can be found in Appendix A. We only found a            logical studies, such as soil erosion and runoff generation, we
few grid cells that had to be treated as outliers for parts of the   separate events in each dataset and evaluate INCA’s ability
measurement period (see Table A1): Station 44 is peculiar            from this perspective. We use a simple threshold based on the
because it is located on top of a tall building, at 55 m above       minimum dry period between two consecutive events (min-
ground, and therefore suffers from stronger wind-induced             imum inter-event time, MIT) to separate individual events.
undercatch. Station 145 is another outlier, which was de-            This approach has been used in different studies (e.g., Brown
tected by the WegenerNet team in 2015, which led to a re-            et al., 1985; Haile et al., 2011) to identify individual events. A
placement of its rain gauge. Since we found only a few out-          wide range of MIT values has been selected in the literature.
liers, it can be concluded that the operational quality control      Choosing different MIT values leads to different character-
system of WegenerNet can filter outliers reasonably well.            istics of derived events. There should be a compromise be-
                                                                     tween the independency of events and intra-event variability
3.2    Approaches                                                    (Dunkerley, 2008). Since the study is affected by both con-
                                                                     vective and large-scale systems, we choose the MIT value
We use the annual area-mean precipitation and compare it             to be 1 h and the minimum precipitation to be 0.1 mm per
in both datasets to gain a general overview of INCA devel-           15 min at any pixel. After separating events based on these
opments and find possible systematic errors. The annual dif-         criteria for each dataset, we analyze the characteristics of
ference between the two datasets in each pixel is also calcu-        these events, such as event duration, accumulated precipita-
lated to portray the spatial pattern and the possible relation       tion, area-average intensity, peak intensity and average num-
to ZAMG stations’ distance. This is supported by a compar-           ber of wet cells, in both INCA and WegenerNet. Note that
ison of the INCA, ZAMG station, and WegenerNet data at               the accumulated precipitation is the total amount of area-
the Feldbach station location (hereafter Feldbach cell). For         average precipitation during an event (mm), area-average in-
WegenerNet values, we used the average of the four closest           tensity is the total precipitation divided by the duration of an
stations to the Feldbach cell (station numbers: 45, 46, 60,          event (mm h−1 ), peak intensity is the maximum intensity at a
and 61), since there is no WegenerNet station located in this        pixel during an event (mm per 15 min), and the average num-
cell. As mentioned in Sect. 2.1, most of the precipitation oc-       ber of wet cells is the average number of cells that have more
curs from May until September (hereafter wet season) due to          than 0.1 mm per 15 min of precipitation during an event.

https://doi.org/10.5194/hess-25-4335-2021                                         Hydrol. Earth Syst. Sci., 25, 4335–4356, 2021
4340 E. Ghaemi et al.: Evaluation of INCA precipitation analysis using a dense rain-gauge network
Figure 2. A convective event on 18 May 2009 that was observed by WegenerNet in original 200 m resolution (top) and 1 km resolution
(center) and by INCA (bottom).
To study extreme convective short-duration events (ECS- 3.4 The effect of topography
DEs) based on the events in the previous paragraph, we de-
fine an ECSDE as having three characteristics: (1) the area-
average intensity is more than the 95th quantile of Wegener- To check the topography effect, we try two approaches. First,
Net intensities, (2) the duration is less than 4 h, and (3) a cov- we check whether there is a meaningful relationship be-
erage of less than 2/3 of the study area. We evaluate INCA’s tween altitude and precipitation using WegenerNet station
performance in these events with a focus on the spatial char- data. The highest and lowest stations’ altitudes are 257 and
acteristics of four ECSDEs in both datasets along with the 520 m, respectively. The median is 327 m, and only two sta-
area-mean and peak intensities. tions are located above 400 m (Fuchsberger et al., 2021b).
Figure B2 shows the annual precipitation for each station
3.3 Comparison metrics and its corresponding altitude. Note that the annual precipita-
tion is calculated using the average of annual data from 2007
Error metrics have been widely used in many different disci-
to 2018 for each station. As can be seen, there is no notice-
plines, such as hydrology and hydrometeorology, to quan-
able trend regarding the effect of topography. It is worth men-
tify model result accuracies or compare observations and
tioning that the stations with annual precipitation lower than
forecasts. Each metric has its own strengths and weaknesses
750 mm yr−1 are stations 44, 151, and 145. As discussed in
and quantifies a different aspect of the model performance.
Sect. 3.1, these stations tend to systematically underestimate
Hence, using multiple metrics for the comparison is more
precipitation.
desirable (Jackson et al., 2019). We use four common met-
In another approach we choose a non-convective event
rics, bias, relative difference (RD), root mean square er-
in both INCA and WegenerNet datasets and check whether
ror (RMSE), and correlation coefficient (CC), for compar-
there is a relationship between altitude and the difference
ing INCA precipitation estimates with WegenerNet. These
between these two datasets. Based on the individual events
indices are computed according to Eqs. (1) to (4) in Table 1
(Sect. 3.2), we select an event where more than 300 cells
below.
are wet cells (on average) and the duration of the event is
Additionally, in order to evaluate INCA’s ability to detect
more than 4 h. Based on these criteria, we select an event
precipitation, we analyzed three categorical indices, POD,
on 11 October 2015. Then, we choose the highest altitude
FAR, and CSI, based on the equations in Table 2 below.
point (x = 11, y = 4) and the lowest point in the Raab Valley
(x = 21, y = 9) in the gridded data. After that, we calculate
the difference between INCA and WegenerNet for both of
these points. In addition, we consider the spatial average of
differences between INCA and WegenerNet. Similarly to the
Hydrol. Earth Syst. Sci., 25, 4335–4356, 2021 https://doi.org/10.5194/hess-25-4335-2021E. Ghaemi et al.: Evaluation of INCA precipitation analysis using a dense rain-gauge network 4341
Table 1. Comparison indices used in this study and their equations (partly adopted from Jackson et al., 2019).
Number Name Equation Range Notes
N
Bias = N1
P
(1) Bias RRi − WRi −∞ to +∞ Closer to 0 indicates
i=1
better performance
N
P
(RRi −WRi )
i=1
(2) Relative RD = N
× 100 −∞ to +∞ Closer to 0 indicates
P
WRi
i=1
difference better performance
s
N
P (RRi −WRi )2
(3) Root mean RMSE = N 0 to +∞ Closer to 0 indicates
i=1
square error better performance
N
P
RRi −RR WRi −WR
i=1
(4) Correlation CC = s s −1 to +1 Closer to 1 indicates
N
P 2 PN 2
RRi −RR WRi −WR
i=0 i=0
coefficient better performance
RR and WR indicate the precipitation estimates by INCA and by WegenerNet, respectively; i is the index of the time step, N is the number
of time steps and the top bar shows the average over time.
Table 2. Detection indices used in this study and their equations.
Number Name Equation Range Note
(5) POD a
POD = a+c 0 to 1 1 indicates the best performance
of precipitation detection
(6) FAR b
FAR = a+b 0 to 1 0 indicates the best performance
of precipitation detection
(7) CSI a
CSI = a+b+c 0 to 1 1 indicates the best performance
of precipitation detection, a
combination of POD and FAR
a is the number of events that both datasets could capture, b is the number of false events detected by
INCA, and c is the number of missed events.
first approach, no trend was found due to the topography of wettest year since 1937. From 2012 to 2014, the overestima-
the study area, which can affect our analysis (not shown). tion by INCA is even larger, with an average relative differ-
ence of 24.5 %. It is worth noting here that the difference be-
tween the average precipitation of WegenerNet stations and
4 Results and discussion the area-mean gridded data is negligible (0.15 % on average).
Annual precipitation in the Feldbach cell is shown in
4.1 Annual precipitation Fig. 3b. Similarly to the annual area-mean value, INCA
also overestimates precipitation in this cell but to a smaller
The area mean of annual precipitation in INCA and We- amount, with an average relative difference of 3 %. In this
generNet datasets and the average of WegenerNet stations cell, from 2007 until 2014, INCA overestimated precipita-
are shown in Fig. 3a. The annual average of precipitation tion with an average of about 5 % and a maximum of 13 %
in the 12 years from 2007 to 2018 is 979 mm in INCA and in 2012. Starting from 2015, INCA tends to underestimate
881 mm in WegenerNet. Overall, INCA area-mean values ex- precipitation by an average of 1.3 % and a maximum of 2.8 %
ceed WegenerNet values, with an average relative difference in 2016. Compared to the annual-mean values, INCA per-
of 11 %. The only year that INCA underestimates precipita- forms better in this cell, indicating the importance of the
tion is 2009, a year with particularly high precipitation: at rescaling step (step 3 in Sect. 2.2) in the INCA estimates.
the long-term ZAMG station Bad Gleichenberg, it was the
https://doi.org/10.5194/hess-25-4335-2021 Hydrol. Earth Syst. Sci., 25, 4335–4356, 20214342 E. Ghaemi et al.: Evaluation of INCA precipitation analysis using a dense rain-gauge network Figure 3. (a) Annual area-mean precipitation. (b) Annual precipitation for ZAMG Station 11298 (Feldbach) and its corresponding cell. Figure 4. Annual relative difference between INCA and WegenerNet in each pixel. The black dots indicate the two ZAMG stations in the study area. Also, INCA values are consistently higher than those of the there was a replacement period of the Austrian radars (start- ZAMG station Feldbach, with an average of 7 %. As shown ing in October 2011, details in Table B1) and since the clos- in Fig. 3b, INCA has considerably higher values than the est radar (Zirbitzkogel) was off during two periods of time Feldbach station in 2012 and 2013, with a relative difference (June 2012–October 2012 and February 2013–March 2013), of 21 % and 17 %, respectively. It is worth mentioning that we interpret this overestimation as an error of the radar data. the Feldbach station has lower values than WegenerNet ex- This error was partly removed close to the ZAMG stations cept for 2007, 2009, and 2010. Based on these results, we by step 4 of the INCA data preparation (see Sect. 2.2). can conclude that using the merged radar-gauge data leads to As shown in Fig. 4, the INCA performance can be di- more accurate estimates than individual ZAMG station data, vided into three different periods: 2007–2011, 2012–2014, even at the ZAMG station location. Furthermore, and simi- and 2015–2018. From 2007 to 2011, INCA generally overes- larly to Fig. 3b, we show the annual precipitation in the cell timated precipitation, except for 2009. In general, the annual where station Bad Gleichenberg is located (Fig. B3). Com- area-mean differences differ between −3.9 % and +4.3 %, pared to station Feldbach, the difference between INCA and with an average of 1.9 % in this period. In addition, there WegenerNet is higher, which could be due to the weight of was no specific pattern close to the two ZAMG stations since this station in step 1 (see Sect. 2.2). these stations were added to the INCA algorithm in Septem- Figure 4 shows annual maps of the relative differences be- ber 2011. Although the relative differences of area-mean val- tween INCA and WegenerNet. Similarly to Fig. 3, there is a ues are positive in this period except 2009, INCA underesti- considerable overestimation in INCA from 2012 to 2014, es- mates precipitation in some cells. pecially in the cells that are far from ZAMG stations. Since Hydrol. Earth Syst. Sci., 25, 4335–4356, 2021 https://doi.org/10.5194/hess-25-4335-2021
E. Ghaemi et al.: Evaluation of INCA precipitation analysis using a dense rain-gauge network                                4343

   From 2012 to 2014, INCA considerably overestimated
precipitation in almost all grid cells, and the annual area-
mean difference rose to almost 29 % in 2013. As shown, rel-
ative differences are lower at the cells closer to ZAMG sta-
tions, especially around the Feldbach station. We interpret
this increase in overestimation as an error, introduced by the
new radar, which was partly removed by the calibration with
ZAMG station data.
   From 2015 to the end of 2018, the overestimation by
INCA was still predominant. The overestimation, however,
is smaller compared to the previous period. Nevertheless,
annual-mean differences are almost always positive, with
typical values between +11 % and +15 % and an average of
+12.5 %. This overestimation is smaller in the grid cells near
the two ZAMG stations, indicating again the role of these sta-
tions in adjusting radar data in the INCA algorithm.
   Note that we also calculate RMSE for the annual precip-
itation (see Fig. B4). There is no noticeable spatial pattern
in the first period, and the minimum and maximum of area-
mean annual RMSE are 45.0 and 57.5 mm, respectively. This          Figure 5. POD and FAR values based on different thresholds for
error is considerably higher in the second period, with a min-     each cell for 2007–2011 (a), 2012–2014 (b), and 2015–2018 (c).
imum and maximum of 191.0 and 278.0 mm, respectively.              Note that the dashed black and black lines indicate POD and FAR
In this period, RMSE is lower close to the Feldbach station        for the Feldbach cell, respectively.
(just like the relative difference in Fig. 4). Similarly to the
relative difference, the area-mean annual RMSE decreases in
the 2015–2018 period. For this period, the minimum RMSE               Figure 6 shows POD and FAR for each grid cell based on
is 92.6 mm in 2015 and the maximum RMSE is 124.1 mm                the 0.1 mm per 15 min threshold for the three periods, sep-
in 2018.                                                           arated into wet and dry seasons. The FAR performs better
   As mentioned before, more stations were added to the            in the grid cells near the two ZAMG stations. POD, however,
INCA algorithm during the years. To study possible changes         has lower values in those cells. As previously mentioned, this
in INCA estimates after adding these stations, the raw radar       may be due to the INCA algorithm, which unintentionally
data used in INCA should be included in future analyses.           removes some light events. The ability of INCA in detecting
                                                                   precipitation is noticeably higher in wet seasons.
                                                                      We also calculated CSI for each cell (Fig. B5). Since
4.2   Precipitation detection
                                                                   CSI is a combination of POD and FAR, its behavior is a
                                                                   combination of POD and FAR; i.e., CSI performs better
Figure 5 shows POD and FAR values for different thresholds         during the wet season. CSI values are higher in the third
for each cell for the three different time periods identified      period (2015–2018) for the dry seasons. Since the weight
above. The dashed black and solid black lines indicate POD         of the radar estimate becomes higher with increasing dis-
and FAR for the Feldbach cell. As can be seen, INCA’s abil-        tance from the ZAMG stations in the INCA algorithm (see
ity to detect precipitation decreases at higher intensities. The   Sect. 2.2), we conclude that the radar detected some precip-
change in POD and FAR in the Feldbach cell is different. At        itation events, which were not observed by ground stations.
thresholds lower than 0.5 mm per 15 min, it has lower POD          Since the radar sees precipitation in the study area only be-
than other cells, especially since 2012. The FAR value per-        yond about 2000 m above the ground and some errors are not
forms better compared to other cells at lower thresholds. This     corrected (see Sect. 2.2), “false events” can be due to events
could be due to the INCA algorithm for removing false pre-         that do not reach the ground due to evaporation or due to non-
cipitation events, which unintentionally removes some light        precipitating phenomena. The latter error can explain higher
precipitation events.                                              FAR values in the cells with longer distances from ZAMG
   Generally, INCA has the highest POD values at a threshold       stations.
of 0.1 mm per 15 min. With increasing precipitation inten-
sity, POD tends to decrease. The FAR values also have the          4.3   Seasonal comparison
best performance at 0.1 mm per 15 min and start to increase
with higher intensities. When longer time intervals (e.g., 1,      Figure 7 displays the mean relative differences between
3, and 6 h) are considered, the detection errors decrease (not     INCA and WegenerNet in the wet (May–September) and
shown).                                                            dry (October–April) seasons for the three periods. In con-

https://doi.org/10.5194/hess-25-4335-2021                                       Hydrol. Earth Syst. Sci., 25, 4335–4356, 2021
4344 E. Ghaemi et al.: Evaluation of INCA precipitation analysis using a dense rain-gauge network
Figure 6. POD and FAR for 15 min data based on the 0.1 mm threshold for three different periods of time for wet (a) and dry (b) seasons.
The black dots indicate the two ZAMG stations.
rithm works reasonably well closer to the two ZAMG sta-
tions. However, the overestimation farther away from those
stations is still considerably large. The higher relative dif-
ference in wet seasons is an indication of difficulties in the
radar network to estimate intense rainfall events. Consider-
ing RMSE, the pattern is similar to the relative difference
(not shown).
Furthermore, we calculate the temporal correlation coef-
ficient between INCA and WegenerNet (Fig. B6). Based on
these results, the correlation is noticeably lower in the wet
seasons. We interpret this as a consequence of a higher per-
centage of convective events, which are harder to capture.
Similarly to the relative difference, INCA performs better in
the cells close to the ZAMG stations in the wet seasons.
4.4 Extreme precipitation
Figure 7. Mean relative difference between INCA and WegenerNet In this section, we compare extreme events in INCA and We-
for 2007–2011 (left), 2012–2014 (center) and 2015–2018 (right) in generNet based on the different seasons for the three periods.
dry (a) and wet (b) seasons. Note that only events equal to or more Note that the 99th quantile was calculated for time steps with
than 0.1 mm per 15 min were considered. precipitation equal to or more than 0.1 mm per 15 min, which
happened in both datasets (see Sect. 3.2). Figure 8 shows the
mean values of all time steps exceeding the 99th quantile in
trast to the relative differences in Fig. 4, these differences each pixel for both datasets and the relative differences in wet
were calculated for events with precipitation of equal to or and dry seasons.
more than 0.1 mm per 15 min that happened in both datasets. From 2007 to 2011, INCA tends to overestimate extreme
The 0.1 mm threshold is implemented due to the resolution precipitation in cells close to the two ZAMG stations and
of the tipping bucket gauges used in WegenerNet. In the first underestimated it in the other parts of the study area, simi-
period, both overestimation and underestimation can be de- larly to the mean seasonal values (see Fig. 7). Compared to
tected in INCA grid cells. Starting in 2012, overestimation is the mean seasonal values, underestimation is larger in ex-
dominant in most INCA grid cells, similarly to annual pre- treme precipitation, especially in the dry season. The maxi-
cipitation. This overestimation is higher in the wet seasons mum and minimum differences in this period are 26 % and
and grid cells farther away from the two ZAMG stations. −45 %, respectively. It is worth mentioning that the spatio-
We can conclude that the new radar settings (cf. Sect. 2.2) temporal evolution of extremes is not particularly well cap-
tend to overestimate precipitation and that the INCA algo- tured by INCA (cf. Fig. 2).
Hydrol. Earth Syst. Sci., 25, 4335–4356, 2021 https://doi.org/10.5194/hess-25-4335-2021E. Ghaemi et al.: Evaluation of INCA precipitation analysis using a dense rain-gauge network 4345
Figure 8. Spatial patterns and relative difference of the mean of all time steps exceeding the 99th quantile for INCA and WegenerNet for
(a) wet and (b) dry seasons in the first (left), second (middle), and third (right) periods.
Between 2012 and 2014, an overestimation of INCA in
the corresponding cells of ZAMG stations is also notice-
able, particularly in the wet season. In contrast to annual and
mean-seasonal values, there is no relationship between dis-
tance from ZAMG stations and the relative difference. In the
dry season, INCA shows less underestimation than in the first
period. The maximum and minimum differences in this pe-
riod are 101 % and −36 %, respectively. For wet seasons in
the 2015–2018 period, the behavior was relatively similar to Figure 9. Number of events in different seasons in both datasets.
the second period, with a decrease in overestimation. In this
period, the maximum and minimum differences are 44 % and
−29 %, respectively. Based on these results, the overestima-
tion of INCA is larger in extremes, especially in the wet sea- tion and precipitation rate are based on the area-mean value
sons. in each time step. The peak intensity, however, is the maxi-
mum value that happened in one cell during an event.
4.5 Event-based evaluation Based on Table 3, the average accumulated precipitation
and the precipitation rate measured by INCA are higher than
In this section, we consider individual events, and based on WegenerNet. Similarly, the average number of wet cells is
the criteria we described in Sect. 3.2, we identified 4699 sep- higher in INCA, which can affect the accumulated precipita-
arate events in INCA and 5116 in WegenerNet over 12 years. tion. The difference between the average number of wet cells
The number of events in different seasons is shown in Fig. 9. in INCA and WegenerNet is higher in the dry season. This
Similarly to Sect. 4.2, the number of detected events in INCA could be due to a slightly lower effective resolution of INCA
is lower in the dry seasons. Note that the number of dry- in the study area, where the radar beam of the nearest radar
season events can be slightly biased in WegenerNet, due to is already comparatively wide. While the average duration of
snowfall events, which can get recorded twice: once when events only differs by 3 min, the difference increases signifi-
the snow is measured by heated rain gauges and again when cantly for longer events.
the snow melts at the unheated gauges. In general, snow- To check a possible time shift in INCA, we consider events
fall events in the region are rare (cf. Sect. 2.1); thus, we do that fulfill the following conditions: (1) the absolute differ-
not expect them to have significant influence in metrics other ence between the starting time of an event in INCA and We-
than the number of events. Another effect on the number of generNet is less than 1 h and (2) the absolute difference be-
dry season events is that the radars tend to miss precipita- tween the ending time of an event in INCA and WegenerNet
tion more often in winter due to beam blockage by surround- is less than 1 h. Based on these criteria, INCA started earlier
ing mountains (cf. Sect. 2.2), especially for low-lying clouds, to detect precipitation in 34 % of these events with an average
which are often present in the dry season. of 25 min. Both datasets started at the same time for 35 % of
Table 3 describes the statistics of separate events in both the events, and for the rest (31 %), INCA started later by an
INCA and WegenerNet. Note that the accumulated precipita- average of 23 min. For the ending of an event, 54 % of events
https://doi.org/10.5194/hess-25-4335-2021 Hydrol. Earth Syst. Sci., 25, 4335–4356, 20214346 E. Ghaemi et al.: Evaluation of INCA precipitation analysis using a dense rain-gauge network
Table 3. Descriptive statistics for separate events in INCA and WegenerNet based on the 1 h interval (based on definitions in Sect. 3.2).
Accumulated Area-average Average number of Peak intensity
Duration (min) precipitation (mm) intensity (mm h−1 ) wet cells (mm 15 min−1 )
INCA WegN INCA WegN INCA WegN INCA WegN INCA WegN
Mean 172 175 2.28 1.90 0.37 0.25 63 41 1.67 1.54
25 % 15 15 0.006 0.001 0.01 0.002 8 2 0.16 0.13
50 % (median) 75 60 0.07 0.01 0.06 0.01 28 8 0.34 0.23
99 % 1305 1665 32.13 29.18 3.76 2.7 288 241 20.99 18.30
Max 2460 4065 101.63 105.86 13.31 9.30 330 313 46.17 35.04
Figure 10. Monthly mean of the peak (mm per 15 min) for each event for WegenerNet and INCA.
end later in INCA by an average of 24 min, and 20 % end ear- 4.5.1 Extreme convective short-duration events
lier by an average of 26 min. Note that starting/ending time
is considered within 15 min since the temporal resolution is Based on these events and the criteria described in Sect. 3,
15 min. there are 62 ECSDEs detected by WegenerNet during the 12-
To separate the errors associated with time shift from er- year study period. Among these 62 events, 47 are detected by
rors related to intensity, we focus only on those events that INCA. The same underestimation pattern before 2012 and
happened at the same time in both datasets, and we found overestimation afterward (see Fig. 10) can be seen in accu-
2949 events. Similar to the results in Table 3, the accumu- mulated precipitation and peak intensity. The highest under-
lated precipitation is higher in INCA, and the bias value is estimation of accumulated precipitation happened in 2009
0.14 mm 15 min−1 . Although INCA overestimates accumu- (up to 40 %). For the peak intensity, INCA underestimates
lated precipitation most of the time, the peak intensity is it by up to 60 % in 2008 and overestimates it by approxi-
slightly higher in WegenerNet except during July. The over- mately 65 % in 2015. The results are similar to the extremes
all bias for peak intensity is −0.04 mm 15 min−1 . in Sect. 4.4.
We also studied the time of the peak intensity in both To check the ECSDE’s spatial patterns in both datasets,
datasets and found that the peak happens during the first half we focus on four examples of these events. As shown in
of the event duration. Also, in the majority of events, the Fig. 3a and discussed in Sect. 4.1, the precipitation amount
peak intensity in INCA happens slightly later (approximately was considerably higher in 2009. We choose the first ECSDE
5 min) than in WegenerNet. from this year, which has the highest peak intensity in 2009.
The monthly average of the peak intensity is shown in The second event in 2011 is special because INCA over-
Fig. 10. INCA generally underestimates the precipitation estimated accumulated precipitation but underestimated the
peaks in the first period but generally overestimates them peak intensity. The third and fourth events are selected from
from mid-2012 onwards. This behavior is likely due to the the third period (2015–2018) with different characteristics to
change in the radar network in 2012. There is a noticeable show INCA’s performance based on the latest improvements.
peak-intensity overestimation in mid-2013. In contrast to the The third event has the highest maximum intensity in INCA,
mean precipitation (see Figs. 3a and 4), the differences in and the fourth event’s peak intensity is highest in this pe-
peak intensity between INCA and WegenerNet decreased riod (2015–2018).
significantly in 2018.
Hydrol. Earth Syst. Sci., 25, 4335–4356, 2021 https://doi.org/10.5194/hess-25-4335-2021E. Ghaemi et al.: Evaluation of INCA precipitation analysis using a dense rain-gauge network 4347
Figure 11. Time series of area-mean and maximum values in INCA and WegenerNet for the event on 18 May 2009.
Figure 12. An event on 1 September 2011 in WegenerNet (top) and INCA (center) and time series of area-mean and maximum values in
INCA and WegenerNet (bottom).
Event on 18 May 2009 addition, rainfall starts and ends earlier in INCA, and INCA
has more wet cells during this event.
In Fig. 2, we already showed the difference in the spatial
structure of this extreme event on 18 May 2009, in both Event on 1 September 2011
INCA and WegenerNet. Based on WegenerNet data, the ac-
cumulated rainfall over the entire study area was 23.7 mm in During this event, an areal average of 27.6 mm fell in 3.25 h
2 h, but the accumulated rainfall that happened in the wettest (50 mm in the wettest cell). There is a time shift in the peak
cell was 46.6 mm. As shown in Fig. 11, WegenerNet detected intensity and area-average rainfall. In contrast to the event
two peaks for this event at 20:45 and 21:15 CET (central Eu- in 2009, the peak intensity happened one time step earlier in
ropean time). In INCA, however, the two peaks happened at INCA. The differences between INCA and WegenerNet val-
21:00 and 22:00 CET. It is worth mentioning that the location ues are smaller than in the previous event. As can be seen
of the peak(s) is also different in INCA (see Fig. 2). The area in Fig. 12, INCA starts to detect earlier and finishes later
mean of rainfall shows a time shift in INCA of 30 min. In than WegenerNet, and INCA has more wet cells. Compar-
https://doi.org/10.5194/hess-25-4335-2021 Hydrol. Earth Syst. Sci., 25, 4335–4356, 20214348 E. Ghaemi et al.: Evaluation of INCA precipitation analysis using a dense rain-gauge network
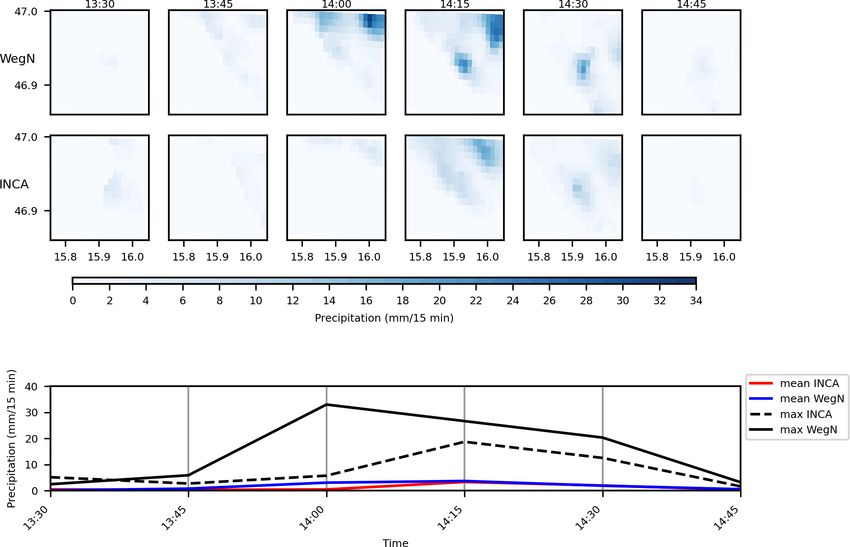
Figure 13. An event on 16 August 2016 in WegenerNet (top) and INCA (center) and time series of maximum and area-mean values in INCA
and WegenerNet (bottom).
ing these results with those by Kann et al. (2015), we see location of the maximum value is far from the two ZAMG
that the 15 min INCA precipitation analysis performs better stations. This event starts and ends earlier in INCA with a
than 5 min rapid-INCA. The time shift in detection was also higher number of wet cells.
observed in rapid-INCA, caused by radar data. INCA detects the peak intensity later than WegenerNet,
except for the event on 1 September 2011. INCA underes-
Event on 16 August 2016 timates the peak intensity in two events (2009 and 2018)
and overestimates this value in the 2016 event. The overes-
Based on WegenerNet data, the areal average of the to- timation and underestimation are more pronounced for peak
tal amount of rainfall was 19.4 mm, which fell in 2.25 h intensities than for area-mean values. These error and time
(36.5 mm in the wettest cell). INCA overestimated the event shifts in detection may affect the performance of flood warn-
peak by about 40 % in this event. Similarly to the event ing systems.
in 2009, there is a time lag in INCA’s detection of the rain- Compared to the rapid-INCA product (Kann et al., 2015),
fall peak (Fig. 13). The highest value of the area-mean rain- the INCA analysis product performs similarly in 2011, i.e.,
fall happened at 21:30 CET in both datasets. This event starts underestimates precipitation in most cells in the wet season.
earlier and finishes later in INCA, with more wet cells in We- The IMERG products (O et al., 2017) underestimate heavy
generNet. precipitation during 2014–2015 in the study area. One should
note that this comparison may not be entirely reliable since
Event on 15 July 2018 the temporal and spatial resolutions of IMERG products are
coarser than INCA analysis products. In general, the INCA
The areal average of accumulated rain was just 10.8 mm that analysis product can be used for different hydrological pur-
fell in 2.5 h. However, the accumulated rain in the wettest poses, considering it is a real-time operational product with
cell was 59.6 mm in this event. INCA detected the peak in- high temporal and spatial resolution. Also, the results show
tensity one time step later and had lower values than Wegen- that improvements in the INCA analysis product are taking
erNet. The maximum value of rainfall in this event happened place. It should be noted that INCA precipitation products
at 14:00 CET in WegenerNet, and INCA significantly under- have a high spatial and temporal resolution, and some errors
estimates this value (Fig. 14). It is worth mentioning that the
Hydrol. Earth Syst. Sci., 25, 4335–4356, 2021 https://doi.org/10.5194/hess-25-4335-2021E. Ghaemi et al.: Evaluation of INCA precipitation analysis using a dense rain-gauge network 4349
Figure 14. An event on 15 July 2018 in WegenerNet (top) and INCA (center) and time series of maximum and areal mean values in INCA
and WegenerNet (bottom).
such as wind drift become more pronounced in higher reso- the area-mean values. In general, INCA overestimates the
lutions. Also, the height that radars can detect precipitation area-mean annual precipitation except in 2009, which was
increases with the range from the radar site, which can signif- a particularly wet year. The performance of INCA can be di-
icantly impact the accuracy of the radar estimates (Harrison vided into three different periods: from 2007 to 2011, both
et al., 2009). Since the closest radar sees precipitation only overestimation and underestimation are observed in INCA,
above 2000 m from the ground, this can be the main source with more pronounced underestimation in the wet season.
of uncertainty in detection and estimation of precipitation in Starting in 2012, INCA considerably overestimates precip-
the INCA analysis products over the study area. Addition- itation by up to 60 %. However, this overestimation is less
ally, there are some sources of uncertainties in the Wegen- pronounced close to the Feldbach station. Since the weight
erNet products, such as unheated sensors, wind effects, and of the gauge estimation decreases with increasing distance
the interpolation of data that may have negative effects on the from the gauge, we concluded that this increase in the overes-
quality of the WegenerNet gridded dataset. timation is a result of systematic errors from newly installed
radars and can be partly removed closer to the gauges. Start-
ing in 2015, this spatial pattern continues but with a lower
5 Conclusions overestimation compared to the second period.
We used categorical metrics to study the ability of INCA in
The evaluation of precipitation estimates helps to improve detecting precipitation. Generally, the number of false events
the understanding of errors and uncertainties from different is smaller in the cells closer to ground stations operated by
sources (e.g., systematic errors, random errors, and spatio- the ZAMG (which are used as input for INCA), especially
temporal dependency). In this study, we evaluated INCA (In- in the wet season. Surprisingly, the number of true events
tegrated Nowcasting through Comprehensive Analysis) pre- close to the ZAMG stations is comparably smaller too. This
cipitation analysis products of the ZAMG (the Austrian Cen- could be because the INCA algorithm removes false precipi-
tral Institute for Meteorology and Geodynamics), using We- tation events and unintentionally removes some light precip-
generNet high-resolution gridded data from 2007 to 2018 in itation events. We evaluated extremes during these three pe-
southeastern Austria. First, we compared annual precipita- riods and for wet and dry seasons. In the first period, INCA
tion estimates of INCA and WegenerNet for each pixel and
https://doi.org/10.5194/hess-25-4335-2021 Hydrol. Earth Syst. Sci., 25, 4335–4356, 2021You can also read