The Hearpiece database of individual transfer functions of an in-the-ear earpiece for hearing device research - Acta Acustica
←
→
Page content transcription
If your browser does not render page correctly, please read the page content below
Acta Acustica 2021, 5, 2
Ó F. Denk & B. Kollmeier, Published by EDP Sciences, 2020
https://doi.org/10.1051/aacus/2020028

                                                                                                                        Available online at:
                                                                                                         https://acta-acustica.edpsciences.org

    TECHNICAL & APPLIED ARTICLE

The Hearpiece database of individual transfer functions of an in-the-ear
earpiece for hearing device research
Florian Denk1,2,* and Birger Kollmeier1
1
    Medizinische Physik & Cluster of Excellence Hearing4All, Universität Oldenburg, 26111 Oldenburg, Germany
2
    Now at: German Institute of Hearing Aids, 23562 Lübeck, Germany

             Received 15 April 2020, Accepted 23 November 2020

             Abstract – We present a database of acoustic transfer functions of the Hearpiece, a commercially available
             multi-microphone multi-driver in-the-ear earpiece for hearing device research. The database includes HRTFs
             for 87 incidence directions as well as responses of the drivers, all measured at the four microphones of the Hear-
             piece as well as the eardrum in the occluded and open ear. The transfer functions were measured in both ears of
             25 human participants and a KEMAR with anthropometric pinnae for five insertions of the device. We describe
             the measurements of the database and analyse derived acoustic parameters of the device. All regarded transfer
             functions are subject to differences between participants and insertions. Also, the KEMAR measurements are
             close to the median of human data in the present results for all assessed transfer functions. The database is a
             rich basis for development, evaluation and robustness analysis of multiple hearing device algorithms and appli-
             cations. It is openly available at https://doi.org/10.5281/zenodo.3733190.

             Keywords: HRTF, Feedback Paths, Hearing Aid, Hearables, Individualization

1 Introduction                                                                  Several other transfer functions related to hearing
                                                                            devices are crucial for their real-ear performance. However,
    Development and evaluation of hearing devices like                      they seem to be rarely addressed in the current literature,
hearing aids or hearables and appropriate algorithms is                     and the authors are not aware of public datasets of hearing
greatly facilitated by utilizing simulations. It is well under-             device HRTFs that also include the driver responses, feed-
stood that realistic simulations are required to obtain                     back paths, or transfer functions to the occluded eardrum.
results that reflect the real behaviour of hearing devices in                For instance, the responses of the driver(s) at the eardrum
the ear of a user [1, 2]. To simulate input signals of hearing              determine the sound that is perceived by the user, and
devices, signals can be convolved with appropriate Head-                    recently several researchers tackled the problem of individ-
related Transfer Functions (HRTF) that describe the                         ualized equalization of the presented sound [10–12]. Also,
acoustic free-field transmission to the hearing device micro-                the feedback paths, i.e., the response of the driver at the
phone from a certain incidence direction. Several research-                 device’s microphones, is a factor that may greatly affect
ers have presented measurements of hearing device                           the performance of hearing devices especially if gain is to
HRTFs [2–5], and it has been shown that there are signifi-                   be provided [13]. Furthermore, many devices feature a
cant differences in the HRTFs between hearing device styles                 loose, vented or completely open fit, allowing significant
and microphone positions, as well as differences and percep-                sound energy from external sound sources to enter the ear
tual consequences with respect to HRTF measured in the                      canal directly without being processed by the device.
unobstructed ear [6–8]. Also, the differences between indi-                 Usually, the tightness of fit also interacts with the driver
viduals and the implications for designing signal processing                responses and feedback paths [14, 15].
algorithms has been recognized [3, 9]. One limitation of                        We present a database of all linear transfer functions of
existing hearing device HRTF datasets is that while they                    the Hearpiece, an in-the-ear earpiece with wired transducers
can be utilized well to study the theoretical performance                   for hearing device research introduced in 2019 that is com-
of algorithms, most authors used custom devices that are                    mercially available [16]. The database contains the HRTFs
not available to other researchers. This means that others                  from 87 directions to the four microphones of the Hearpiece
would have to build their own devices given the (often                      as well as the eardrum, both in the open ear and the ear
sparse) documentation in order to transfer their develop-                   occluded by the passive device. In addition, it contains
ments to real-time devices that are usable in the field.                     the responses of the two drivers at the eardrum as well as
                                                                            at the microphones integrated in the device (i.e., feedback
*Corresponding author: florian.denk@uni-oldenburg.de                         paths). The transfer functions were measured in both ears
This is an Open Access article distributed under the terms of the Creative Commons Attribution License (https://creativecommons.org/licenses/by/4.0),
              which permits unrestricted use, distribution, and reproduction in any medium, provided the original work is properly cited.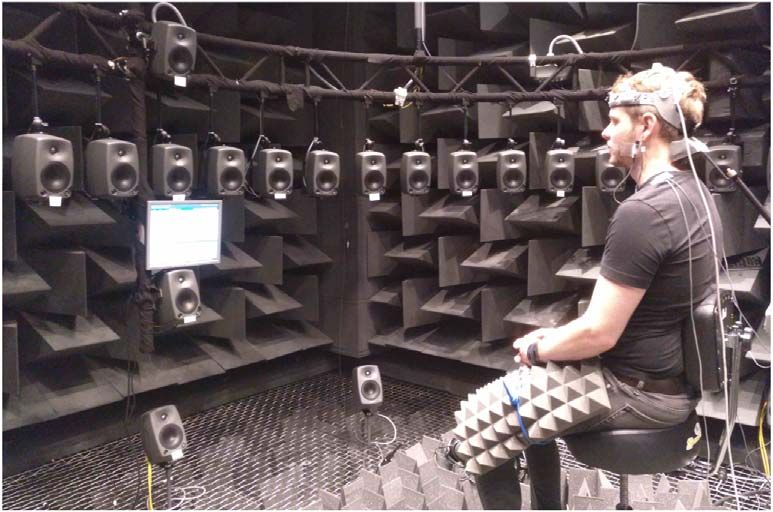
2                                      F. Denk, B. Kollmeier: Acta Acustica 2021, 5, 2

of 25 adult participants and a KEMAR with anthropomet-
ric pinnae (G.R.A.S. 45BB-12 [17]) for each of five inser-
tions and variations of the sound field by placing a
telephone near the ear. Furthermore, the between-device
variation was assessed for 10 pairs of the Hearpiece that
were either vented or completely occluded the ear. The
database thus amounts to 169,878 HRTFs and 5740 driver
responses.
    This work includes a description of the conducted
measurements and the database, as well as an evaluation
of derived acoustic parameters of the Hearpiece. While
the general properties of the device were already analyzed
in [16], data analyses in this work mainly focus on A) the
differences between participants and devices from a series,
B) the variations of the transfer functions with reinsertions,
and C) to what degree measurements in KEMAR are
suitable to capture the acoustic properties of such an in-ear
hearing device in a median human ear. One special feature
of the Hearpiece is a microphone in the ear canal, which
allows the implementation of novel algorithms in the field
of individualized equalization, feedback cancellation, or
active noise/occlusion control [11, 18–20]. These approaches
require knowledge, estimation or modelling of the relative         Figure 1. Top: Photograph of the Hearpiece used for recording
transfer function from the In-Ear microphone to the ear-           the database. Bottom: Schematic transducer layout in the device
drum, which is in the following referred to as Residual            (grey), both drivers and two microphones couple into a vent
Ear Canal Transfer Function (RECTF). Since such relative           (blue area). Reproduced from [16].
transfer functions and their properties have only been
assessed very sparsely before [21], the RECTF is also given
special consideration here.                                        and many current hearables, and sits shallow in the cavum
    The database is made openly available. It can be broadly       concha. An optimized fit is achieved using exchangeable sil-
applied in research and development of in-the-ear type hear-       icone domes in four sizes, the size selected for each partici-
ing devices, which have gained popularity with the advent of       pant is given with the database.
hearables and other hearing devices targeted at (near-to)              Both drivers and two of the microphones are distributed
normal-hearing users in different applications [22]. For such      along the included vent with a cross-section of approx.
devices in general, the database allows researchers to develop     1.5 mm2 and a length of 19 mm, where the two microphones
and evaluate algorithms for applications like sound equaliza-      are positioned approx. 2.5 mm from the inner and outer ends
tion [11, 18], feedback cancellation [19, 23], active noise- and   (referred to as In-Ear and Outer Vent microphones, respec-
occlusion cancellation [20, 22, 24], electro-acoustic modelling    tively). The two drivers couple into the vent independently
[25, 26] and beamforming [27]. In particular, the database         with a relative distance of approx. 3.1 mm and are referred
allows a robustness evaluation of participant- and insertion       to as inner and outer driver. Two more microphones are
variability. Moreover, algorithm developments based on             located on the faceplate with a distance of 12.5 mm, one near
the database can be directly transferred to portable real-time     the position of the ear canal entrance (Entrance micro-
prototypes due to the joint availability and compatibility of      phone) and one in the rear part (Concha microphone).
this database, the Hearpiece [16], and portable signal pro-        The drivers are balanced armature drivers of two different
cessing platforms [28, 29].                                        types (inner: Knowles WBFK-30042, outer: FK-26768),
                                                                   while all microphones are MEMS microphones of the same
                                                                   type (Knowles SPH1642HT5H-1). The Hearpiece is avail-
2 Methods                                                          able as both a vented and a closed version, where the outer
2.1 Earpiece and measurements in the ear                           part of the vent is occluded and the Outer Vent microphone
                                                                   omitted. The main body of the data presented here regards
    A photograph of the Hearpiece and its schematic layout         the vented version; for differences of the closed version the
are shown in Figure 1, the detailed geometry is documented         reader is referred to [16]. The transducers were connected
in [16, 30]. The Hearpiece includes two Balanced-Armature          to the measurement system through a custom adaptor and
drivers and four microphones in each side that are con-            amplifier box1 without implementing any real-time
tained in an acrylic shell with a generic fit. Its outer shape      processing.
was derived from the earphone “ProPhile” by InEar, and fits         1
                                                                     Microphone amplifiers: Two-stage inverting amplifier based
into about 90% of human ears according to the manufac-             on OPA2134 Opamp, 20 dB gain, input impedance 47 kX.
turer [31] and own experience in approx. 100 users. The            Headphone amplifiers for drivers: One-stage inverting amplifier
shape is similar to individualized in-the-ear hearing aids         based on MAX4409 Opamp, 0 dB gain, output impedance
F. Denk, B. Kollmeier: Acta Acustica 2021, 5, 2 3
The custom transducer layout facilitates several tailored
applications like automatic individual equalization using
either one or both drivers [11, 18, 32] and feedback suppres-
sion using multiple microphones or drivers [19, 23] that
make use of electro-acoustic models individualized to the
user [25, 26]. Furthermore, the In-Ear microphone opens
up possibilities to implement active noise or occlusion
cancellation [20, 24] features.
In addition to the microphones integrated in the device,
measurements were also conducted at the eardrum. To this
end, an audiological probe tube connected to an Etymotics
ER7C microphone was inserted into the ear canal until the
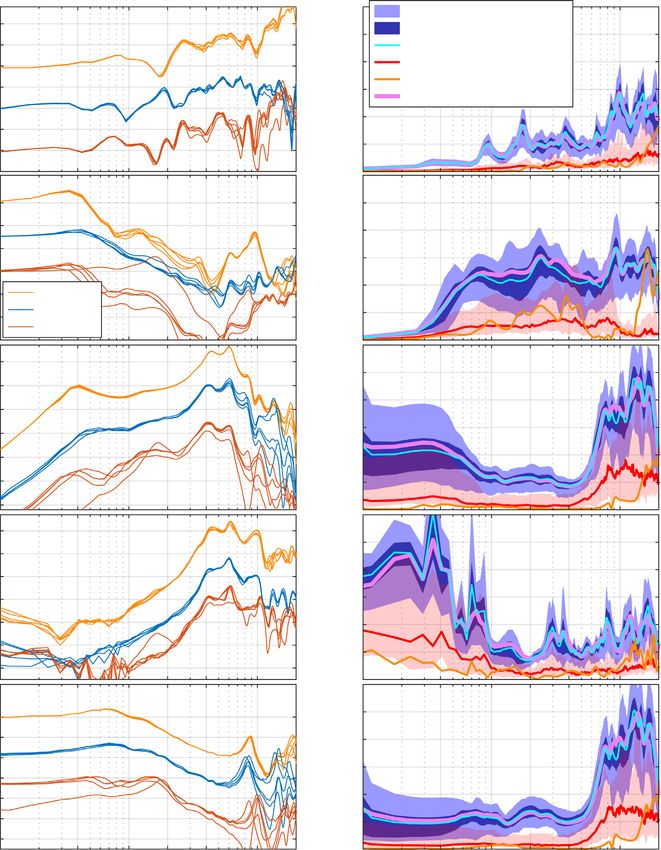
participant reported contact with the eardrum, and then Figure 2. Experimental setup with a participant.
pulled back by a minimal amount. The device was then
inserted on top of the probe tube. To minimize squeezing and the human participants except for the eardrum data,
and movement of the probe tube, it was placed at the lower where KEMAR’s ear simulators were utilized.
anterior corner of the ear canal entrance, led towards the
eardrum on the lower side of the ear canal and out of the 2.3 Apparatus and procedure
ear between tragus and anti-tragus. This positioning of
the probe tube resulted in measuring close to the innermost The measurements were conducted in the Virtual Real-
corner in the ear canal, since the eardrum is usually slanted ity Lab of Oldenburg University, which is an anechoic
with respect to the ear canal surface. This location is close chamber with 94 Genelec 8030 loudspeakers installed in a
to the umbo and the maximum pressure on the eardrum 3D layout. Forty-eight loudspeakers were spaced uniformly
[33], and was found to be most reproducible between partic- in the horizontal plane, leading to an azimuth resolution of
ipants with the practical constraints of the present measure- 7.5°. Further circles of loudspeakers were installed at ±30°
ment [34]. Insertion of the probe tube and the device was and ±60° elevation with a horizontal resolution of 30° and
executed by an experienced hearing aid acoustician. Upon 60°, respectively, as well as one loudspeaker each directly
reinsertions of the device (cf. Sect. 2.3), the probe tube above and below the center. Eight further loudspeakers
was kept in place as well as possible. were installed in the median sagittal plane to achieve a ver-
tical resolution of 15° in this plane above 30° elevation.
2.2 Individual participants and dummy head The seven incidence directions at elevations of 60°
could not be considered due to obstruction by a sitting
Twenty-seven adult participants (age 21–60, median platform, such that a total of 87 loudspeakers were used
age 28.5, 13 females, 14 males) took part in the measure- for the measurements. The loudspeakers were mounted at
ments. In two female participants, it was not possible to a distance of 2.5–3 m from the participant, and the spatial
insert the Hearpiece properly since their cavum conchae separation of woofer and tweeter (approx. 1.3°) can be
were too small, leaving 25 participants in the database. neglected. All active loudspeakers together produced a noise
Screening measurements and ear inspection assured that floor of 17.1 dBA at the array centre, which lies below the
the participants had clinically normal hearing (hearing self-noise of the utilized microphones (except KEMAR ear
threshold better than 20 dB HL for frequencies 8 kHz, simulators) and is thus negligible.
normal loudness perception), no audiological abnormalities Figure 2 shows a photograph of the setup with a partic-
and no large accumulations of cerumen in their ear canals. ipant during an experimental session. The participants were
No participant wore jewellery in their ears during the seated on a small metal grid platform covered by absorbers,
measurements. with their legs wrapped in absorbing material to minimize
The participants comprised one author, employees of reflections. To stabilize the head position during the course
the University of Oldenburg (Department of Medical of the experiment, a small headrest as well as a graphical
Physics and Acoustics) and RWTH Aachen University display to provide feedback on the head position as
(Institute of Technical Acoustics) as well as paid volunteers. described in our previous work [35] was provided. The
All participants signed a written informed consent, and the visual feedback utilizes head position data continuously
experiment was approved by the University of Oldenburg recorded using a headtracker (Pohlemus Patriot) mounted
Ethics council. Some relevant data of the participants on top of the participant’s head, and displays the correc-
(sex, age, ear canal lengths and silicone dome sizes) are sup- tions necessary to restore a reference head position and ori-
plied with the database. entation. The visual feedback was displayed on a screen
The measurements were also conducted in a GRAS mounted below the loudspeaker in front of the participants
KEMAR 45BB-12 dummy head with anthropometric pin- (see Fig. 2), which they monitored during the measure-
nae and low-noise ear simulators [17]. The anthropometric ments for guidance to (re-) adjust their head to the refer-
pinnae facilitated realistic fitting of the in-ear device, which ence position. At the beginning of the experiment, the
was not possible with the standard pinnae. Measurements participants were positioned and oriented at the center of
and evaluation were conducted identically for KEMAR the loudspeaker array using crossed laser markers, and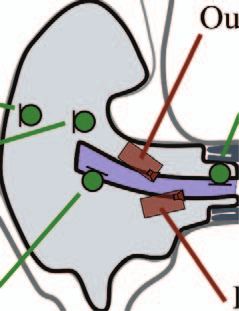
4                                    F. Denk, B. Kollmeier: Acta Acustica 2021, 5, 2

the reference head position was recorded. The head position      microphone G.R.A.S. 46DP-1, acoustic reflections removed
and orientation with respect to the reference position are       likewise) and microphone sensitivities by regularized spec-
supplied with the database.                                      tral division. That is, the spectral division was only applied
    The first step of the experimental procedure was to           in a frequency range where significant signal energy was
insert the probe tubes into the open ears, and the partici-      present (here 60 Hz to 21 kHz). Furthermore, a lower
pant was positioned and oriented in the center of the array.     boundary of 30 dB below the broadband average was
Second, the HRTF to the eardrum of the open ear was mea-         imposed on the divisor, which is the product of loudspeaker
sured (see Sect. 2.4). Third, the device was inserted and the    response and microphone sensitivity.
HRTF to all microphones of the device and the eardrum                For the microphones included in the device, one repre-
measured. The hearing aid acoustician inserted the device        sentative sensitivity that included the pre-amplifiers was
to minimize hazard to the participants by pushing the            utilized. To this end, the sensitivity of 6 identical micro-
probe tube closer to the eardrum and avoid squeezing of          phones was determined in free-field measurements, and
the probe tube. Fourth, the responses of the device’s drivers    the sensitivity of the microphone with a magnitude
were measured (see Sect. 2.5), once with nothing close to        response closest to the average was chosen.2 For each micro-
the ear and once while the participant held a telephone          phone of the device, an additional broadband gain was
(Galaxy S3 mini, size approx. 12  6 cm with glass surface,      applied such that the resulting HRTFs measured in
turned off) close to their right ear. Then, the device was       KEMAR reached the expected 0 dB around 100 Hz. For
taken out and steps 2–4 repeated for a total of five inser-       the two probe tube microphones, individual sensitivities
tions of the device. Finally, the HRTF with the telephone        to a free sound field were determined. The microphone sen-
held close to the right ear was measured both with the           sitivities were measured with the microphones/probe tube
device inserted (no reinsertion after fifth round) and subse-     inlets mounted in free space on a thin wooden pole facing
quently the open ear. The participants were instructed to        a loudspeaker at 2.5 m distance, with respect to a 1/800 ref-
hold the telephone as they would normally do during phone        erence microphone mounted in the same manner. The
calls. All measurements were conducted for both ears             resulting sensitivity of the probe tube microphones includes
simultaneously.                                                  the propagation delay through the probe tube, hence this
    The database was measured with the device pair with          propagation delay is compensated through the spectral
serial number DV-0001, except for additional measure-            division.
ments that assessed nine devices with serial numbers                 Finally, the HRTFs were set to the expected 0 dB at
0003-0011. These additional measurements of the                  frequencies below 60 Hz, shifted in time by 44 samples
between-device differences were gathered as described            (equals 1 ms) and truncated to a final length of 356 samples
above but exclusively in KEMAR, with only three inser-           at 44.1 kHz sampling rate. The truncation length was
tions and without the telephone nearby.                          manually determined as the minimal length where the
                                                                 impulse response truncation does not disturb the low-
2.4 HRTF measurements and processing                             frequency end of the corresponding transfer function by
                                                                 more than ±1 dB.
    The measurements and processing of the HRTFs were
performed very similar to our previous work [3]. HRTFs           2.5 Driver responses at the eardrum and feedback paths
were measured for all 87 incidence directions where loud-
speakers were installed and both ears using exponential              The linear responses of the four drivers (two in each
sweeps covering a range from 30 Hz to 22.05 kHz (= half          side) were measured sequentially, and for each driver simul-
the sampling rate of 44.1 kHz) with an individual length         taneously at the eardrum and all microphones of the device.
of 3.2 s. To speed up the measurements, the sweeps were          An exponential sweep covering the frequency range from
overlapped in time using the multiple exponential sweeps         30 Hz to 22.05 kHz (= half the sampling rate of
technique [36], leading to an overall duration of 27 s. The      44.1 kHz) with a length of 2 s was employed. A fre-
average level of the sweeps was 81 dB SPL in the free field.      quency-dependent gain was applied to the sweep prior to
For each round of measurements, the order of incidence           playback to achieve a frequency-independent level of
directions was randomized independently.                         approx. 80 dB SPL equivalent to the free field at the ear-
    From the raw impulse responses, acoustic reflections          drum [38]. Afterwards, the microphone sensitivities (same
from equipment were removed by frequency-dependent               procedure as for HRTF) as well as the delay and sensitivity
truncation [37]. That is, frequency bands for frequencies        of the sound card were compensated, such that the impulse
>750 Hz in a short-time Fourier transform representation         responses are stored in units of Pa/V. Finally, the impulse
of the impulse responses (3.5 ms block length) were trun-        responses were truncated to 756 samples at 44.1 kHz,
cated to a length of 3.5 ms. Lower frequency bands contain       including 44 samples (= 1 ms) time shift as in the HRTF.
less reflected energy due to the limited size of reflecting sur-   Note that the longer length of driver responses as compared
faces like loudspeakers, and the truncation lengths could be     to the HRTF was found necessary due to the low-frequency
increased in lower frequency bands to avoid low-frequency        behaviour of the driver responses.
errors (600 Hz: 6 ms, 300 Hz: 13 ms, 0 Hz: 90 ms).
    Next, the responses were compensated for the influence        2
                                                                   MEMS microphones generally have a low between-device
of the loudspeakers (measured using a 1/800 referencce           variability, we here observed a maximum difference of 1.5 dB.
F. Denk, B. Kollmeier: Acta Acustica 2021, 5, 2 5
3 Results and analysis
In the following, example results that aim to represent
the extensive database as well as possible are presented
and discussed. Explicit sample data is shown for KEMAR
and two representative human participants: One male par-
ticipant where the device fit particularly well (ER03ED10)
and one female participant where only a less reliable fit
could be achieved (EL08RD06). In Sections 3.1–3.5, various
acoustic parameters are assessed and shown for one sample
device and insertion (DV-0001, third insertion into right
ear). The variation of these parameters across human par-
ticipants is evaluated and compared to measurements in
KEMAR. Averages of responses in the human participants
were computed from the magnitude responses in decibels.
In Section 3.6, the variability of all transfer functions is
evaluated. In Section 3.7, the variation of driver responses
and feedback paths within each eight vented and two closed
pairs of devices measured in KEMAR is shown. Finally,
Section 3.8 demonstrates a possible application scenario
where real-time processing with different insertion gain set-
tings is simulated for the device in a sample human ear.
While aspects particular to the shown data are discussed
with the presentation of the results, an overarching discus-
sion is given in Section 4.
Figure 3. HRIRs for frontal incidence in the right ear of
3.1 Head-related impulse responses and transfer participant ER03ED10. Each line indicates the HRIR for one
functions microphone location as indicated. The delay between channels is
caused by differences in geometric distances.
Figure 3 shows samples of the HRIR, the impulse
response representation of HRTFs, measured for frontal Sect. 3.3). This component does thus not belong to the
incidence in the right ear of participant ER03ED10, for HRIR to be measured at the probe tube inlet, and can be
all microphone locations of interest as denoted at the right interpreted as a disturbance similar to noise. As it can be
of the panel. First, small timing differences of up to 0.1 ms seen in Fig. 3, the acausal parts are most critical in the
between microphones originate from the geometric propa- occluded eardrum data, where the main response is attenu-
gation difference. It should be noted that the open eardrum ated with respect to the open-ear case but the acausal part
HRIR was measured separately from the other responses, is constant in level. In the occluded eardrum responses, the
and the good temporal alignment between both measure- additional energy of this disturbing component may impose
ments at the eardrum verifies the stability of the head posi- a lower boundary on the measured HRTFs due to an effec-
tion throughout the experimental session of better than tive decrease in SNR. Nevertheless, comparisons to
±1 cm [35]. Second, the HRIR at the eardrum of the open KEMAR data (see following sections) and further analyses
ear is considerably longer than the others, which is caused showed that up to about 10 kHz, the HRTFs measured at
by an oscillation at the k/4 resonance frequency of the the occluded eardrum yield results that are as reliable as it
ear canal. The level differences between microphone loca- can be expected from probe tube measurements in the
tions are caused by attenuation through insertion of the occluded ear (cf. Sect. 4.4). In the responses at the eardrum
device (Eardrum, occluded) or due to (destruction of) such of the open ear, this disturbance is generally low enough in
resonances of the open ear [3]. Third, in the HRIRs mea- level to be neglected.
sured at the eardrum, additional acausal peaks are seen Figure 4 shows a direction-frequency representation of
at around 0.3 ms in both responses, but not in the HRIRs the HRTFs at the eardrum of the open ear and the Concha
measured in the microphones of the device or those of microphone after 1/12 octave smoothing, for the right ears
KEMAR. These peaks are not to be confused with the mild of the three example participants. Somewhat altered but
pre-ringing artefacts as present in the Outer Vent or Con- similar structures are seen in all participants for each micro-
cha microphones. The acausal peaks very likely originate phone location. As expected, the HRTFs differ notably
from a sound path leaking directly into the body of the between microphone locations in each participant. The
probe tube microphone without travelling through the most prominent difference is an amplification around
tube. This interpretation is consistent with the additional 2–10 kHz originating from ear cavity resonances, which is
observation that the temporal alignment of this component seen at the eardrum but not at the Concha microphone
with respect to the main response varies with incidence [3, 39]. While the differences between left and right hemi-
direction, and is not present in the driver responses (cf. spheres are evident at both microphone locations, the6 F. Denk, B. Kollmeier: Acta Acustica 2021, 5, 2
Figure 5. Insertion loss for diffuse-field incidence measured in
individual participants (black curves), the average across
participants (green curve) and in KEMAR (orange curves).
participants the fit varies significantly between insertions
(see also Sect. 3.6). Between 4 and 10 kHz, the attenuation
Figure 4. HRTFs in the horizontal plane measured in the right decreases again down to 10 dB, which might be caused by
ears of KEMAR and two representative human participants, at approaching the k/2 resonance of the vent (length:
the eardrum of the open ear (left panels) and the Concha 19 mm). Above 10 kHz, the insertion loss increases again
microphone of the device (right panels). for KEMAR measurements, but decreases further in the
human participants (see also next paragraph). Apart from
outliers with a very poor fit, the insertion loss in the human
eardrum HRTFs also contains more spatial dependences participants lies within a range of approx. ±7 dB around
than the Concha microphone that originate from direc- the average for frequencies >600 Hz.
tional pinna filtering effects, which are largely destroyed Up to 10 kHz, the data from the human participants
by inserting the device [6, 7]. and KEMAR are very consistent, and KEMAR may be
seen as a human participant where a particularly good fit
3.2 Insertion loss could be achieved. In the human participants, the presence
of the probe tube unavoidably prevents a tight seal between
Figure 5 shows the diffuse-field insertion loss, the atten- the ear canal and the silicone dome of the earpiece. Thus, in
uation of external sounds reaching the eardrum by inserting practice the low-frequency insertion loss in users may look
the passive device. The insertion loss was calculated by even more like the KEMAR curve. Above 10 kHz, the
dividing the approximated diffuse-field responses at the results deviate consistently between human participants
occluded eardrum by the corresponding open-eardrum and KEMAR. The lower attenuation seen in the human
response. The diffuse-field responses were approximated participants could, on the one hand, be caused by utilizing
from the HRTFs by calculating the power spectrum aver- KEMAR out of its intended frequency range [40]. On the
aged across 47 uniformly distributed incidence directions other hand, we believe it is more likely that the apparently
(thus simulating uncorrelated summation, same directions lower attenuation in the human participants is an artefact
as in [3]) after 1/12 octave smoothing of individual HRTFs. of a low SNR in this frequency region of the occluded
Each black line in Figure 5 denotes the result for one right eardrum measurements (cf. Sect. 3.1).
ear of a human participant in the third insertion, the green
line denotes the average across participants, and the orange 3.3 Driver responses at eardrum
line denotes the corresponding result in KEMAR.
The typical insertion loss curve approaches 0 dB at the Figure 6 shows the responses of both drivers of the
low frequencies, showing that the vent allows low-frequency device at the eardrum in separate panels. Generally, the
sounds to leak into the ear canal unattenuated. Around responses differ between drivers, which is caused by using
400 Hz, an amplification of up to 5 dB is seen most promi- different driver types (cf. Sect. 2.1 and [16]). A low-
nently in KEMAR data, but also for the human partici- frequency roll-off with cut-off frequencies varying between
pants. The amplification probably results from a approx. 300 Hz and 1 kHz is seen in all curves, which is
Helmholtz resonance of the residual ear canal volume and caused by incomplete sealing of the ear canal due to the
vent opening. Above approx. 500 Hz, the attenuation vent and imperfect fit. A varying fit in the ears of different
increases for most participants up to about 30 dB around participants probably explains most of the between-partici-
4 kHz. Only in some participants, where only a poor fit pant variation below 1 kHz, as for the insertion loss. The
could be achieved, the device does not attenuate sounds tight seal that can be achieved in KEMAR also here leads
below 1–2 kHz. It should be noted that even poorer fits than to the lowest cut-off at around 300 Hz; for most partici-
included here occur in the database, and within some pants it lies at around 400 Hz. A resonance aroundF. Denk, B. Kollmeier: Acta Acustica 2021, 5, 2 7
Figure 6. Responses of the inner (upper panel) and outer Figure 7. Feedback paths from the inner driver to the Concha
(lower panel) drivers of the device measured at eardrum. Black microphone in individual participants (black lines), average
lines show the responses measured in individual participants, the across participants (green line) and KEMAR (orange line);
green line the average across participants, and the orange line response at eardrum for reference (purple line, measured in
the KEMAR data. KEMAR). Top panel: data with free-field conditions, lower
panel: data where telephone was held close to the ear.
400 Hz can be seen in KEMAR data, but hardly in any of
the participants (see also Sect. 3.6). which are most relevant for incoming signal pickup [16].
In the range of 2–6 kHz, the differences between partic- Since the behaviour of these four responses is very similar,
ipants are small (< ±5 dB with respect to average) and only the response from the inner driver to the Concha
mostly comprise a broadband offset. This can be explained microphone is shown in Figure 7 as an example. Results
by the fact that the corresponding half wave lengths are still with free-field conditions are shown in the top panel, condi-
larger than the residual ear canal lengths, and the responses tions when a telephone was held near the right ear are
are largely governed by the properties of the drivers and the shown in the bottom panel. For either condition, again
device. The broadband differences are probably a result of the individual participants are denoted by black lines, the
residual ear canal volumes that differ between participants. participants’ average is denoted by green lines and the
Beyond 6 kHz, the resonances in the individual residual ear KEMAR result is denoted by orange lines in the corre-
canals (and potentially small shifts of the probe tube, cf. sponding line style. For reference, the response of the inner
Sect. 4.4) come into play, which lead to shifted resonances driver at the eardrum measured in KEMAR in the appro-
and between-participant deviations of 30 dB and more. priate field condition is also shown as a purple line. The dif-
The KEMAR data reflects a median response of the pre- ference in magnitude between the response at eardrum and
sent human participants well across the full frequency the feedback path determines the gain margin before insta-
range, and is very close (difference8 F. Denk, B. Kollmeier: Acta Acustica 2021, 5, 2
Figure 9. Residual ear canal transfer function (RECTF, from
In-Ear microphone to eardrum) measured in all participants and
KEMAR, for diffuse-field incidence (upper panel) and the inner
driver of the device (lower panel). The results for the outer driver
are very similar to the inner driver (cf. Fig. 8).
be seen that the RECTF is only flat at 0 dB in the low fre-
quencies below 400 Hz, and generally has to be considered
when estimating the sound pressure at the eardrum using
the In-Ear microphone [25]. The sign of the RECTF shows
Figure 8. Residual ear canal transfer function (RECTF, from
that the sound pressure level is mostly higher at the In-Ear
In-Ear microphone to eardrum) measured in KEMAR and two
representative human participants. Results are shown for microphone, at some frequencies this difference amounts to
different sound sources as denoted by the legend. 30 dB and more.
Besides the dependence on frequency, considerable dif-
ferences between sound sources are noted. That is, the
to 30 dB around 6 kHz, presumably due to different man- RECTF is different between external sound sources and
ners of how they held the telephone. the two included drivers of the device. While the RECTF
The variation across participants for the free-field case is differs between external sound sources at different direc-
in the range of the between-participant variation of the dri- tions, it is very similar between the two drivers as sound
ver responses at the eardrum (cf. Sect. 3.3). The KEMAR sources. This deviation between sound sources is most
results lie well in the range of human participants data, prominent in a band between approx. 1.5 and 5 kHz. In
and coincides with the present human average curve within the human participants the deviation between sound
±2 dB between 2 and 10 kHz, and within ±10 dB above sources is also seen above 10 kHz, which may be an artefact
10 kHz. In the condition with the telephone near the ear, of poor SNR (cf. next paragraph). The results are consistent
the increase of the feedback path in KEMAR is rather high with observations made in a previous prototype of the
but still in the range of human data, presumably because Hearpiece [21], however the underlying reason is still
the telephone was placed very close to the ear. unclear. A discussion on the possible origin of this difference
is provided in Section 4.3.
3.5 Residual ear canal transfer functions Figure 9 shows the RECTF for all human participants,
their average and the KEMAR data (as already shown in
Figure 8 shows the RECTF, the relative transfer func- Fig. 8) for diffuse-field incidence and the inner driver. The
tion from the In-Ear microphone to the occluded eardrum, RECTF varies between participants above 1 kHz by up
in the three example ears for external sound sources as well to ±10 dB with respect to the average for diffuse-field inci-
as the two drivers. The RECTF was computed by dividing dence, and within ±5 dB for the inner driver. For the inner
the corresponding 1/12 octave smoothed magnitude driver, the between-participant differences increase to
responses at both microphone locations. It can generally ±15 dB above approx. 6 kHz due to shifted resonances,F. Denk, B. Kollmeier: Acta Acustica 2021, 5, 2 9
similar to the driver response (cf. Sect. 3.3). The KEMAR range of standard deviations between 15 participants is
data is very consistent with the human data up to 10 kHz already below 1 dB (below 2 dB for the insertion loss) in
for diffuse-field incidence, and across the whole frequency the relevant frequency ranges, and would further decrease
range for the drivers. The deviations between the KEMAR for larger sample sizes. Hence, the sample size of 25 is large
and human data for diffuse-field incidence across 10 kHz enough to estimate a representative between-participant
might again be explained by a low SNR at the probe tube standard deviation of the assessed metrics .
microphone for external sound sources but not the internal The results for the HRTFs for a frontal source to the
drivers (see Sect. 3.1). The hypothesis is supported by the Concha microphone are shown in the top row of Fig. 10.
observation that the between-participant differences are The between-insertion standard deviation (right panel) is
decreasing with increasing frequency in this range for dif- below 1 dB for the median across participants and below
fuse-field incidence, but increasing for the inner driver as 2 dB for the extreme cases. This is consistent with the data
a sound source. Between-participant differences that are seen in the example participants, where the maximum dif-
increasing with frequency as seen for the inner driver as ferences between insertions are below 1 dB except for one
sound source would generally be expected in this frequency insertion in EL08RD06, where variations up to 5 dB below
range due to increasing differences between ear canal 10 kHz and up to 10 dB at higher frequencies are noted.
geometries. This insertion represents an outlier that is also visible in
the other transfer functions, as assessed below.
3.6 Variations between participants and insertions The results for the Insertion Loss are shown in the sec-
ond row of Figure 10. The difference between insertions is a
This section presents results on the variation of the bit larger than for the HRTFs, but lies within ±3 dB for
transfer functions assessed above. The left column of each participant (median standard deviation 1–1.5 dB),
Figure 10 shows results for all five measured insertions in with the exception of the same poor insertion in participant
the three example ears used above, where each colour rep- EL08RD06 as discussed above. There, one poor insertion
resents one participant and each line represents one inser- results in a decreased insertion loss and deviations up to
tion. Besides these explicit examples of variations, the 20 dB to the other insertions in this participant. The stan-
standard deviations of transfer functions (calculated for dard deviation between participants lies at 4–6 dB in a
the magnitudes in dB) across insertions and participants broad frequency range above 500 Hz, where the insertion
are shown in the right column of Figure 10. The cyan line loss is negative (cf. Fig. 5), and goes towards zero at lower
shows the standard deviation across all 25 ears over fre- frequencies.
quency (for the third insertion only, standard deviation The results for the responses of the inner driver are
across individual data shown in the previous figures). The shown in the third row of Figure 10. Reinsertion typically
shaded light and dark blue areas show the 10%–90% causes only small variation below 8 kHz of smaller than
inter-quantile range of between-participant standard devia- 1 dB in the participants’ median, and within ±2 dB in
tions occurring when 5 and 15 participants are randomly the example data except the outlier in EL08RD06. This
drawn from the database, respectively. The interquartile- outlier includes deviations greater than 10 dB especially
ranges are based on bootstrapping all participants’ right at low frequencies with respect to the other insertions. A
ear data with 100 unique resamplings. Note that the medi- considerable insertion variability of the driver response
ans of standard deviation distributions across bootstrapped above 8 kHz is seen in the human participants but less pro-
subsamples are identical to the standard deviation across all nounced in KEMAR. The standard deviation between par-
25 participants. The red line denotes the median across all ticipants is approx. 2 dB between 1 and 6 kHz, and
participant of the standard deviation between insertions, increases both at lower frequencies (approx. 4 dB below
the shaded red area denotes the 10%–90% inter-quantile 500 Hz) and higher frequencies (up to 10 dB).
range across participants. The orange line denotes the stan- The results for the feedback paths (inner driver to
dard deviation between insertions in KEMAR. Finally, the Concha microphone) are shown in the fourth row of
light purple line denotes the standard deviation across all 25 Figure 10. A generally very low reinsertion variability of
participants and five insertions. Only right ears were smaller than ±2 dB in the sample data and smaller than
regarded for the analysis here for simplicity. Also, relative 1 dB in the median standard deviation is seen above
to the other variations assessed here, only small differences 1 kHz up to the high frequency end, where the SNR of
between the two ears of each participant were assumed. the measurement is sufficient (cf. Sect. 3.4). Again, the out-
For all transfer functions shown, the standard deviation lier EL08RD06 where only a poor fit was achieved on one
between participants is larger than between insertions (see insertion leads to differences of up to 10 dB to the other
right column of Fig. 10). Also, the standard deviation across insertions. However, it should be noted that the change in
combined participants and insertions (purple line) is identi- the feedback path due to poor fitting in this participant is
cal or only marginally larger than the between-participant much smaller compared to the effect on the insertion loss
standard deviation determined for one insertion (cyan line). or driver response. Also the between-participant standard
The interquartile-range of the bootstrapped between- deviation is smaller than in the driver responses and lies
participant standard deviations further increases by a fac- between 2 and 4 dB above 1 kHz. Below 1 kHz, the high
tor of about 2 for all transfer functions when the number standard deviations between both participants and inser-
of participants is reduced from 15 to 5. The inter-quantile tions are probably caused by the poor SNR (cf. Sect. 3.4).10 F. Denk, B. Kollmeier: Acta Acustica 2021, 5, 2
HRTF @Concha Mic 5 subjects (10%-90%)
10 15 subjects (10%-90%)
Frontal incidence 10
Standard dev. [dB]
5 All subjects
HRTF [dB]
0 8 Insertions (median, 10%-90%)
Insertions (KEMAR)
-5 6 All subjects + all insertions
-10
4 HRTF @Concha Mic
-15 Frontal incidence
-20 2
0
Insertion Loss Insertion Loss
0 10
Insertion Loss [dB]
Standard dev. [dB]
-10 8
-20
6
-30
KEMAR
4
-40
ER03ED10 2
-50
EL08RD06
0
Inner Driver Response Inner Driver Response
120
at Eardrum 10 at Eardrum
Standard dev. [dB]
110
H [dB SPL/V]
8
100
90 6
80 4
70 2
60 0
90 Feedback Path Feedback Path
Inner Driver to Concha Mic 10 Inner Driver to Concha Mic
Standard dev. [dB]
80
H [dB SPL/V]
70 8
60 6
50 4
40 2
30
0
Residual Ear Canal Transfer Function Residual Ear Canal Transfer Function
0 Inner Driver 10 Inner Driver
Standard dev. [dB]
RECTF [dB]
-10 8
-20
6
-30
-40 4
-50 2
-60
0
0.1 0.4 1 2 4 10 20 0.1 0.4 1 2 4 10 20
f [kHz] f [kHz]
Figure 10. Variations of transfer functions as denoted in the panel title between participants and insertions. Left column: example
transfer functions for three participants (as denoted by colour) and each five insertions; data for the individual participants have been
shifted for better display. Right column: standard deviations of transfer functions between participants and insertions; see text for
further details.
Finally, the results for the RECTF for the inner driver driver response. At high frequencies, insertion variabilities
are shown in the the bottom row of Figure 10. Up to are very similar to those seen in the driver response, best
6 kHz, only very small variations between insertions (smal- seen for the medians of between-participant standard devi-
ler than 1 dB median standard deviation) are noted. The ations but also in participant ER03ED10. The between-
exception is again the single poor insertion of the device participant standard deviation is very similar to that of
in participant EL08RD06, which causes deviations greater the driver response, with values around 2 dB for below
than 10 dB from the other measurements, similarly to the 6 kHz that increases to up to 10 dB at higher frequencies.F. Denk, B. Kollmeier: Acta Acustica 2021, 5, 2 11
Figure 12. Flowchart for the simulation of real-time sound
processing.
similar to [11] such that three different insertion gain curves
as denoted in Figure 13 were provided. The insertion gains
were chosen arbitrarily, but could be prescribed for a neu-
tral setting (no amplification, often referred as hear-through
[10, 12]), a mild and a moderate hearing loss (e.g., N2 and
N3 standard audiograms [41]). A frequency-independent
processing delay of 3.5 ms was assumed for the simulations,
which was attributed to the driver response at eardrum as
well as the feedback paths. Only the Concha microphone
and the inner driver were included for sound pickup and
reproduction, respectively.
As a basis, the transfer functions obtained in the right
Figure 11. Serial variation of the driver responses measured in ear for participant ER03ED10 with the third insertion of
KEMAR with 8 device pairs, each line representing one device the vented device with no telephone near the ear were uti-
side. The inner driver results are plotted in blue, outer driver lized. To demonstrate the impact of transfer function vari-
results in red. Light colours indicate the vented version of the
ations, several parameters were varied. First, the set of
device, dark colors the closed version.
transfer functions stated above was utilized both to com-
pute the processing filter and simulate the hearing device
(“Individual TFs”). Second, the general influence of feed-
3.7 Inter-device variability
back was assessed using the same transfer functions and fil-
The top panel of Figure 11 shows the inter-device vari- ter, but with the feedback path set to 0 (“No Feedback”).
ation for the driver responses of a series of ten device pair Third, the influence of individualization was assessed by
samples measured in KEMAR. The sample included eight using appropriate transfer functions measured in KEMAR
pairs of vented devices (light lines), as well as two pairs of for calculating the processing filter, but simulating the
closed devices (darker lines), both ears shown for the second device in the ear of the participant by using the same trans-
insertion. The responses are very similar between devices, fer functions as above (“KEMAR filter”). Fourth, the
and the deviation can mostly be described as a broadband combined effect of insertion variability and placing a tele-
sensitivity variation not exceeding ±2 dB, except for one phone next to the ear was assessed in the “Reinsertion +
vented device where only a poor fit was achieved. The gen- Telephone condition”. To this end, the processing filter
eral differences between both drivers, as well as between was computed based on the individual transfer functions
open and closed devices are intended by design, further stated above, but the behaviour of the hearing device was
analyses regarding these differences are provided in [16]. simulated using transfer functions taken from the fifth
The between-device differences of the feedback paths insertion and with the telephone near the ear in the same
(inner driver to Concha microphone, as in Fig. 7) are shown participant.
in the bottom panel of Figure 11. Again, only small differ- The results are shown in Figure 13. The top panel shows
ences exist between devices (except between open and results with a flat 0 dB target insertion gain, i.e., a neutral
closed design) that are mostly in the range of the variation “hear-through” setting that would let the user hear the envi-
of the driver response. ronment similar to the open ear [10, 12, 32]. The resulting
aided responses are very close to the open-ear response,
3.8 Application example except for a spectral ripple below approx. 2 kHz, which orig-
inates from interferences of the occluded response with the
Finally, an application example utilizing the database as delayed device output [11]. The best match to the open-ear
described above is given. Real-time processing in a linear response is achieved in the Individual TF case. The differ-
hearing device based on the Hearpiece including all sound ence to the No Feedback case is negligible, that is, no signifi-
paths to the eardrum (occluded response, device output ant influence of feedback is noted with this insertion gain
including processing delay, feedback) was simulated for ane- when only individual transfer functions are utilized. Calcu-
choic frontal sound incidence as depicted in Figure 12. lating the processing filter based on KEMAR measurements
Processing included a constant filter that was designed (KEMAR filter) results in spectral deviations distributed12 F. Denk, B. Kollmeier: Acta Acustica 2021, 5, 2
of the response, and further analyses verify that this gain
setting is at the upper end of the stability region in all
three simulation conditions including feedback. In the
Reinsertion + Telephone condition, an excess amplification
around 13 kHz yields a maximum of 81 dB in the aided
response (out of limits of Fig. 13) which lies approx. 40 dB
above the desired insertion gain. These result stress the
importance of including variations that occur in practice into
simulations of hearing devices and algorithm development.
4 Discussion
4.1 Variations of transfer functions
All assessed transfer functions showed substantial vari-
ations between participants, between insertions in the same
participant, and between devices from a series. Similar
variations of transfer functions as presented here have been
previously reported in the literature, although not in a com-
prehensive manner for one device as in the present work.
The between-participant variation of HRTFs measured in
the ear canal has been studied extensively and is usually lar-
ger than in the HRTFs of the present work [42]. However, it
has been shown before that the between-participant differ-
ences decrease at hearing device microphones, due to partial
destruction of pinna cues that are very individual [6]. Vari-
ations both between participants and insertions are also
well-known for headphone transfer functions, and the vari-
ations of the driver responses seen here are consistent with
previous literature on the issue [43].
Especially the results shown in Section 3.6 demonstrate
that the variations of hearing device related transfer func-
tions between participants are, on average, larger than
Figure 13. Obtained responses at eardrum, with simulation of those between insertions in one participant. The differences
real-time hearing device (purple, blue, orange and red lines, see between devices was usually in the range of between-inser-
text for details) adjusted to provide insertion gains (green lines, tion variations seen with reliable fits. Certainly, differences
appropriate for application denoted in panel title), open-ear between participants and devices inherently include differ-
(solid black lines) and occluded (dotted black lines) responses at ences that are usually seen between insertions, since the
eardrum for reference. device is separately inserted in each ear. It is therefore no
surprise that the between-participant variation does not
across the full frequency range, with deviations up to 10 dB significantly increase when five instead of one insertions
below 10 kHz but more than 20 dB at higher frequencies. A are considered (cf. Fig. 10, right column). However, it can-
variation of transfer functions due to reinsertion and plac- not be neglected that the distributions of variations
ing a telephone near the ear leads to spectral deviations sim- between participants and insertions are different. The inser-
ilar to the KEMAR filter condition up to 10 kHz. Around tion variabilities assessed by means of standard deviations
13 kHz, a high excess amplification of approx. 30 dB around across a small number of insertions within one participant
13 kHz is noted in this condition that comes close to an is not necessarily representative for typical variations that
instability, most probably due to the amplification of the can occur, since these may be governed by one outlier (cf.
feedback path due to the presence of the telephone (cf. Sect. Fig. 10). While the variability between insertions with good
3.4). fits is typically less than 3 dB, imperfect fits can have large
The middle and bottom panels show aided responses effects on all assessed transfer functions and may thus
including linear amplification by insertions gains denoted impact the device performance dramatically. These effects
by the green lines. The aided responses correspond well to and associated robustness of algorithms can be studies well
the open-ear response with added insertion gains, up to with the present database. To facilitate such analyses, a list
residual mismatches that are well in line with the 0 dB gain describing the fits of each insertion across all participants is
setting discussed above. Particularly with the gain setting provided with the database.
in the bottom panel, setting the feedback paths to zero Variations of the fit cause variations of the transfer
changes the simulated aided response significantly. The functions across the whole frequency range, but are most
feedback leads to a very rippled response around the peaks pronounced in the low frequencies below 1 kHz [15].F. Denk, B. Kollmeier: Acta Acustica 2021, 5, 2 13
A reduction in the tightness of fit introduces a leak between our participant cohort very well up to 8 kHz, and reason-
the device and the skin, and thus jointly leads to a smaller ably well also at higher frequencies (cf. Figs. 5–9). This
insertion loss (cf. Fig. 5), a poorer low-frequency reproduc- observation is consistent with previous literature [3, 40].
tion with the balanced armature drivers (cf. Fig. 6), and Remaining low-frequency differences can probably be
variation of the feedback path, driver response and RECTF attributed to a very tight fit of the device that could be
(see participant EL08RD06 in Fig. 10). A poor fit acts sim- achieved in KEMAR, whereas in the human participants
ilarly to a vent, and comes in addition to the effect of a vent the probe tube unavoidably generated an additional small
that is already included in the Hearpiece. Contrarily, effects leak. It should be noted here that the anthropometric pin-
of ear geometries are characterized by features that are nae greatly facilitated these measurements, and we were
structurally similar between participants, but shifted in fre- not able to fit the Hearpiece into standard artificial pinnae.
quency (e.g., HRTFs, driver response and RECTF in left Systematic differences to human data beyond 10 kHz
column of Fig. 10) [3, 44]. While the tightness of fit may occurred only in data that included the response of external
vary both between participants in general, as well as sound sources at the occluded eardrum (cf. Figs. 5 and 9,
between insertions inside one participant, differences due top panel). As discussed above, these deviations were prob-
to the ear geometry can only occur between participants, ably caused by insufficient SNR in the probe tube measure-
but may influence the fit. ments at the occluded eardrum, although it should be noted
We were also able to demonstrate that the number of that KEMAR was not originally designed for measurements
participants in the database is large enough to reliably esti- beyond 10 kHz [40]. Variations of transfer functions as
mate between-participant standard deviations. That is, the occurring between participants are inaccessible in KEMAR
uncertainty of the between-participant standard deviation measurements, even if several insertions are conducted (cf.
is already below 1 dB for most metrics when 15 participant Fig. 10). Regarding the insertion variability, the standard
are analyzed (cf. Fig. 10). According to the law of large deviation between insertions in KEMAR was typically in
numbers, this uncertainty pffiffiffi should be further reduced by the range of the human participants, but below the median
near a factor of near 1= 2 for the 25 participants in the (except for the insertion loss, see Fig. 10).
database. Only for the insertion loss, larger uncertainties In conclusion, KEMAR with anthropometric pinnae
of the between-participant standard deviation is seen seems like a suitable tool to assess the acoustic properties
(approx. 2 dB between 1 and 4 kHz for 15 participants), of in-ear hearing devices in a median adult human ear –
which is probably caused by the larger between-insertion no less, but no more. For the development and robustness
variability in this metric that also affects the between-par- analysis of algorithms, we suggest measurements on multi-
ticipant variations. Altogether, we conclude that the 25 ple human participants (as provided in this database)
participants in this database are sufficient to estimate the rather than several repeated measurements in KEMAR
typical between-participant variations with high accuracy, [6, 9].
under the assumption that the 25 participants are represen-
tative for the whole population. It has to be stated here that 4.3 Transfer functions in the residual ear canal
the selection of participants excluded those with particu-
larly small ears (cf. Sect. 2.2) where the Hearpiece cannot The RECTF, i.e., the relative transfer function between
be inserted. The participants are thus not be a representa- the In-Ear microphone and the eardrum, is of interest in
tive cohort of the whole population, but rather a represen- applications that exploit an in-situ estimate of the sound
tative cohort of potential users of the Hearpiece. pressure generated at the eardrum. Ideally, the sound pres-
Neglecting either source of variations of transfer func- sure at the eardrum could be computed by convolving
tions in the design signal processing algorithms is likely to sound pressure at the In-Ear microphone with the RECTF,
lead to an unexpected behaviour of the hearing device, as which could be individually determined through electro-
demonstrated in Section 3.8. Note that in this work, only acoustic models [25, 26] or by one measurement during
variations of transfer function magnitudes were evaluated. the fitting process [14]. However, in the present data the
For several applications, variations of the transfer function RECTF deviates significantly between sound sources, that
phase is also of great importance, and it should be noted is, between the device’s drivers and external sound sources,
that these are included in the data and similar variations and less pronounced also between external sound sources at
as for the magnitude do occur. Notwithstanding the poten- different positions (cf. Figs. 8 and 9). This behaviour is
tial impact of large variabilities due to single (poor) inser- undesired, and unexpected if one-dimensional sound trans-
tions, the usually dominating source of variance of mission through the ear canal is assumed [25, 33, 44]. We
hearing device transfer functions are differences between verified this behaviour in independent measurements with
individual ears. This result shows once more that it is the present prototype [16], and similar variations have been
worthwhile to adapt hearing devices to the acoustics of noted in a previous version of the Hearpiece [21, 32] as well
the individual ear [3, 9, 32]. as in vented hearing aids with a microphone at the inner
end of the earmould [45].
4.2 Utilization of KEMAR data Possible reasons for the dependence on the sound source
are near-field coupling of the drivers to the In-Ear micro-
In all metrics assessed, measurements in KEMAR with phone, as well as deviations from one-dimensional sound
anthropometric pinnae [17] represented a median ear from transmission through the ear canal that are known to occurYou can also read