The Impact of Global Coal Supply on Worldwide Electricity Prices
←
→
Page content transcription
If your browser does not render page correctly, please read the page content below

The Impact of Global Coal
                  Supply on Worldwide
                  Electricity Prices

                  Overview and comparison between
                  Europe, the United States, Australia,
                  Japan, China and South Africa

                                                                              Report by the IEA Coal Industry Advisory Board
© OECD/IEA 2012

                  The views expressed in this paper do not necessarily reflect the views or policy of the International Energy Agency (IEA)
                  Secretariat or of its individual member countries. The paper does not constitute advice on any specific issue or situation.
                  The IEA makes no representation or warranty, express or implied, in respect of the paper’s content (including its
                  completeness or accuracy) and shall not be responsible for any use of, or reliance on, the paper. Comments are welcome,
                  directed to carlos.fernandezalvarez@iea.org.
                                                                                                                            © OECD/IEA, 2014
INTERNATIONAL ENERGY AGENCY
            The International Energy Agency (IEA), an autonomous agency, was established in November 1974.
           Its primary mandate was – and is – two-fold: to promote energy security amongst its member
          countries through collective response to physical disruptions in oil supply, and provide authoritative
         research and analysis on ways to ensure reliable, affordable and clean energy for its 28 member
        countries and beyond. The IEA carries out a comprehensive programme of energy co-operation among
        its member countries, each of which is obliged to hold oil stocks equivalent to 90 days of its net imports.
        The Agency’s aims include the following objectives:
         n Secure member countries’ access to reliable and ample supplies of all forms of energy; in particular,
         through maintaining effective emergency response capabilities in case of oil supply disruptions.
          n Promote sustainable energy policies that spur economic growth and environmental protection
          in a global context – particularly in terms of reducing greenhouse-gas emissions that contribute
           to climate change.
              n Improve transparency of international markets through collection and analysis of
               energy data.
                  n Support global collaboration on energy technology to secure future energy supplies
                   and mitigate their environmental impact, including through improved energy
                      efficiency and development and deployment of low-carbon technologies.
                           n Find solutions to global energy challenges through engagement and
                              dialogue with non-member countries, industry, international
                                  organisations and other stakeholders.
                                                                                                         IEA member countries:
                                                                                                 Australia
                                                                                          Austria
                                                                                    Belgium
                                                                               Canada
                                                                           Czech Republic
                                                                        Denmark
                                                                     Finland
                                                                  France
                                                                Germany
                                                              Greece
                                                            Hungary
                                                          Ireland
                                                        Italy
                                                      Japan
                                                     Korea (Republic of)
                                                    Luxembourg
                                                    Netherlands
                                                   New Zealand
                                                   Norway
                                                   Poland
                                                   Portugal
                                                    Slovak Republic
                  © OECD/IEA, 2014                   Spain
          International Energy Agency                 Sweden
                    9 rue de la Fédération
              75739 Paris Cedex 15, France             Switzerland
                                                         Turkey
                              www.iea.org
                                                           United Kingdom
                 Please note that this publication           United States
                     is subject to specific restrictions
                    that limit its use and distribution.   The European Commission
       The terms and conditions are available online at      also participates in
http://www.iea.org/termsandconditionsuseandcopyright/           the work of the IEA.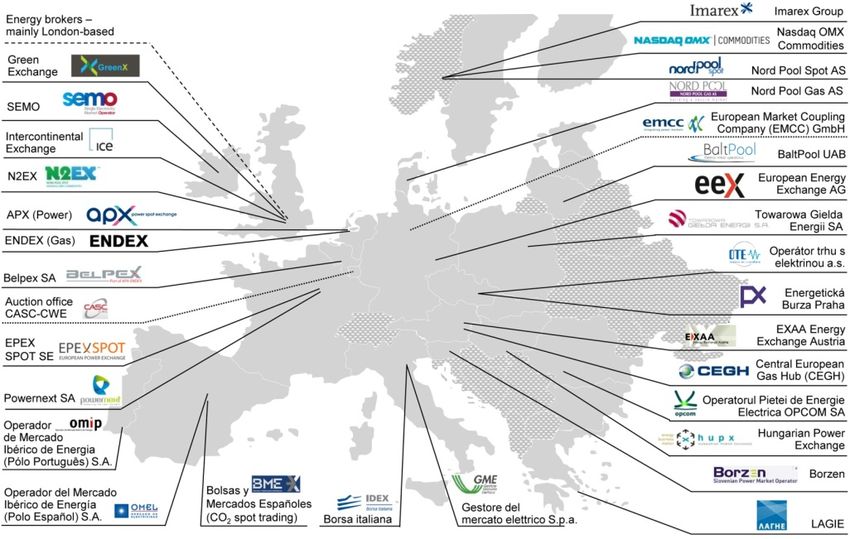
The Impact of Global Coal Supply on Worldwide Electricity Prices

                                                                                                        Page | 1

                                                        Coal Industry Advisory Board
  The IEA Coal Industry Advisory Board (CIAB) is a group of high‐level executives from coal‐related
       industrial enterprises, established by the IEA in 1979 to provide advice to the IEA Executive
 Director on a wide range of issues relating to coal. The CIAB currently has over 35 members from
around 20 countries, contributing valuable experience in the fields of coal production, trading and
                                transportation, electricity generation and other aspects of coal use.
               For more information about the IEA Coal Industry Advisory Board, please refer to
  www.iea.org/ciab, or contact Carlos Fernández Alvarez at the IEA (carlos.fernandez@iea.org) or
                                   Brian Heath, CIAB Executive Co‐ordinator (mail@ciab.org.uk).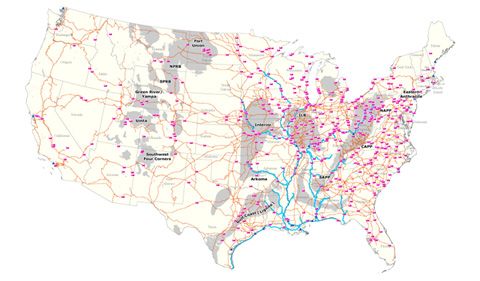
The Impact of Global Coal Supply on Worldwide Electricity Prices

       Acknowledgements
        This report is part of the 2013 Work Programme of the Coal Advisory Board (CIAB) and was
        prepared by the CIAB Work Programme Activity 6 Group. The project leader was Hans‐Wilhelm
        Schiffer of RWE, who was instrumental in the development of this report, as was Hendrik Voss of
Page |2 RWE. The following individuals served as leaders and contributors to the report on behalf of their
        respective organisations:

       Europe
       Leader: Hans‐Wilhelm Schiffer, RWE (Germany)
       Contributors: Hendrik Voss, RWE (Germany)
       Maggi Rademacher, E.ON Kraftwerke (Germany)
       Roland Lübke, German Coal Association
       Nigel Yaxley, Association of UK Coal Importers
       Rinaldo Sorgenti, Assocarboni (Italy)

       United States
       Leader: Cartan Sumner, Peabody Energy (USA)
       Contributors: Veronika Kohler, National Mining Association (USA)
       Stu Dalton, EPRI (USA)

       Australia
       Leader: Justin Flood, Delta Electricity (Australia)
       Contributors: Greg Sullivan, Australian Coal Association
       Peter Wormald, Delta Electricity (Australia)
       Peter Morris, Australian Coal Association

       Japan
       Leader: Masato Uchiyama, J‐POWER (Japan)

       China
       Leader: Nannan Sheng, Shenhua Group (China)

       South Africa
       Leader: Gina Downes, Eskom (South Africa)
       Contributors: Nikki Fisher, Anglo Operations Ltd. (South Africa)
       Julian Beere, Anglo Operations Ltd. (South Africa)

       Finally, much appreciation is owed to Brian Heath of the Coal Industry Advisory Board, and Carlos
       Fernández Alvarez of the International Energy Agency’s Gas, Coal and Power Markets Division,
       with substantial input from Harald Hecking, and Janet Pape for editing and Nancy Kluth/Cornelia
       Grevenstuk for formatting.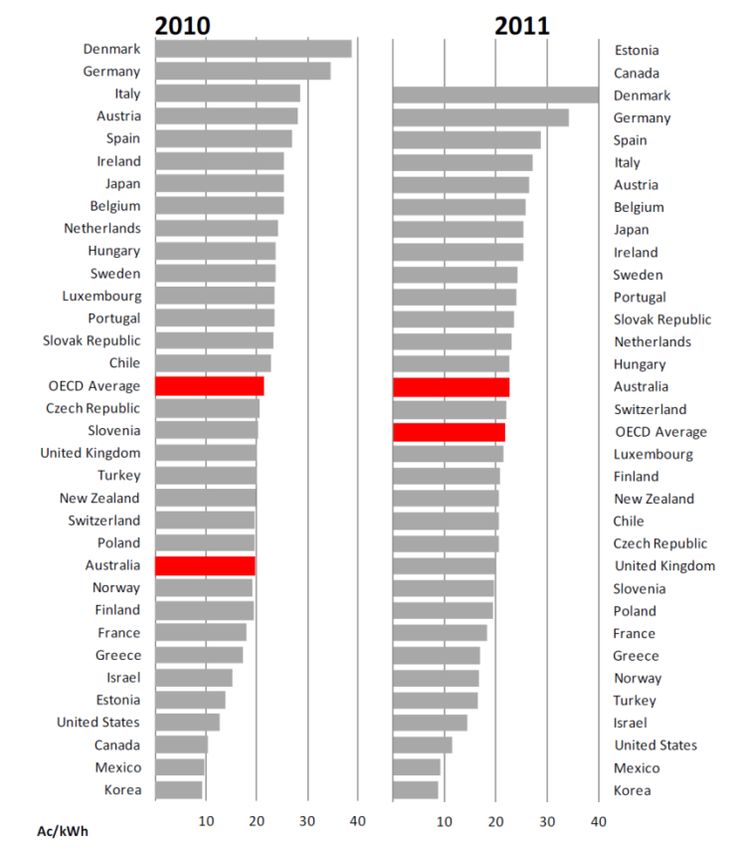
The Impact of Global Coal Supply on Worldwide Electricity Prices

Table of contents
Acknowledgements ........................................................................................................................... 2
Executive summary ........................................................................................................................... 6
     Key messages of this report: ..................................................................................................... 6 Page | 3
         Europe ................................................................................................................................ 7
         United States...................................................................................................................... 7
         Australia ............................................................................................................................. 7
         Japan .................................................................................................................................. 8
         China .................................................................................................................................. 8
         South Africa........................................................................................................................ 9
Introduction..................................................................................................................................... 11
    Structure of the electricity markets ........................................................................................ 11
    Market design .......................................................................................................................... 11
    Fuel supply ............................................................................................................................... 12
    Developments in coal and electricity prices ............................................................................ 12
Europe ............................................................................................................................................. 14
    Structure of the electricity market .......................................................................................... 14
    Market design .......................................................................................................................... 16
    Power plant fuel supply ........................................................................................................... 20
    The development of hard coal and electricity prices .............................................................. 21
The United States ............................................................................................................................ 26
    Structure of the electricity market .......................................................................................... 26
    Market design .......................................................................................................................... 29
    Power plant fuel supply ........................................................................................................... 30
    Development of hard coal and electricity prices ..................................................................... 31
Australia .......................................................................................................................................... 33
    Structure of the electricity market .......................................................................................... 33
    Market design .......................................................................................................................... 35
    Power plant fuel supply ........................................................................................................... 36
    Development of hard‐coal and electricity prices .................................................................... 36
Japan ............................................................................................................................................... 40
    Structure of the electricity market .......................................................................................... 40
    Market design .......................................................................................................................... 40
    Power plant fuel supply ........................................................................................................... 42
    Development of hard‐coal and electricity prices .................................................................... 43
China ................................................................................................................................................ 45
       Structure of the electricity market .......................................................................................... 45
       Market design .......................................................................................................................... 46
       Fuel supply ............................................................................................................................... 47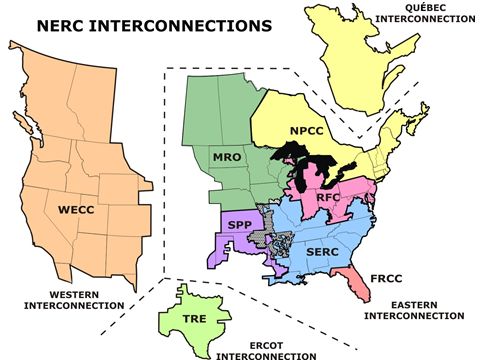
The Impact of Global Coal Supply on Worldwide Electricity Prices
Developments in coal and electricity prices ............................................................................ 48
South Africa ..................................................................................................................................... 49
Structure of the electricity market and energy mix in power generation .............................. 49
Market design .......................................................................................................................... 51
Page |4 Power plant fuel supply ........................................................................................................... 54
How have consumer prices for electricity developed since 2000, differentiated
according to important customer groups? ...................................................................... 54
Conclusion ....................................................................................................................................... 55
List of acronyms and abbreviations ................................................................................................ 56
References ....................................................................................................................................... 57
List of tables
Table 1 • Overview of market characteristics in different regions ................................................... 9
Table 2 • EU‐27 power generation by energy carrier ..................................................................... 14
Table 3 • Proportion of coal price increases which is passed through to electricity prices ........... 20
Table 4 • Developments in hard‐coal prices and wholesale electricity prices ............................... 21
Table 5 • Average retail price of electricity, by end‐use sector ..................................................... 32
Table 6 • Tax on each fossil fuel ..................................................................................................... 42
Table 7 • Eskom’s generation capacity by fuel type as at 31 March 2013 ..................................... 49
List of figures
Figure 1 • Wholesale market places for electricity and energy products in Europe 2013 .... …..…..17
Figure 2 • North‐western European merit order that decides the power plant dispatch.............. 17
Figure 3 • Merit order of the German wholesale portfolio, 2012 versus 2005 .............................. 19
Figure 4 • Developments in selected primary energy prices free German border (nominal) ........ 22
Figure 5 • German electricity price for private households ........................................................... 23
Figure 6 • German electricity price for industry (70 to 150 GWh/year) ......................................... 24
Figure 7 • Net power generation n the United States through 2040 (TWh) .................................. 26
Figure 8 • States with more coal‐based electricity generally have lower rates ............................. 27
Figure 9 • US electricity fuel sources, 2009 to 2013 ....................................................................... 27
Figure 10 • NERC interconnections ................................................................................................. 28
Figure 11 • Coal‐fuelled electricity generation supply chain in the United States ......................... 30
Figure 12 • Utilisation rates ............................................................................................................ 30
Figure 13 • Annual real price of coal, price of electricity for all sectors ......................................... 31
Figure 14 • Australia’s electricity market structure for 2010/11.................................................... 33
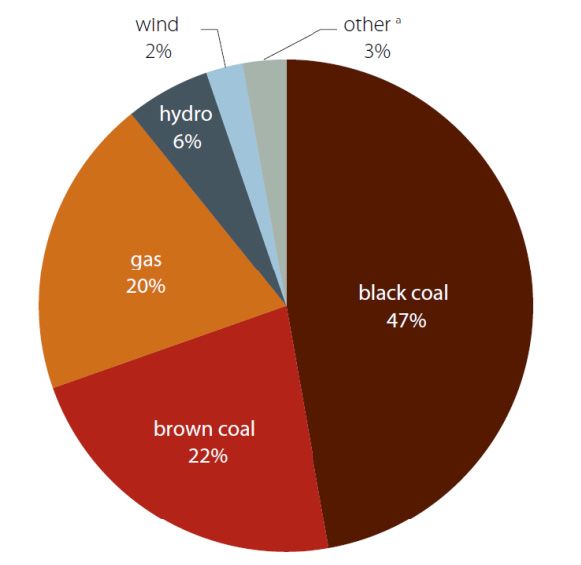
Figure 15 • Fuel sources for electricity in Australia, by energy source 2010/11 ............................ 34
Figure 16 • Historical and forecast energy growth in the NEM ...................................................... 34
Figure 17 • NSW electricity price (time‐weighted, all periods) and export coal price .................. 37
Figure 18 • Retail electricity price index ......................................................................................... 37
Figure 19 • Retail electricity price components .............................................................................. 38
Figure 20 • Retail price of electricity in Australia in comparison.................................................... 39
Figure 21 • Japanese energy mix in power generation .................................................................. 40
Figure 22 • Market clearing price and generating costs of each fuel ............................................. 41
Figure 23 • Electricity generation full costs of coal‐fired and gas‐fired in 2010 and 2030............. 42
Figure 24 • CIF prices of fossil fuel and electricity prices in Japan ................................................. 43
The Impact of Global Coal Supply on Worldwide Electricity Prices

Figure 25 • Generating electricity fuel costs of tenpower utilities ................................................. 44
Figure 26 • Consumer prices of regulated public utilities .............................................................. 44
Figure 27 • Electricity consumption growth in various parts of China in the first half of 2013 ..... 45
Figure 28 • Coal exporting and importing regions in China, 2010 .................................................. 47
Figure 29 • Eskom’s electricity sales by customer, 2012 ................................................................ 49
Figure 30 • Projected coal demand ................................................................................................ 50 Page | 5
Figure 31 • Comparison of increase in electricity prices and Consumer Price Index inflation ...... 52
Figure 32 • Eskom’s electricity revenues and operating costs ....................................................... 53

List of boxes
Box 1 • The fundamental correlation between coal and electricity prices .................................... 22
Box 2 • Spain: tackling the electricity deficit .................................................................................. 25
The Impact of Global Coal Supply on Worldwide Electricity Prices
Executive summary
Hard coal1 is the most important primary energy source in power generation, with 36% of globally
generated power relying on this fuel. Its significance varies by world region. In countries with
large resource endowments such as China or South Africa, the share of hard coal power
Page |6 generation is more than 80%. In rather import‐dependent regions such as Europe or Japan, the
share is lower, but with 15% and 25%, respectively, hard coal plays a significant role in power
generation as well. Irrespective of hard coal’s share of power generation in a region, the influence
of coal prices on electricity prices is nearly always considerable.
The report at hand therefore provides an analysis of the impacts of global hard coal supply on
worldwide electricity prices. It conducts market studies of six power markets, namely Europe, the
United States, Australia, Japan, China and South Africa. Each of these regions is evaluated
concerning its respective power market structure, market design, coal supply and the
interrelation of coal and electricity prices.
Key messages of this report:
Hard coal is the dominant fuel in global power generation because full generation costs
are well below those of oil, gas or renewables. In regions where power prices are based
on full costs due to regulation, low full costs of coal plants directly imply low electricity
prices. When power prices are based on short‐run marginal costs (the merit order
principle), the fuel costs of the price‐setting plant matter. Therefore, inexpensive coal
serves to decrease the price of electricity, when the price‐setting plant is a coal‐fired one.
In Europe and Australia, coal prices have an increasing impact on electricity prices. In
those countries, as well as in many US states, power price formation is based on the merit
order principle. Expanding renewable energy generation and sluggish or constant power
demand increase the frequency of hard coal plants being the price‐setting power unit.
The more often these plants set the price, the higher the coal price’s impact is on the
electricity price, irrespective of the coal’s share in total power generation.
In Japan (with the exception of the relatively small deregulated market) or South Africa,
where power systems are predominantly monopolistic, coal prices have some impact on
power prices as well. Electricity prices are state regulated, based on full‐costs. Rising coal
prices increase fuel costs and thus also full‐costs and power prices. However, other cost
components such as capital or operating costs influence electricity prices as well.
The share of hard coal in power generation is in part driven by the resource endowment
of a region. As such, the United States, Australia, China and South Africa exhibit rather
high shares of hard coal power generation, being self‐suppliers of lower‐cost domestic
coal. But hard coal also plays a major role in power generation in Japan or Europe,
although both are highly dependent on hard coal imports, since coal prices are well below
prices of alternative energy sources.
Given future expansion of renewables, coal power generation in certain regions might
decline. However, the coal price impact on power prices can nonetheless increase, as coal
plants are likely to increasingly become the price‐setting power units. Therefore, future
security of coal supply is necessary to keep wholesale electricity prices stable.
1
Hard coal is defined as coal of gross calorific value not less than 5 700 kcal/kg on an ash‐free but moist basis and with a mean
random reflectance of vitrinite of at least 0.6. Hard coal comprises anthracite and bituminous coal, i.e. coking coal and other
bituminous coal.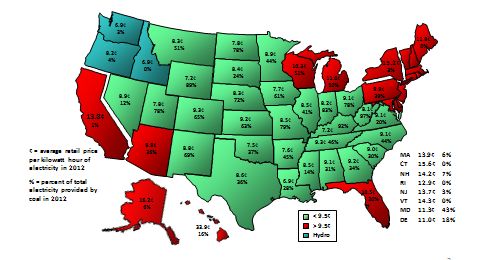
The Impact of Global Coal Supply on Worldwide Electricity Prices
Europe
The European Union had a total power generation of 3 260 TWh in 2012, of which hard
coal contributed a share of 15%.
In the light of liberalised European power markets, liquid wholesale exchanges such as
the EPEX spot have emerged with price formation following the merit order principle. Page | 7
Nonetheless, European countries still have considerable differences concerning market
structure and supply mix.
In 2012, hard coal‐fired power plants were price‐setting in Germany in nearly 80% of the
hours. This share has increased from 50% within the last years due to the strong
expansion of renewables.
Given the increasing degree of market integration in the European Union (EU) and nearly
bottleneck‐free power exchange in northwest Europe, hard coal thus has a dominant
price impact on the neighbouring western markets as well.
The impact of the coal price on the whole power price varies in Europe with respect to
the share of coal costs at total variable costs, the frequency of coal plants being price‐
setting, the supply mix and the interconnections to other countries. High coal price
impacts can be identified for the Eastern European markets or the United Kingdom.
Only a minor part of retail power prices is explained by the wholesale price. Retail prices
also include taxes, network fees or charges for subsidies to renewable energy.
The European Union imports more than 60% of its thermal coal demand from the world
market at prices historically significantly below those for natural gas or crude oil.
United States
In the United States, 42% of electricity was produced by coal over the five‐year period
2009‐2013.
The US electricity market is separated into three main power grids and different regional
wholesale markets. Regulatory models vary by state between full regulation of vertically‐
integrated utilities where prices are regulated, and regulation of the distribution only,
where markets set the power price.
States with higher shares of coal‐fired generation exhibit lower power prices.
Historically, coal and electricity prices have been related to each other.
Coal prices exhibit less volatility than natural gas prices, thus fostering power price
stability.
The United States is self‐sufficient with respect to hard coal consumption.
Australia
Hard coal accounts for 47% of Australian electricity supply. However, this share is likely to
decrease because Australian energy policy targets 41 TWh coming from renewables by
2020.
The National Electricity Market is the dominating market region in Australia and the
wholesale price, determined by the merit order principle, tends towards short‐term
marginal costs when there is excess generating capacity, and otherwise to average costs.
Due to a downturn in power demand and increasing renewables generation, excess
capacity has increased and higher‐cost hard coal plants dominate price‐setting in peak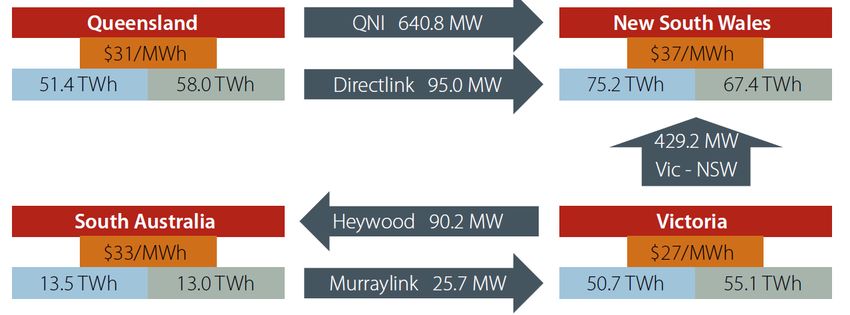
The Impact of Global Coal Supply on Worldwide Electricity Prices
periods instead of still more expensive gas or hydro plants as before. In off‐peak
situations lignite or lower‐cost hard coal plants are price‐setting.
With the exception of some hard coal plants supplied by export‐oriented mines, coal
power plants are mainly supplied by captive mines or domestic mines with limited export
options, which makes coal prices independent of higher coal export prices.
Page |8 Therefore, the Australian electricity wholesale price has remained rather flat and has
evolved separately from export hard coal prices.
However, retail prices have increased sharply since 2006 due to higher network costs and
costs of carbon and renewables integration, but prices are well below other comparable
countries because of the high share of generation from domestic hard coal.
Japan
Before and after Fukushima, generation from hard coal has made up 25% of Japanese
electricity supply.
The Japanese electricity market is divided into ten regional state‐regulated monopolies,
with each monopoly integrating generation, transmission and distribution. The retail
sector is becoming rather deregulated, but only 2% of supplies have been sold through
the deregulated market so far.
In the regulated sector, electricity prices are determined by full‐cost pricing, whereas
wholesale prices in the smaller deregulated market are determined at the Japanese
Electric Power Exchange (JEPX) using the merit order principle.
Coal prices do in part drive regulated electricity prices, since electricity prices are based
on full costs of generation and on price adjustments for changing fuel costs.
Deregulated power prices are rather uninfluenced by coal prices, since gas‐fired power
plants mainly set the wholesale market clearing price.
Japan is fully dependent on hard coal imports. Hard coal is mainly purchased on the basis
of long‐term contracts.
China
More than 80% of total Chinese power generation comes from coal power plants, which
had a total capacity of 834 GW in 2013.
Besides five big national independent power producers, there are numerous smaller
regional generating utilities and local state‐owned generators.
Retail electricity tariffs are strictly regulated by the government, which tries to keep
tariffs low in order to preserve public acceptance and to prevent inflation.
Power generators sell power to the grid operator at regulated on‐grid tariffs, which vary
by region and are adapted to coal prices.
Plants purchase coal at widely liberalised prices, which are influenced by (international)
supply and demand developments.
In times of high coal prices, the power sector cannot pass the costs on to the end‐user
and thus either faces losses or reduces generation, which in turn can lead to power
supply disruptions.The Impact of Global Coal Supply on Worldwide Electricity Prices
South Africa
95% of South African power demand is supplied by Eskom, a fully state‐owned and
vertical integrated utility. Coal‐fired plants comprise 85% of Eskom’s generating capacity.
However, the country is trying to increase the share of independent power producers.
The National Energy Regulator of South Africa (Nersa) sets a revenue cap based on Page | 9
Eskom’s full generation costs, which is then translated into a variety of tariffs
differentiated by customer groups.
Table 1 • Overview of market characteristics in different regions
Europe United States Australia Japan China South Africa
85% of
15% out of Eskom’s
Hard coal 42%
3 260 TWh of generating
in power (five-year 47% 25% 83%
total power capacity, 92%
generation average)
generation of 232.8 TWh
produced
Liberalised Five big
Three main Ten regional
competitive independent
power grids state-regulated
power power
and different monopolies,
markets, producers,
regional NEM vertically Eskom is state-
advancing smaller
wholesale dominates integrated over owned
Electricity market regional
markets, market region, generation, vertically
market integration, generating
regulatory competitive transmission, integrated
structure variety of utilities and
models vary by energy only distribution and monopoly
national local state-
state (full market partly retail, company
energy owned
regulation vs. retail at minor
policies (e.g. generators,
distribution share
renewables two grid
regulation) deregulated
subsidies) operators
Revenue cap
In regulated Regulated price
On-grid for Eskom
states, price is based on full-
Merit-order electricity tariff based on fuel,
based on full- costs and fuel
Merit-order principle at regulated by operating and
costs and fuel cost adjustment
Price principle at NEM government capital costs,
cost adjust- system,
formation wholesale wholesale with fuel revenue cap
ment. Restruct- deregulated
markets market, price adjustment broken down to
ured states retail: merit-
ceiling based on coal tariffs for
follow merit- order price at
prices consumer
order pricing. JEPX
groups
Fully self- South Africa is
Fully In 2012 China
supplied, fully self-
dependent on imported
mostly captive supplied,
60% of hard hard coal 300 million
mines but mostly captive
Hard coal coal demand Fully self- imports, tons (Mt) and
some coal mines,
supply is imported to supplied purchased produced
supplies have domestic coal
EU mainly over more than
dependence price is one-
long-term 3500 Mt
on coal export third of coal
contracts domestically
prices export price
Coal prices
Regulated
have been
High impact, retail: medium Low impact
relatively sta-
since mid- High impact, impact since since govern- Medium im-
ble for decades
merit coal since mainly coal costs ment tries to pact since coal
and directly
plants set the hard coal influence full- keep retail costs are part
correlated with
Electricity price in 80% plant are price costs and thus prices down; of total power
lower rates.
price of the hours setting due to the power thus high coal generation
Many restruct-
impact on due to renew- sluggish price; prices imply costs, com-
ured states
hard coal ables expan- demand and unregulated losses for prising capital
have signify-
sion and high increasing retail: rather no power or grid costs and other
cant gas capa-
cost different- share of significance as utilities operational
city, gas gener-
ces from gas renewables gas plants are costs
ation and typic-
plants. usually price
ally higher
setting
rates.The Impact of Global Coal Supply on Worldwide Electricity Prices
Eskom therefore is incentivised to minimise costs by dispatching according to variable
costs. However, the current low supply reserve margin makes all plants run at full
capacity.
Coal power plants are domestically supplied by either dedicated mines or through short‐
and medium‐term contracts from export‐oriented mines. Historically, domestic coal
Page |10 prices have been roughly one‐third of international prices because of lower coal qualities,
lower transport costs and constrained export infrastructure limiting international price
impacts.
Primary energy costs for coal account for a significant part of power generation costs.
However, they are not perfectly correlated with electricity prices, as full power
generation costs comprise other cost components as well, such as capital costs and other
operational costs.The Impact of Global Coal Supply on Worldwide Electricity Prices Introduction Coal is the world’s primary energy source for power generation, accounting for some 36 percent of global electricity generation. Its significance varies greatly among countries and world regions. A fundamental parameter is the resource endowment of each specific region. Usually, hard coal is of particularly great importance if there are domestic deposits that are economically mineable. Page | 11 This is the case in the United States, Australia, China and South Africa. In countries or regions that are entirely or predominantly supplied with hard coal from the world market, such as Japan and the European Union, hard coal makes a significant contribution towards ensuring security of supply. Coal plays a special role in the price formation process on the electricity markets. In this respect the costs of hard coal often have a significantly greater influence on electricity prices than the percentage share of hard coal in power generation. Therefore, hard coal price swings disproportionately affect wholesale electricity prices in the areas which were studied. The study at hand highlights the significance of hard coal for all continents, using the examples of the above markets. Structure of the electricity markets The utility structure in the regions under examination differs significantly, ranging from a single, dominant utility (France and South Africa) all the way to a competitive market situation with a whole host of market actors (the United States and Germany). Electricity grids and their cross‐border connections are structured very differently, resulting most notably from the countries’ specific geographic features. Japan being an island country has a purely internal grid without any external connections. Owing to their vast size, the United States and Australia even have several grid regions that are hardly interlinked. In northwest Europe and South Africa, the electricity grid has been fully integrated for several years now. Some transmission bottlenecks still existing at the national borders are continuously reduced. It is assumed that the electricity demand in all countries under examination in this paper will remain constant or will slightly increase in the future. This is especially true of the OECD countries for which only a moderate economic growth has been forecasted. The situation is different in South America, where demand is growing and new coal‐fired capacity is under construction. Electricity demand is expected to grow in China, and even though the Chinese government is trying to diversify primary energy sources, coal will remain the backbone of Chinese power generation. Market design In terms of market design, there are again significant regional variations, ranging from nearly full regulation to price formation in the market. In Japan and South Africa, electricity prices are set by the regulatory authorities according to the full‐cost principle. In China, the regulator sets retail prices and tries to keep prices low. Following the European path, the liberalised market, which is currently still very small, is to be expanded. In Europe, electricity prices are largely determined according to the market principle. However, there are also certain exceptions, such as renewable energy, which is promoted with special subsidies (especially in Germany). In Australia, the market principle determines wholesale electricity prices, although retail pricing is largely regulated, and the United States has the full range of different regimes evident in
The Impact of Global Coal Supply on Worldwide Electricity Prices

        individual states. One feature all regions have in common is that the electricity grids, being
        natural monopolies, are fully regulated.
         There are wholesale exchanges in many regions; their significance depends on the specific degree
         of regulation. In Europe, large quantities of electricity are traded at various exchanges, with the
         prices being identical in the different market places most of the time. By contrast, in Japan only
Page |12 1% of electricity is traded at the exchange.

        As a matter of principle, electricity price formation in Europe follows the merit‐order principle –
        with the exception of renewable‐energy remuneration. But also in Japan, the merit order is used
        as guidance for pricing. In principle, the monopoly Eskom in South Africa also applies the merit
        order approach in order to minimise costs; however, all power plants are owned by the same
        operator. In China, dispatch is centrally planned, which leads to certain inefficiencies.
        CO2 emissions are priced differently. In South Africa, at present, the electricity price includes a
        relatively small environmental protection markup; the introduction of a CO2 tax is planned for the
        future. Japan and Australia already have a CO2 tax. The European cross‐border CO2 certificate
        system is currently the first of its kind. In the United States, there are only geographically limited
        systems to date, however, extension of is under consideration.
        Despite all the differences concerning market design, coal‐fired power generation plays a huge
        role in all countries. This becomes particularly clear when looking at the power plants’ utilisation
        levels. In all regions under consideration, the existing coal‐fired power plants are needed in some
        50% to 95% of all hours to cover electricity demand. When electricity consumption rises, e.g. in
        the morning hours of a day, additional hard coal‐fired power plants are frequently operated to
        cover the demand. In deregulated electricity markets, the plants’ generation costs incurred in this
        way must be reimbursed via the electricity price. If the generation costs of coal‐fired power plants
        go up, the market price of electricity will directly rise in these hours. In an analogous manner, the
        same applies if the coal plants’ generation costs fall. In this way, the liberalisation of the global
        power markets helps to directly implement the price effect of hard coal described above.

        Fuel supply
        The quantity of hard coal imported and exported primarily depends on the domestic deposits
        existing in the specific country. As coal is an important energy carrier in all regions, a wide variety
        of forms is possible. in Japan, for instance, the entire demand for coal is covered by imports,
        while particularly Australia and South Africa mine considerably more coal than required to meet
        domestic demand, which makes them not only self‐suppliers but also exporters of hard coal.
        China is the world’s biggest producer, consumer and importer of coal.

        Developments in coal and electricity prices
        In the United States and Europe, most notably in Germany, there is a strong correlation between
        developments in coal and electricity prices. While this has been the case in the United States for
        decades now, in Europe, the dependence of electricity price levels on hard coal prices has
        increased more recently as a result of the strong expansion of expensive renewables. Their feed‐
        in priority has caused the merit order to change, so that coal‐fired power plants are setting the
        price to a greater extent. In Australia, sluggish demand makes coal plants become more and more
        price setting as well. In Japan the merit order has also changed, albeit with other implications.
        Due to the decommissioning of nuclear power stations in the aftermath of the Fukushima
        disaster, the marginal plants are nowadays, above all, natural gas‐fired stations. The price of coal
        is only important in so far as it must be taken into account by the regulators as being part of the
The Impact of Global Coal Supply on Worldwide Electricity Prices full costs when setting prices. In South Africa the situation is similar. In China, coal‐fired power plants have to purchase coal at market prices, whereas they sell electricity to the grid operator at regulated tariffs which include some fuel cost pass‐through mechanism. Since end‐user electricity prices are regulated as well and kept low by the government, generators or grid operators face losses from rising coal prices. Global coal prices have slightly risen in recent years, both in real and nominal terms. Before the Page | 13 economic crisis started, the price in Europe rose sharply, with a corresponding impact on power prices; conversely, lower coal prices in 2012 had a bearish effect on wholesale power prices. Electricity prices vary considerably in the different world regions. The low price of coal (especially compared with other energy carriers) has had a dampening effect on the electricity price in the United States and South Africa. In this respect, US states with a higher coal share in electricity generation also have lower electricity costs. A change in the philosophy of depreciation values and the need to finance new capacity has caused the electricity price in South Africa to increase significantly in the last few years. In Europe, higher electricity prices are most notably resulting from sharp increases in burdens imposed by the Administration. Although deregulation has led to a fall in prices in Japan, this was partly offset by higher costs following Fukushima. In Australia, the price for households went up owing to the grid expansion.
The Impact of Global Coal Supply on Worldwide Electricity Prices

        Europe
        Structure of the electricity market
Page |14 The creation of a cross‐border market for electricity in the European Union has given rise since
        1998 to one of the world’s largest interconnected power‐supply regions and one which has been
        subject to a common price formation process.
        Power generation in the EU‐27 totalled 3 295 terawatt hours (TWh) (gross) in 2012. The structure
        has a breakdown by energy carrier as follows:

        Table 2 • EU‐27 power generation by energy carrier in 2012
         Energy carrier                                                              Percentage

         Nuclear                                                                     26.8%

         Hard coal                                                                   16.5%

         Lignite                                                                     10.3%

         Natural gas                                                                 17.6%

         Oil                                                                         2.2%

         Other non-renewable sources                                                 5.9%

         Hydropower                                                                  11.1%

         Other renewables                                                            9.6%

        Source: Eurostat, 2014.

        Both as regards the energy mix and the market structure, there are still considerable differences
        among the EU states.
        Greece’s and the Czech Republic’s power generation, for instance, rely heavily on domestic
        lignite. In Poland, hard coal is the most important source of electricity generation, but
        supplemented by the country’s lignite as another significant pillar. In the Netherlands, natural gas
        is the heavyweight, as is the case in Italy, where natural gas accounts for 54% of electricity
        generation. In Austria, hydropower is abundantly available thanks to the country’s natural
        conditions. This is also true of Sweden, albeit with some qualifications. There, use is also made of
        nuclear energy to generate power. In France, more than two‐thirds of power generation is based
        on nuclear energy. By contrast, countries such as Italy and Austria, on political grounds, do not
        use nuclear energy. In the case of Italy, a 2011 referendum has re‐confirmed the step away from
        nuclear of 1987. Germany, in the aftermath of the 2011 reactor accident in Fukushima, has
        decided to phase out nuclear energy completely by the end of 2022. In the United Kingdom the
        generation mix is strongly dependent on the competitive position between coal and gas. In 2012
        around 40% of electricity was coal‐based – an increase of over 30% from 2011 – as a result of
        continuing high gas prices and relatively low generation costs for coal‐fired plants. Spain, with its
        limited domestic resources except for coal, has a diverse mix of nuclear, coal, combined‐cycle gas
        turbines (CCGTs) and renewables ‐ wind and solar as well as hydro. Given the current gas and coal
        prices, coal‐firing generation exceeded CCGTs by about 40% in 2012. Notably, the Spanish coal
        capacity is at less than half of CCGTs’ capacity. Notwithstanding, the Spanish government has
        been prioritising domestic coal by application of an EU directive that entitles member states to do
        so on grounds of security of supply.
The Impact of Global Coal Supply on Worldwide Electricity Prices The most important reasons for the considerable variations in the energy mix among the EU member states are differences in their endowment with natural energy resources and their various energy policies. Although the EU’s energy policy – in a spirit of solidarity among the member states – aims at ensuring the central Community goals of a functioning single market, guaranteed security of supply, the promotion of energy efficiency, an expansion of renewable resources and the link‐up Page | 15 to the energy grids, member states retain responsibility for the conditions of use of their energy resources, the choices made between different energy sources and the determination of the general energy‐supply structure. Despite common EU energy politics, political interventions at the country level have grown in frequency in recent years, increasing risks for energy investors. Recent examples in Germany include: the introduction of a nuclear tax in 2010, the decision to exit from nuclear power in 2011 and plant closure restrictions in 2012. In the neighbouring countries, Belgium added a nuclear tax in Belgium in 2011, the Netherlands added a coal tax in 2012 and the United Kingdom introduced both a carbon floor price in United Kingdom in 2013, and an emissions performance standard, which prevents the construction of new coal‐fired power stations without carbon capture and storage (CCS), whilst allowing the unabated construction of gas plants. Similar measures have been introduced in other EU member countries. Likewise, the market structure in the European power‐generation sector also varies significantly between member states. Examples of states where one single power producer plays a dominating role are France and Greece. By contrast, a low degree of concentration can be noted for countries such as the United Kingdom, Germany and the Netherlands. In Germany, the EU’s largest electricity market, for example, the four largest power producers together account for a 45% share in total generation capacity and produce 60% of the power generated. In addition, there are more than 100 independent power plant operators with plants of more than 10 MW – regional and local providers – as well as over one million operators of small PV, wind, water, biomass and biogas plants. In Spain, the five largest generators produce around 70% of all generated power, with many small producers of combined heat and power (CHP), wind, photo‐ voltaic (PV), etc. The national electricity grids have been linked by interconnectors for several decades primarily to ensure grid security. With the liberalisation of the energy markets at the end of the 1990s, cross‐ border trade in electricity was added. Electricity trading initially had to face system‐related constraints. In recent years, however, there has been an increasing coupling of the national markets. A milestone in the integration of the EU’s electricity markets was reached in November 2010 with the coupling of the northwest European markets (Germany, France, the Netherlands, Belgium and Luxembourg). Since then, the national electricity spot markets of nine countries have been coupled at a wholesale level. The positive implications this move was expected to have for market results – from optimal utilisation of cross‐border capacities – have materialised. In some 60% of the hours, for instance, the same price can now be noted on the wholesale market in France, Germany, Belgium, the Netherlands and Luxembourg. Before the Central Western Europe Market Coupling became effective, this was the case in less than 1% of the hours in a year. The Nordic region is expected to be coupled with Western Europe in the next phase. The EU Commission and the European Agency for the Cooperation of Energy Regulators (ACER) aim at coupling the spot markets as a target model for the entire EU by 2015. However, in the short and medium term there a still limited interconnector capacities preventing a completely barrier‐free market region across the EU.
The Impact of Global Coal Supply on Worldwide Electricity Prices

         From the year 2005 on, electricity demand has been largely constant in the EU. Once the
         economic crisis has been overcome, consumption is expected to rise again – although limited to
         the scale of an annual 1% on average. Depending specifically on the initial cyclical situation and
         on specific economic perspectives, developments are likely to vary among the member states. In
         Germany, for example, electricity consumption is expected to be largely stable in future, as it is in
Page |16
         the United Kingdom, whereas for other states – Eastern Europe in particular – growth
         perspectives of over 1% per year are assumed. Growth figures could be significantly higher if
         other sectors – i.e. transport and heat – become more dependent on electricity.

        Market design
        For the power generation industry, liberalisation of Europe’s energy markets has meant that
        competition has become the determining market principle – apart from renewables which are
        supported by state subsidies. Unlike the grid business, which is subject to state regulation as a
        natural monopoly, market prices for conventional power generation are directed by supply and
        demand only.
        Since the opening of national markets in 1998, liquidity in electricity trading has grown con‐
        tinuously all over Europe.
        Germany’s electricity trading market, with a churn rate of about ten, is the most liquid electricity‐
        trading platform in Europe. (Churn rate refers to the ratio between trading volume and physical
        consumption.) The reasons are the size of the market and the heterogeneity of the market actors,
        along with Germany’s geographic location as a European hub, and ever greater transparency.
        Europe has about 12 power exchanges. The most important trading centres for Central Western
        Europe are the Leipzig‐based European Energy Exchange (EEX) and the French exchange
        Powernext, based in Paris. German and French futures trade in electricity is bundled in EEX Power
        Derivates, a majority‐owned EEX subsidiary registered in Leipzig. Being Europe’s most liquid
        electricity wholesale market, the German wholesale market serves as crucial reference: the base‐
        load contract for the following year has further extended its role as benchmark contract for
        electricity in continental Europe.
        In addition to a liquid futures market, there is also a liquid spot market for electricity in
        continental Europe. The French Powernext exchange and the European Energy Exchange in
        Leipzig have bundled their electricity spot market activities for Germany and France and
        combined them in a cross‐border joint venture called European Power Exchange (EPEX Spot)
        based in Paris. EPEX Spot operates the short‐term power exchange trade in Germany, France,
        Austria and Switzerland. It thus forms the core of the spot market in the Central Western Europe
        region.
        Besides trading via the various European exchanges, the trading activities in the electricity area
        mainly take place on off‐market trading platforms, known as over‐the‐counter (OTC) platforms.
        Since liberalisation, trading volumes in the various EU countries have grown. However, marked
        differences in trends have emerged, these being due, inter alia, to decisions on the necessary
        regulatory conditions.
        Price formation on the wholesale electricity market follows the merit order principle. In Central
        Western Europe, the generation capacities installed there are in direct competition with one
        another. Dispatch of power plants depends on the Central Western European merit order and on
        demand.
The Impact of Global Coal Supply on Worldwide Electricity Prices
The merit order of the existing power plants is determined by the level of the variable costs of the
various plants. Since the variable costs of renewable energy sources – apart from biomass – are
virtually zero (wind and sun) or relatively low (water), their supply is at the very left in the merit
order. Furthermore, renewables are prioritised in electricity feed‐in that is guaranteed by statute.
After the renewable energies – at current fuel and CO2 prices – the still available nuclear power
stations and lignite power plants supply electricity according to the most favourable conditions, Page | 17
followed by plants based on hard coal. Gas has the highest variable costs at the moment
(Figure 2). Only in exceptional situations are oil‐based power plants still dispatched to cover
general electricity demand. This holds true for nearly all EU member states.
Figure 1 • Wholesale market places for electricity and energy products in Europe 2013
Source: EEX, 2013.
Figure 2 • Northwestern European merit order that decides the power plant dispatch
EUR/ MWh
Germany Belgium
France Switzerland
Austria Netherlands
Installed renewable capacity Lignite
Feed-in fluctuating as a function of supply (LG)
Other Nuclear (NC)
Hydro Wind PV REN BK NC LG Hard coal Gas/ Oil
Technology
Country
GW
Source: RWE analysis, 2013.The Impact of Global Coal Supply on Worldwide Electricity Prices
Prices form at the point of intersection of the resulting supply curve and the demand curve. This
guarantees an efficient dispatch of the power station fleet, since total generation costs are
minimised in any load situation. The market clearing price reflects the variable costs of the last
power plant just needed to cover the demand concerned (marginal plant). The market price thus
formed is paid to all power plant operators which have supplied electricity quantities below this
Page |18
price, irrespective of the level of the variable costs of the power station concerned. Thus, there is
only one electricity price at the wholesale level.
The margins between the wholesale price and the variable generation costs of the various power
stations are needed to cover the fixed costs for operation and maintenance and to compensate
for the cost of capital.
Since 2005, power plants, but also the plants of industry, have been subject to the Emissions
Trading cheme (ETS) which is regulated EU‐wide. For the plants that are subject to the ETS, the
CO2 emission caps are binding for the period up to 2020. The prescribed reduction after 2012
follows a path that provides for an annual 1.74% reduction in CO2 emissions until 2020. This will
achieve the 21% fall in CO2 emissions aimed at by 2020, compared with 2005, for the plants that
are subject to the ETS.
The economic crisis in Europe in particular together with the heavily subsidized expansion of
renewables has significantly dampened the demand for CO2 emission certificates. Whereas
between mid‐2005 and mid‐2008, CO2 prices of up to EUR 30/t were achieved in places,
quotations have weakened since then. Most recently (16 December 2013), they stood at a mere
EUR 5/t CO2.
The European Union is evaluating options to the ETS. This may be done via a short‐term supply
adjustment to raise the price of allowances (so‐called backloading) and may go as far as a
structural reform to the trading system.
The prices for CO2 certificates are a component of the variable costs of fossil‐fired power plants.
Depending on the level of the fuel and CO2 costs, they can change power stations’ dispatch merit
order. In view of relatively high gas prices in Europe and the low CO2 prices, the CO2 ETS is at
present not triggering a fuel switch from coal to gas. In fact, gas power plants are at the very right
in the merit order.
An analysis for Germany shows the following utilisation of hard coal and gas‐fired power plants in
2012. The data per fuel class vary owing to a plant’s age and efficiency:
lignite: approximately 80% to 95%,
hard coal: approximately 50% to 80%,
natural gas: up to approximately 20%.
The utilisation of the plants follows directly from their position in the merit order. The higher
their variable generation costs, the fewer hours they are demanded by the market. In the United
Kingdom, coal plants have operated in mid‐merit for several years, with load factors typically
around 40%, but coal load factors have increased more recently as a result of higher gas prices. In
the future they will be increasingly constrained by Industrial Emissions Directive requirements
and by the UK government’s carbon floor price (which is essentially a carbon tax).
In the hours in which gas capacities are needed to cover electricity demand, the short‐term
generation costs of these plants determine the level of the electricity prices in exchange
wholesale trade. In 2012, therefore, for about 20% of all traded hours, electricity prices were set
by gas‐fired power stations. This share has fallen from roughly 50% in recent years. The reason for
this is the strong expansion of renewables, which has meant that – where the share of wind and
solar is high – the existing gas‐fired power plants as well as sections of the hard coal portfolio areYou can also read