The Influence of Atmospheric Rivers over the South Atlantic on Winter Rainfall in South Africa - IDLCC
←
→
Page content transcription
If your browser does not render page correctly, please read the page content below
JANUARY 2018                                                BLAMEY ET AL.                                                                      127

                    The Influence of Atmospheric Rivers over the South Atlantic on
                                    Winter Rainfall in South Africa

                                                               R. C. BLAMEY
                            Department of Oceanography, University of Cape Town, Rondebosch, South Africa

                                           A. M. RAMOS, R. M. TRIGO, AND R. TOMÉ
                           Instituto Dom Luiz, Faculdade de Ci^
                                                              encias, Universidade de Lisboa, Lisbon, Portugal

                                                              C. J. C. REASON
                            Department of Oceanography, University of Cape Town, Rondebosch, South Africa

                                      (Manuscript received 15 June 2017, in final form 6 October 2017)

                                                                  ABSTRACT

                  A climatology of atmospheric rivers (ARs) impinging on the west coast of South Africa (298–34.58S) during
               the austral winter months (April–September) was developed for the period 1979–2014 using an automated
               detection algorithm and two reanalysis products as input. The two products show relatively good agreement,
               with 10–15 persistent ARs (lasting 18 h or longer) occurring on average per winter and nearly two-thirds of
               these systems occurring poleward of 358S. The relationship between persistent AR activity and winter rainfall
               is demonstrated using South African Weather Service rainfall data. Most stations positioned in areas of high
               topography contained the highest percentage of rainfall contributed by persistent ARs, whereas stations
               downwind, to the east of the major topographic barriers, had the lowest contributions. Extreme rainfall days
               in the region are also ranked by their magnitude and spatial extent. The results suggest that although per-
               sistent ARs are important contributors to heavy rainfall events, they are not necessarily a prerequisite. It is
               found that around 70% of the top 50 daily winter rainfall extremes in South Africa were in some way linked to
               ARs (both persistent and nonpersistent). Overall, the findings of this study support similar investigations on
               ARs in the North Atlantic and North Pacific.

1. Introduction                                                            Town is completely reliant on the winter rainfall as a
                                                                           primary water source, both for drinking and for the
   The southwest region of South Africa is the only part
                                                                           treatment of sewerage and wastewater. The main water
of the country that receives most of its rainfall during the
                                                                           supply is stored in numerous dams within the Cape Fold
austral winter months (May–September). It is an ex-
                                                                           Mountains located to the east of the city (see Fig. 1).
tremely heterogeneous climate region, with areas rang-
                                                                           These mountains can be described as ‘‘water towers’’
ing from semiarid to relatively wet on the windward
                                                                           (Liniger et al. 1998; Messerli et al. 2004). They contrib-
slopes of the mountains. This heterogeneity is due to a
                                                                           ute considerably to the total local discharge and are one
number of factors, such as its geographic location, the
                                                                           of the key water sources for South Africa (WWF 2013).
complex topography that extends across large stretches
                                                                             Poor winter rainfall can often have dire consequences
of the region, and the neighboring cold, upwelled waters
                                                                           for Cape Town and the surrounding areas, particularly
along the west coast with warmer waters along the
                                                                           when it occurs over successive years and results in severe
southern coast (Agulhas Current). Located within this
                                                                           water restrictions being put in place (e.g., 2003–04 and
region is the city of Cape Town, the second-largest
                                                                           2015–17). Despite the importance of the winter rainfall
metropolitan municipality in South Africa, with around
                                                                           to the local population and the economy (e.g., agricul-
3.7 million inhabitants (based on a 2011 census). Cape
                                                                           ture), relatively little is understood regarding the main
                                                                           drivers/processes behind the interannual variability,
  Corresponding author: Ross Blamey, ross.blamey@uct.ac.za                 compared to those behind the summer rainfall region of

DOI: 10.1175/JHM-D-17-0111.1
Ó 2018 American Meteorological Society. For information regarding reuse of this content and general copyright information, consult the AMS Copyright
Policy (www.ametsoc.org/PUBSReuseLicenses).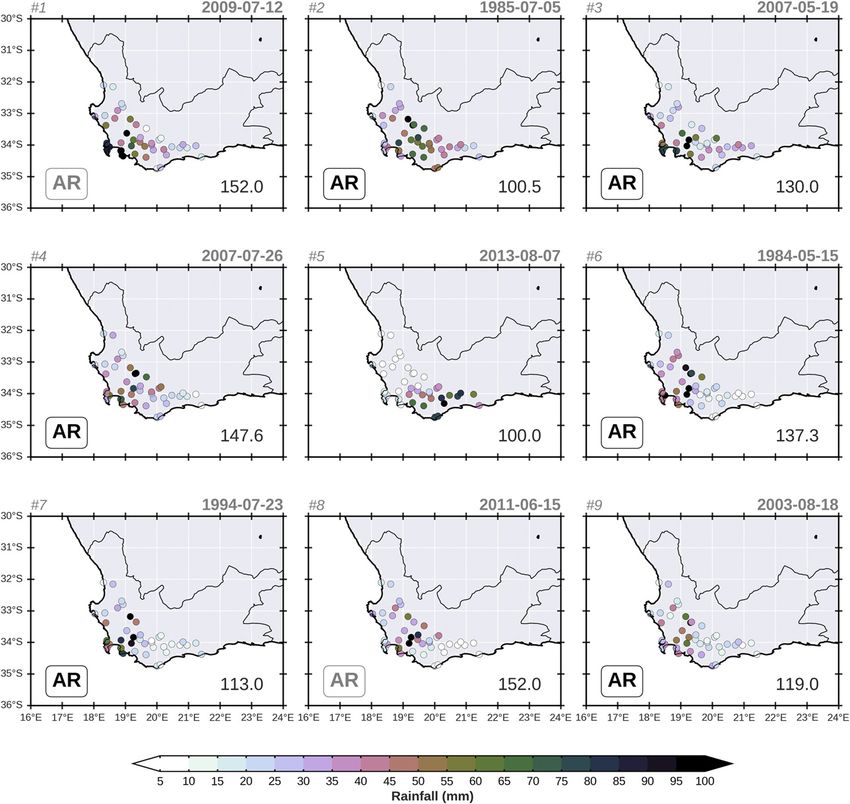
128                                  JOURNAL OF HYDROMETEOROLOGY                                                      VOLUME 19

                     FIG. 1. Topography (gray shading; m MSL) of the west coast of South Africa, location of
                   SAWS stations (magenta/purple dots), and the spatial distribution of the three key river basins
                   (color shading) within the Western Cape province of South Africa. Only stations that fall within
                   the Great Berg and Breede River basins are used in the analysis (denoted by larger circles).

the country. There is also limited information regarding            Reason et al. 2002; Reason and Jagadheesha 2005) have
the nature of regional extreme rainfall events, which can           also been identified as features influencing local rainfall
cause significant damage and sometimes loss of life.                patterns, and intraseasonal teleconnections with convec-
Midgley et al. (2007) estimated that a series of extreme            tion over South America may exist as well (Grimm and
rainfall events in the winter rainfall region during 2003–07        Reason 2015). However, a comprehensive understanding
resulted in damage of an accumulated value of around                of the drivers behind the winter rainfall remains elusive,
$100 million.                                                       and thus, improving the predictability of the local winter
   Winter rainfall in South Africa is typically produced            rainfall is a significant scientific challenge.
via cold fronts and associated extratropical cyclones,                 An important question not hitherto investigated for
while other westerly disturbances, such as cutoff lows,             South Africa is whether atmospheric rivers (ARs) can
may occasionally also produce considerable rainfall over            make a significant contribution to rainfall, particularly to
the region (e.g., Singleton and Reason 2007a,b). In-                heavy rainfall events. Over the past decade, increasing
terannual variability in the winter rainfall has been               attention has been paid to the important role ARs play in
linked to numerous large-scale modes of variability,                the water cycle, particularly in the midlatitudes. Trans-
which include El Niño–Southern Oscillation (Philippon               port of water vapor from the tropics to the midlatitudes is
et al. 2012) and the southern annular mode (Reason and              generally confined to four or five narrow regions around
Rouault 2005). Regional anomalies in Antarctic sea ice              the world (Zhu and Newell 1998). Though these few
extent (Blamey and Reason 2007) and sea surface                     narrow corridors only take up 10% of the circumference
temperature in the South Atlantic (Reason 1998;                     of the Earth at that latitude, they are thought to channel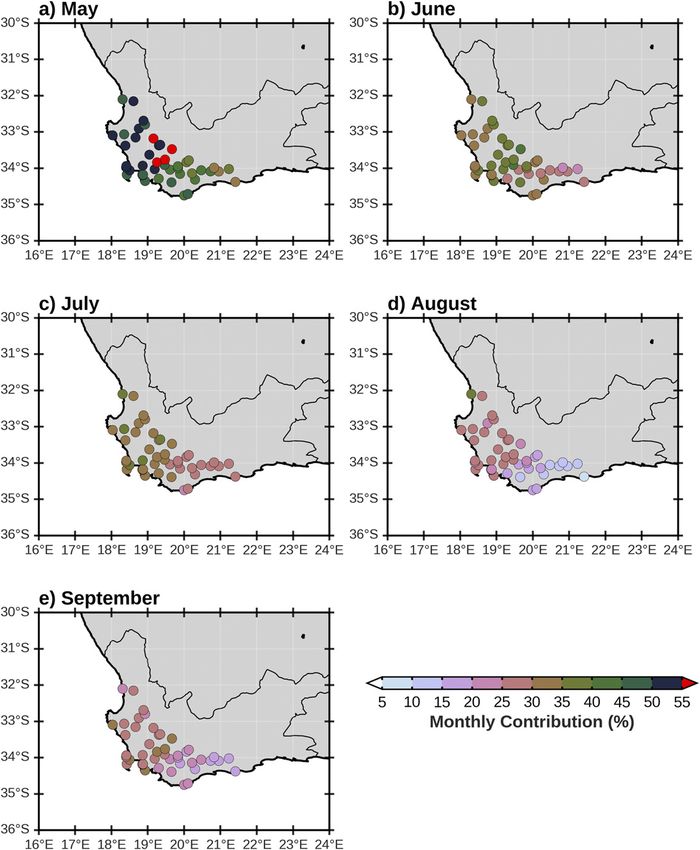
JANUARY 2018                                      BLAMEY ET AL.                                                        129

around 90% of the total volume of water vapor poleward         not limited to the United States; cases have also been
(Zhu and Newell 1998). These corridors are composed of         documented in Great Britain (Lavers et al. 2011, 2012),
filamentary bands of intense, vertically integrated water      along the west coast of continental Europe (Lavers et al.
vapor transport, commonly referred to as ARs (Newell           2013; Ramos et al. 2015), in East Asia (Hirota et al.
et al. 1992; Zhu and Newell 1998).                             2016), and in South America (Viale and Nuñez 2011). A
   ARs appear to be dynamically linked with the devel-         number of historical extreme floods on the Iberian
opment and movement of extratropical cyclones, with            Peninsula have been linked with well-defined ARs over
most of the moisture flux confined to the lower atmosphere     the North Atlantic Ocean, including the record 1909
and aligned along or ahead of cold fronts associated with      flood of the Duero River (Pereira et al. 2016).
extratropical cyclones (Ralph et al. 2004). Thus, climato-        The importance of ARs is probably more evident
logically, there are generally more ARs during the winter      from their contribution to overall rainfall totals. In
months compared to the summer months because of the            North America, it has been found that ARs contribute
strong association between ARs and midlatitude/extra-          anywhere between 20% and 45% of the rainfall in
tropical cyclones (Gimeno et al. 2014). However, there         central and Northern California, even rising closer to
is still debate over how these rivers or narrow corridors      50% in some years (Dettinger et al. 2011). It is not just
of high water vapor form, with some research asserting         the west coast of North America that benefits from AR
that high water vapor content is achieved through direct       related rainfall; Lavers and Villarini (2015) found that
moisture transport from the tropics (Ralph et al. 2004;        ARs can produce similar contributions in parts of the
Wick et al. 2013; Neiman et al. 2013; Rutz et al. 2014).       central United States. These results are, however, month
Alternatively, results by Bao et al. (2006) and Dacre et al.   dependent, with greater contributions often taking place
(2015) indicate that ARs are not necessarily fed by long-      during the winter period. Similar results are documented
distance moisture transport from the tropics/subtropics (as    for western Europe, with ARs contributing between
implied by the word ‘‘river’’), but are rather the result of   20% and 30% of all rainfall (Lavers and Villarini 2015).
local sources of water vapor exported from extratropical       However, little research on ARs and their influence on
cyclones as they travel poleward. Ramos et al. (2016) show,    regional rainfall patterns has been done outside the
through a Lagrangian analysis of the main moisture sour-       North Pacific or North Atlantic domains.
ces of the ARs that make landfall on the western European         The objectives of this study are twofold: 1) to provide
coast, that the anomalous moisture linked with the ARs         some insight into the location and frequency of ARs in a
comes mainly from subtropical areas and, to a lesser ex-       relatively poorly studied region (the South Atlantic) and
tent, from the midlatitudes. A small anomalous moisture        2) to better understand the role that such phenomena
source was also identified from within the tropics.            play in winter rainfall, including extreme rainfall events,
   Although there is some debate about the formation of        across the winter rainfall region of South Africa (see
ARs, there is mounting evidence that these features play       Fig. 1 for location). Annual rainfall totals within south-
an important role in heavy rainfall events in midlatitude      west South Africa could potentially be dependent on not
regions, such as western North America (e.g., Ralph            only the number of frontal systems per winter, but also
et al. 2006; Dettinger et al. 2011; Warner et al. 2012) and    on the intensity of the systems. Thus, a few large frontal
the central United States (e.g., Moore et al. 2012). A         events, fueled by ARs, could have a considerable impact
global overview of the preferred location of ARs and           on winter season rainfall totals and on the number of
their associated landfall frequency is provided by             heavy rainfall events. Understanding the sources of
Gimeno et al. (2016). Given the strong water vapor             moisture for winter rainfall and the mechanisms through
content and low static stability, ARs have the potential       which it is transported into the region will not only assist
to produce heavy rainfall, particularly in regions with        in improving seasonal weather forecasting, but may also
strong topography (Neiman et al. 2002; Ralph et al.            provide much-needed information on the frequency and
2004; Rutz et al. 2014). Over the 1998–2005 period,            magnitude of extreme rainfall and flood events. This
nearly every major flooding event of the Russian River         would ultimately benefit regional water management
in California was associated with an AR (Ralph et al.          and local disaster mitigation activities.
2006; Ralph and Dettinger 2012). Dettinger et al. (2011)
advocate that extreme rainfall events (3-day rainfall
totals exceeding 40 cm) associated with landfalling ARs        2. Data and methodology
in California are historically comparable, in magnitude
                                                               a. AR data sources
and frequency, to regions in the southeastern United
States associated with landfalling hurricanes and tropi-         Depending on the application, ARs are typically
cal storms. Extreme rainfall events linked to ARs are          identified by integrated water vapor (IWV) thresholds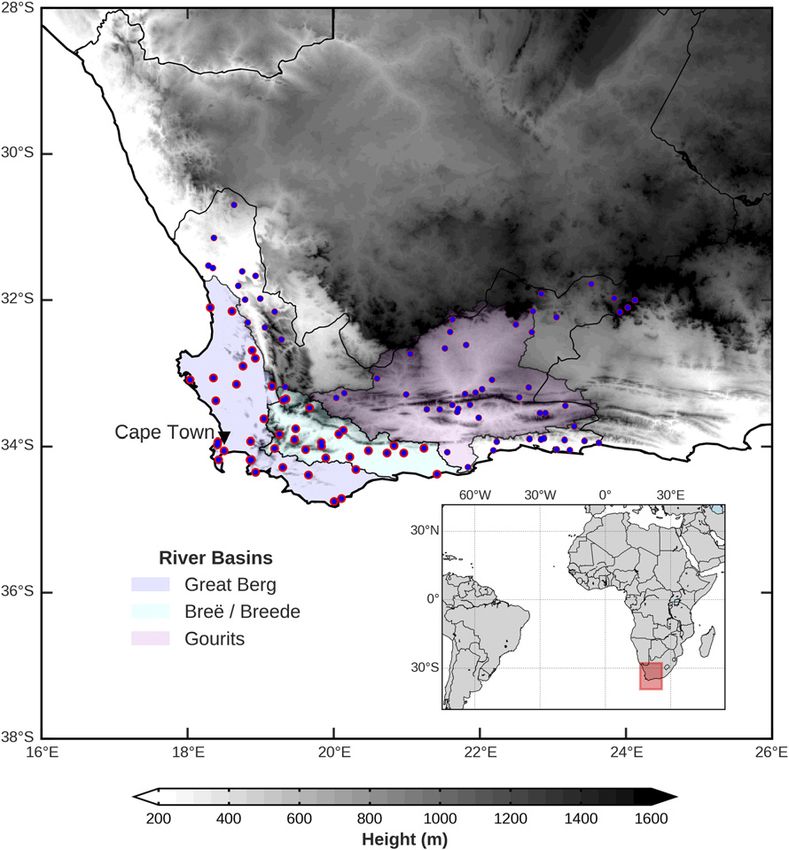
130 JOURNAL OF HYDROMETEOROLOGY VOLUME 19
in satellite imagery, such as that provided by the Special 2011). ERAI is one of the reanalysis products that as-
Sensor Microwave Imager (SSM/I) (e.g., Neiman et al. similates data from the SSM/I water vapor channel
2008; Wick et al. 2013). However, a limitation of this (since 1987) (Dee et al. 2011) and has already been used
particular data source is that it does not contain in- in AR investigations in other regions, such as the North
formation about vertical wind profiles, and thus, it is Pacific (e.g., Rutz et al. 2014) and North Atlantic (e.g.,
unable to quantify actual water vapor transport. Instead, Lavers and Villarini 2015). The use of a high-resolution
it can only indicate the presence of water vapor con- reanalysis product is an obvious choice, given the fine
centrations. Furthermore, gaps in the satellite swaths filament structure of ARs, and thus assists in the auto-
can hamper any automated AR identification pro- mated approach for identification and tracking. Al-
cedure. Because of limitations in satellite data, other though the earlier version of the NCEP reanalysis
studies have used integrated water vapor transport (NCEP–NCAR; Kalnay et al. 1996) is available for a
(IVT) from reanalysis products for AR identification longer period (1948–present), it is not used because
(e.g., Lavers et al. 2012; Rutz et al. 2014; Ramos et al. of inhomogeneities in the data in the Southern
2015). The primary advantage of using IVT is that it Hemisphere prior to 1979 (Kanamitsu et al. 2002;
is more representative of the key characteristic (i.e., Tennant 2004).
moisture transport) of ARs. Another argument for using
IVT is that it is strongly related to precipitation over b. AR identification method
complex terrain (Junker et al. 2008; Ralph et al. 2013),
and it captures the penetration of ARs farther inland ARs have typically been defined or identified as
(Rutz et al. 2014). plumes of moisture that are greater than 2000 km in
The AR detection methodology used by Lavers et al. length and less than 1000 km in width and contain an
(2012) and Ramos et al. (2015), discussed in the sub- IWV content exceeding 20 mm (Ralph et al. 2004;
sequent section, is applied here to two different reanalysis Neiman et al. 2008; Dettinger et al. 2011). When com-
datasets, namely, the European Centre for Medium- pared to IWV, a single IVT threshold value for AR
Range Weather Forecast (ECMWF) interim reanalysis identification is not as well defined or widely used in the
(ERA-Interim, hereafter ERAI) data (Dee et al. 2011) literature. Lavers et al. (2012) established a varying IVT
and the National Centers for Environmental Prediction threshold value through the use of percentiles in order to
(NCEP)–Department of Energy (DOE) Second Atmo- accommodate the various IVT distributions obtained
spheric Model Intercomparison Project (AMIP-II) re- over distinct pairs of latitude and longitude. This
analysis (hereafter NCEP-2) (Kanamitsu et al. 2002). method results in different IVT thresholds being set for
ERAI and NCEP-2 are both available at 6-hourly time different regions around the world and for different re-
steps, centered on synoptic times (0000, 0600, 1200, and analysis datasets. A similar approach is adopted in this
1800 UTC) from 1979 to 2014. However, ERAI is pro- study. The IVT is calculated from 1000 to 300 hPa in an
vided at a relatively high resolution of 0.758, while NCEP- Eulerian framework (e.g., Neiman et al. 2008; Lavers
2 has a lower horizontal resolution of 2.58. The variables et al. 2012) as
retrieved for both reanalyses were the specific humidity
sffiffiffiffiffiffiffiffiffiffiffiffiffiffiffiffiffiffiffiffiffiffiffiffiffiffiffiffiffiffiffiffiffiffiffiffiffiffiffiffiffiffiffiffiffiffiffiffiffiffiffiffiffiffiffiffiffiffiffiffiffiffiffiffiffiffiffiffiffiffiffiffiffiffiffiffiffiffiffiffiffiffiffiffiffiffi
q and zonal u and meridional y winds at 1000, 925, 850, ð 300 hPa 2 ð 300 hPa 2
1 1
700, 600, 500, 400, and 300 hPa. Only data covering IVT 5 qu dp 1 qy dp ,
the austral winter months (April–September) are used g 1000 hPa g 1000 hPa
here. One of the advantages of using reanalysis products,
where q is the layer-averaged specific humidity (kg kg21);
rather than just a satellite product, is that they use data
u and y are the layer-averaged zonal and meridional
assimilation of observations to produce the best avail-
winds (m s21), respectively; g is the acceleration due to
able three-dimensional dynamical representation of the
gravity; and dp is the pressure difference between two
atmosphere.
adjacent pressure levels.
It has been recognized that the choice of reanalysis
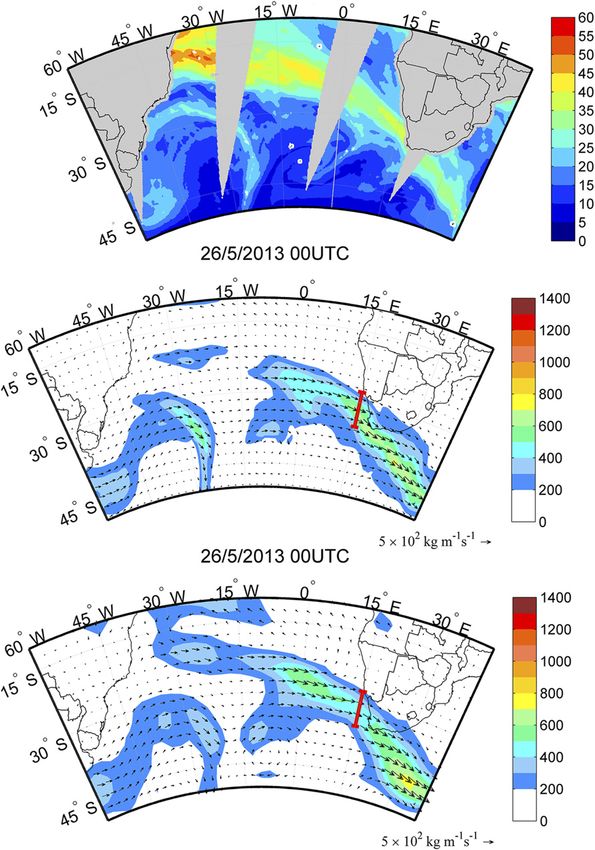
The focus of this study is on ARs making landfall
product and identification method used can influence
along the west coast of South Africa (see Fig. 2 for an
the number of ARs identified in a given period (e.g.,
example). Using the ERAI and NCEP-2 reanalysis data,
Lavers et al. 2012). Apart from differences in grid
ARs were identified based on the following steps:
resolutions, this potential bias could partly be due to
differences in reanalysis production methods (i.e., data- 1) Based on the work of Lavers et al. (2012), the 85th-
assimilating models used and the type of observations percentile threshold of the maximum IVT was
that are incorporated), which can lead to variations in computed between 27.758 and 35.258S (27.58–
the reanalyses (Rienecker et al. 2011; Trenberth et al. 35.08S), along the reference meridian at 158E, in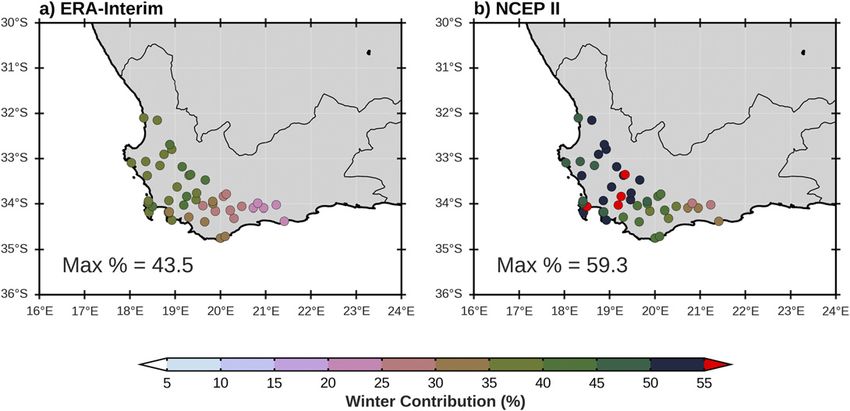
JANUARY 2018                                        BLAMEY ET AL.                                                    131

                   FIG. 2. An example of an AR impacting South Africa on 26 May 2013 in (top) SSM/I satellite
                 data (morning passes), illustrating the IWV over the South Atlantic; (middle) the same AR
                 event, but as seen using the IVT direction (vectors) and intensity (kg m21 s21; color shading) at
                 0000 UTC 26 May 2013 obtained from ERAI; and (bottom) as in the middle panel, but for
                 NCEP-2 data. The reference meridian at 158E (in red) used in the identification method is also
                 shown in the middle and bottom panels.

    ERAI (NCEP-2). This was calculated using the                        (NCEP-2). If the value exceeded the threshold in
    1200 UTC data for each day from 1979 to 2014. For                   the previous step, the grid point was flagged.
    ERAI, the threshold value was 327 kg m21 s21,                     3) A backward/forward search was performed to
    while for NCEP-2, it was 321 kg m21 s21.                            identify the maximum IVT at each longitude, with
  2) For each 6-hourly time step in the reanalysis, the                 the location of the grid points that exceeded the
    maximum value in IVT was determined for the grid                    IVT threshold (derived in step 1) being tracked.
    points between 27.758and 35.258S (27.58–35.08S),                  4) The final step was to determine if the values
    along the 158E reference meridian in ERAI                           exceeding the threshold extended over many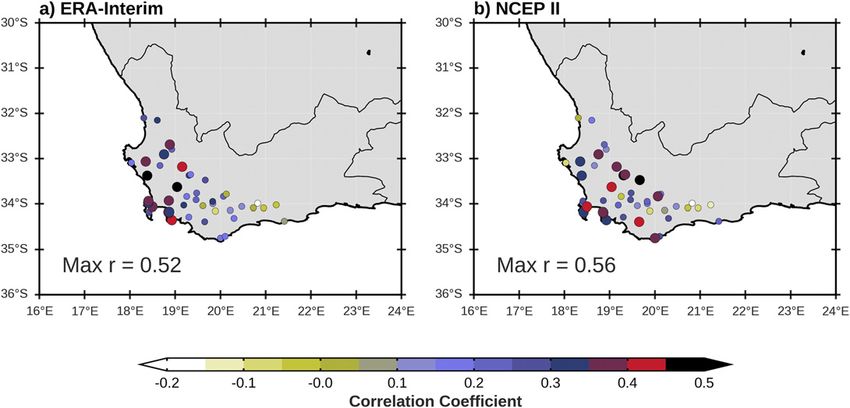
132                                JOURNAL OF HYDROMETEOROLOGY                                                   VOLUME 19

      degrees longitude in order to classify it as an AR.      However, instead of being based on the normalized de-
      Taking into account that the length of a degree at       parture for each day at each station, as in the original
      358S is approximately 690 km and the resolution of       method, the 95th-percentile threshold value is used for
      the reanalysis data, it was determined that 27 con-      each Julian day. The primary reason for using this
      tiguous points (27 3 0.758 5 20.258 5 61823 km) in       percentile-based method instead of the normalization
      ERAI and 8 in NCEP-2 (8 3 2.58 5 20 5 61800 km)          procedure applied by Ramos et al. (2014) is that the latter
      exceeding the threshold would satisfy the length         does not ensure a typical Gaussian distribution at each
      criteria of an AR. This condition was checked every      station. Therefore, for each station and each Julian day, the
      6 h, with it being considered an AR time step when       95th-percentile value was determined, taken over the ref-
      it was fulfilled.                                        erence period 1979–2014. Only days with rainfall exceed-
                                                               ing 1 mm were taken into account. A 7-day running mean
From the output above, ARs were further classified as
                                                               was then applied to smooth the 95th-percentile threshold
being either persistent or nonpersistent, with the former
                                                               climatological time series. Ramos et al. (2014) note that the
simply referring to ARs that contained at least three
                                                               length of the smoothing filter (e.g., 7 vs 21 days) does not
uninterrupted time steps or 18 h of persistence (Lavers
                                                               significantly alter the ranking of the days. An anomaly
et al. 2012; Lavers and Villarini 2013; Ramos et al. 2015).
                                                               value was then calculated by subtracting the rainfall of
A persistent AR was counted as distinct from another
                                                               each day from this daily climatological 95th-percentile
persistent AR if it was separated by more than a day or
                                                               threshold. A new value R was computed, which is the
four time steps. Only persistent ARs are included in the
                                                               magnitude/extent of the event and is obtained by
climatological aspects of the analysis here, while non-
persistent ARs are included in the extreme event                 1) determining the percentage of stations that contained
analysis.                                                          a positive anomaly value on each given day (hereafter
                                                                   N and in %);
c. Attribution of winter rainfall and daily extreme              2) the mean value of anomalies across the stations that
   events to ARs                                                   contained a positive value (hereafter M and in
                                                                   mm); and
  Daily rainfall data over South Africa were provided
                                                                 3) the extent and magnitude of the extreme R is
by the South African Weather Service (SAWS) for the
                                                                   determined by multiplying N 3 M (the higher the R
period from May 1979 to September 2014. Although
                                                                   value, the more extreme the daily event). The
there are numerous stations (;500) across the region,
                                                                   highest value of R then corresponds to the first
with some extending back as early as 1850 and con-
                                                                   day in the extreme ranking.
taining data through the end of 2015, not all have a full
record of data. Thus, only stations that passed quality        This method was applied to all the stations within the
control tests (after Durre et al. 2010) and those with less    domain over the southwestern part of South Africa. It
than 5% missing data (i.e., 95% valid data available)          should be noted that this method does not take into
during the main winter months (May–September) for              account if actual flooding occurred with the extreme
the period 1979–2014 are used (note that the month of          rainfall day identified. This is because other factors, such
April is excluded here for lack of data availability).         as antecedent rainfall or topography of the basin, are not
Furthermore, only stations that fell within the two local      considered here.
key river basins in the southwestern part of the country
were considered. As a result, only 45 stations were re-
                                                               3. South Atlantic AR climatology
tained for the analysis (see Fig. 1 for locations). The
contribution of ARs to the winter rainfall was de-               Over the 36-yr period in ERAI data, a total of 367
termined by adding up the rainfall at each station on the      persistent ARs were identified as crossing 158E between
day and the day following the occurrence of a persistent       27.758 and 35.258S during the winter months, which
AR being identified off the west coast of South Africa.        corresponds to a mean of 10.2 events per winter (stan-
A similar approach has been used along the west coast of       dard deviation of 3.14). In comparison, in NCEP-2 data
North America (e.g., Rutz and Steenburgh 2012). The            over the same period, a total of 526 persistent ARs were
contribution to monthly and winter totals is then cal-         identified, with an average of 14.6 per winter (standard
culated based on the daily data associated with the ARs.       deviation of 3.92). The difference between these two
  The ranking of daily extremes is based on a method that      reanalysis products could be predominantly ascribed to
has been adapted from Ramos et al. (2014). It is used to       1) the different IVT threshold values used for each re-
characterize and rank each winter day, taking into account     analysis, 2) the different native grid resolutions, or 3) the
the severity of the rainfall anomaly and its spatial extent.   different assimilation methods used by the different
JANUARY 2018 BLAMEY ET AL. 133
FIG. 3. Interannual variability in the number of persistent ARs identified off the west coast of
South Africa during the winter months (April–September) for 1979–2014 in ERAI (black line)
and NCEP-2 (light gray line). The winter mean for each reanalysis is given in the top-right
corner. The black and gray dashed lines are the 7-yr running means for ERAI and NCEP-2,
respectively.
models to create the reanalyses (Lavers et al. 2012; duration (from first to last time step in identification) of
Ramos et al. 2015). These values are comparable to these features is just over 30 h in both NCEP-2 and
those identified in the North Atlantic, making landfall ERAI. The range of these duration statistics falls within
in Great Britain (Lavers et al. 2012) or over the Iberian that documented elsewhere, such as ARs penetrating
Peninsula (Ramos et al. 2015). In the North Pacific, the Iberian Peninsula (Ramos et al. 2015) and California
Neiman et al. (2008) document that in California, an (Ralph et al. 2013). It is worth noting that there were 352
average of 15 events per year are recorded; however, (536) cases in the ERAI (NCEP-2) reanalysis in which
this is based on all seasons, a shorter study period an AR was identified as satisfying the IVT and length
(1998–2005), and using SSM/I data. Apart from the thresholds, but failed in terms of persistence (i.e., had
total number of ARs found in each reanalysis, there is fewer than three time steps) and was therefore not in-
relatively good agreement in terms of interannual cluded in this section for analysis.
variability between the two datasets (Fig. 3). The In terms of maximum IVT values during the life cycle
Pearson correlation coefficient between the two is 0.67 of persistent ARs, around 75% of the systems contain a
(p value , 0.005). The minimum number of AR events maximum IVT of between 400 and 650 kg m21 s21 in
recorded for a winter season is 3 (5), while the maxi- NCEP-2, while in ERAI, only around 60% are binned in
mum is 17 (26) in the ERAI (NCEP-2) data (not nec- that range (Fig. 5b). Conversely, a higher percentage of
essarily the same year). systems in the ERAI data have a maximum IVT ex-
AR activity tends to peak early in the winter season ceeding 650 kg m21 s21 than those found in NCEP-2. A
(May) and slowly decreases throughout the winter very similar spread in IVT is found at the initial maxi-
(Fig. 4). This cycle is more distinct in the ERAI data mum as the system passes 158E (not shown). At the
compared to NCEP-2, with the latter showing similar initial identification stage of the ARs along 158E, the
AR activity in June and July to that in May. The early maximum IVT value in the majority of the events is
winter peak found here is marginally earlier than that located in the southernmost grid point at 35.258S in
found in ARs in the North Atlantic, which tend to ERAI (not shown). This spatial pattern is also found in
peak in activity during December (Ramos et al. 2015). the maximum IVT during the entire life cycle of an AR
The month of May also has the largest range in AR in ERAI, with ;65% of the events having a maximum
activity in the South Atlantic (0–7 events) in ERAI, IVT at the southernmost grid point (Fig. 5c). The lower-
whereas in NCEP-2, June is found to have the largest resolution NCEP-2 reanalysis reveals that an almost
range (0–8 events). equal number of ARs occur at the grid points located at
Just over half (;54%) of the persistent ARs identified 32.58S as compared with 358S (not shown). The analysis
in NCEP-2 in the South Atlantic tend to have a duration also reveals that very few persistent ARs were identified
of fewer than 30 h (Fig. 5a), with a similar percentage equatorward of 308S in both reanalysis datasets, with
found in ERAI (;55%). Around 30% of the ARs per- only 11 ARs in ERAI and 19 in NCEP-2 over the full
sist longer than 1.5 days (36 h) in NCEP-2, with a similar period (not shown). Given the close links between ARs
percentage found in ERAI. Overall, the average and extratropical disturbances (e.g., Cordeira et al. 2013;134 JOURNAL OF HYDROMETEOROLOGY VOLUME 19
FIG. 4. (a) Intra-annual variability of the number of persistent ARs off the west coast of South Africa in the
ERAI (dark gray bars) and NCEP-2 (light gray bars) reanalyses. (b) Box plots illustrating the monthly mean and
range in AR activity in ERAI (dark gray box) and NCEP-2 (light gray box) reanalyses for the period 1979–2014.
The horizontal line in each box is the mean, while the vertical lines indicate the minimum and maximum number
of ARs.
Dacre et al. 2015; Ramos et al. 2015), it is likely that this ARs to total rainfall and in extreme rainfall events in
AR spatial pattern is linked to the extratropical cyclone South Africa, as discussed in the following section.
activity to the south of the country, with generally few
cold fronts impacting at lower latitudes on the west coast 4. AR contribution to winter rainfall
(298–34.58S) compared with the southern part of the
a. Winter rainfall totals
domain (e.g., Jones and Simmonds 1993; Hoskins and
Hodges 2005). Furthermore, the location of the South Rainfall in the southwest region of South Africa is
Atlantic subtropical high (SASH) could also play a key known to contain considerable interannual variability
role in fewer ARs impacting at lower latitudes on the (Fig. 6). The correlation coefficient between anomalous
west coast. During the early autumn months, the center AR activity and that of the standardized anomaly in
of SASH is typically located around 278–288S, but it winter rainfall is 0.43 (p value 5 0.008) in ERAI and
shifts equatorward during May and is positioned around 0.46 (p value 5 0.005) in NCEP-2. When broken down
248–258S during the winter months (Sun et al. 2017). Not to individual stations, a stronger relationship is evident.
only would this impact the location of ARs making The maximum correlation between anomalous AR ac-
landfall along the west coast, but it would also play a role tivity and standardized winter rainfall at an individual
on the overall seasonal cycle of ARs described earlier. station reaches 0.52 (0.56) in ERAI (NCEP-2), both
Figure 5c also highlights the influence that the loca- with p values , 0.05 (Fig. 7). In most cases, the stations
tion of the domain can have on the statistics of the AR with the strongest relationship with AR activity are lo-
climatology presented here. Although there is some cated in the mountainous regions, which include the
consistency in the data and methods adopted to build stations immediately surrounding Cape Town (Fig. 1 vs
this AR climatology, an additional factor to consider Fig. 7). The weakest correlation between station rainfall
when comparing ARs in the different ocean basins is the and AR activity is at stations located farther up the drier
domain used. As an example, Lavers et al. (2012) con- west coast or to the far east of the domain, where the
centrate on ARs that transect 48W in grid points be- moisture has been largely depleted after undergoing the
tween 508 and 608N, and Ramos et al. (2015) focus on foehn effect of the coastal mountains.
grid points centered along 108W between 358 and 458N, The relatively weak link between AR activity and
whereas a slightly smaller domain (27.58–35.258S) is used stations located in the eastern part of the domain is ev-
here. Therefore, considering the maximum location of ident when one breaks down the average contribution of
AR activity presented here is at the southernmost lati- ARs to total winter season rainfall (Fig. 8). The stations
tude of the domain (35.258S; Fig. 5c), it is likely that the in the east contain the lowest contribution in both re-
frequency (underestimation) and location of ARs in the analysis datasets (15%–25% in ERAI and 25%–40% in
South Atlantic are not completely represented. How- NCEP-2). The low contributions located at stations
ever, the main focus of this study is the contribution of farthest east could imply that most of the water vapor isJANUARY 2018 BLAMEY ET AL. 135
The influence that AR activity can have on rainfall at
the various stations is also evident on the monthly time
scale (Fig. 9). The highest average contribution is typi-
cally found during the early winter months (May and
June), when AR activity is most frequent (Fig. 4). In
May, more than half the rainfall at many stations oc-
curred on the day or the day after an AR made landfall
along the west coast (Fig. 9a). The lowest contribution,
on average, occurs in August (Fig. 9d), the month when
the fewest ARs occur off the west coast (Fig. 4). There is
again a difference in AR contribution to winter rainfall
between the two reanalysis products, which is likely
because of the number of ARs identified in both. Results
from NCEP-2 (not shown) suggest that ARs have a
greater influence on local rainfall, particularly during
May–July. Over 45% of the rainfall at many stations
located in the western part of the domain can be linked
to AR activity during the early winter months. ARs tend
to have less of an impact during the late winter months,
similar to that in the ERAI reanalysis. There is also a
very similar spatial pattern between the two reanalyses,
with stations located in the east having a much lower
AR-related rainfall contribution than that found in the
stations in the western part of the domain.
b. ARs and extreme events
The top nine extreme daily rainfall events determined
for the southwestern part of South Africa are presented
FIG. 5. (a) Distribution (%) of the duration (binned at 6-h in- in Fig. 10. Of these nine events, eight are in some way
tervals) of the persistent AR events in the 6-hourly reanalysis data, associated with an AR. This was determined by match-
with black lines representing ERAI and gray lines representing
NCEP-2. (b) As in (a), but for maximum IVT for each persistent
ing the days on which ARs were identified (both per-
AR (binned at 50 kg m21 s21 intervals). (c) The latitude (27.758– sistent and nonpersistent) in the reanalysis to those of
35.258S) at which the maximum IVT occurred in ERAI data only. the ranked extreme rainfall days found in the station
data, an approach similar to that undertaken for the
lost through rainfall as the AR passes over the moun- Iberian Peninsula (Ramos et al. 2015). It should be
tains to the west of these stations. A similar rain shadow noted that the only extreme event ranked in the top nine
process is argued as being one of the main factors that that is not linked with an AR is the fifth event on 7
determines rainfall contributions by ARs in the western August 2013. For this event, most of the heavy rainfall
United States (Rutz et al. 2014). took place in the southeastern part of the domain or the
The highest contributions in the southwest region of leeward side of the coastal mountains, which, as de-
South Africa during the winter season are typically scribed in the previous section, typically has the lowest
found at stations located in the mountain regions posi- association with AR activity in the region (e.g., Fig. 8).
tioned immediately to the east of Cape Town, which are The eight extreme events can be further classified:
directly impacted by rain-bearing westerly winds in this four of them (six in NCEP-2) are linked to a persistent
season. Average AR contributions at these stations AR in both reanalyses, while the remaining three (one in
typically exceed 40% (50%) of the total winter rainfall NCEP-2) contain no more than two time steps linked
in ERAI (NCEP-2); that is to say, depending on the with ARs (i.e., nonpersistent). There is some disagree-
reanalysis data used, over half the winter rainfall at some ment between the two reanalysis products, with events
stations occurred on the day or the day after an AR ranked 1 and 8 having an AR identified in only one of
made landfall along the west coast. It is worth noting the reanalysis datasets, whereas the rest have an AR in
that the overall higher percentage in NCEP-2 is likely both products. As described in section 3, each reanalysis
due to the higher number of ARs identified using that product does not necessarily capture the same AR
particular dataset (Fig. 3). event. This could be partly due to the different IVT136 JOURNAL OF HYDROMETEOROLOGY VOLUME 19
FIG. 6. Standardized anomaly of winter rainfall (May–September) across the weather sta-
tions within the domain for the period 1979–2014. The gray bars are the mean anomaly across
the stations, while the thin black horizontal line denotes the median anomaly. The solid black
and dashed gray lines are the standardized anomaly of winter ARs (only May–September) in
ERAI and NCEP-2, respectively. The Pearson correlation coefficient (p value) between the
rainfall and AR activity is highlighted in the bottom-left corner.
threshold used, or the different grid resolutions, which commonality for the South African domain could per-
as noted by Lavers et al. (2012), could account for lo- haps be obtained by using higher-resolution input data
cating ARs in slightly different areas. or through an increase in the number of AR-associated
Further analysis of the top 50 ranked events shows extreme rainfall cases once a longer record becomes
that 26 (36) extreme rainfall events can be linked to available.
persistent ARs (when including nonpersistent ARs) in
the ERAI data. In NCEP-2, the result is slightly differ-
5. Discussion and conclusions
ent, with 31 (34) of the top 50 extreme rainfall events
being linked to persistent (including nonpersistent) Based on the methodology developed by Lavers et al.
ARs. Thus, although persistent ARs are not necessarily (2012) and Lavers and Villarini (2013), a climatology of
a prerequisite for extreme daily rainfall in the region, the persistent ARs impinging on the west coast of South
majority of the top daily extreme events linked to ARs Africa during the austral winter months (April–
are associated with persistent ones. Overall, these re- September) was developed for the period 1979–2014.
sults regarding the contribution of ARs to extreme Input data for the identification are based on two re-
rainfall events in the southwestern region of South analysis products, namely, the relatively high-resolution
Africa are very similar to those documented elsewhere, ERAI and the lower-resolution NCEP-2. The findings
such as the Iberian Peninsula (Ramos et al. 2015). suggest that although ARs occur throughout the winter
However, when looking for clear fingerprints of AR months, they occur more frequently during the month of
characteristics or features that could be indicative of May (May–July) in ERAI (NCEP-2). On average, 10–15
extreme rainfall potential, no clear pattern emerges. The ARs occur through the winter period, but this number
ARs associated with the top 50 extreme daily rainfall varies significantly from year to year, as it can be as low
events identified here contain insufficient common as 3 or as high as 26. However, the AR climatological
characteristics in terms of duration, mean or maximum statistics are influenced by the input data, with the
IVT, or preferred latitude for straightforward classifi- number of ARs in ERAI being around 30% less overall
cation purposes. This may hamper the forecasting po- than that in NCEP-2. The lower number of ARs iden-
tential in the short term, although further research may tified in the higher-resolution ERAI was also noted by
provide new insights on these links between certain ARs Ramos et al. (2015) for ARs in the North Atlantic. The
and top rainfall events. For example, Hecht and influence the choice of reanalysis can have on AR
Cordeira (2017) have recently shown that certain fea- identification has previously been documented by
tures of ARs, such as orientation or intensity, can Lavers et al. (2012).
have a large influence on the precipitation patterns Compared to their Northern Hemisphere counter-
in the California Russian River watershed. Increased parts, ARs in the South Atlantic do not make landfall asJANUARY 2018 BLAMEY ET AL. 137
FIG. 7. Pearson correlation coefficient for the standardized anomaly of ARs per winter for the period 1979–2014
(see Fig. 6) in (a) ERAI and (b) NCEP-2, and the standardized anomaly of the total winter rainfall at each station.
Stations with a p value , 0.05 are represented by larger circles. The maximum correlation among all the stations is
given in the bottom-left corner.
frequently. This is not to say that fewer AR events occur Africa. Thus, it is likely that if the choice domain was
in the South Atlantic, but is rather related to the lat- extended farther poleward, more ARs would be ac-
itudinal extent of the continents. In many cases, the counted for in the South Atlantic than in the domain
plume of moisture passes to the south of the African presented here.
continent, which terminates at 348–358S (somewhat The findings here regarding the role ARs can play in
lower latitude than the Iberian Peninsula or the Russian the overall contribution to seasonal totals or to extreme
River region in California). This is supported by the rainfall events are comparable to those documented
maximum AR activity occurring at the grid point lo- elsewhere (e.g., Ralph et al. 2006; Dettinger et al. 2011;
cated most poleward in the predefined domain used Rutz and Steenburgh 2012; Lavers and Villarini 2015;
here, which was restricted to the west coast of South Ramos et al. 2015). Although there is some local
FIG. 8. Mean percentage of the total winter (May–September) precipitation at the SAWS weather stations oc-
curring on the day or day after a persistent AR is located off the west coast of South Africa in (a) ERAI and
(b) NCEP-2, over the period 1979–2014. The maximum contribution (%) is given in the bottom left corner of
the panel.138 JOURNAL OF HYDROMETEOROLOGY VOLUME 19
FIG. 9. Mean percentage of the total monthly precipitation at the SAWS weather stations occurring on the day or
day after a persistent AR is located off the west coast of South Africa in the ERAI data (1979–2014) only. The
month is given at the top-left corner of each panel.
variability regarding the influence of ARs on rainfall at located at stations farthest east, which suggests that most
the stations, there are some obvious patterns. Depend- of the water vapor is lost through rainfall as the AR
ing on the reanalysis product, ARs were found to con- passes over the mountains to the west of these stations,
tribute between 15% and 60% of the total winter rainfall so these stations are in a relative rain shadow. The
at stations across the southwestern region of South Af- highest average monthly contributions occur during the
rica. The highest winter season contributions are typi- early winter months (May and June), when ARs are
cally found at stations located in the mountain regions most frequent.
immediately to the east of Cape Town, closer to the In terms of extreme rainfall, around 70% of the top 50
South Atlantic coast. The lowest contributions are daily winter rainfall extremes in southwestern SouthJANUARY 2018 BLAMEY ET AL. 139 FIG. 10. The top nine extreme precipitation days for the southwestern tip of South Africa. The rank and day of the event are given in the top-left and top-right corners of each panel, respectively. The maximum amount of precipitation for that particular day is given in the bottom-right corner of each panel (mm). Events that are linked to an AR (including nonpersistent ARs) are denoted by the letters ‘‘AR’’ in the bottom-left corner; letters in gray signify the event is linked to an AR being identified in only one of the reanalysis products. Africa were linked in some way to ARs. If only persis- with local flooding because the methodology used does tent ARs were taken into consideration, this value drops not take into account other important factors, such as to just over 50% (closer to 60% in NCEP-2). This sug- antecedent rainfall (soil saturation), geological setting, gests that although persistent ARs are important con- catchment size, land use, and management of local tributors to heavy rainfall events, they are not rivers/dams. Nevertheless, it still provides some insight necessarily a prerequisite. Other features of the ARs, into the possibility for improved local flood forecasting, such as the direction of the IVT transport, are known to particularly in the mountainous region, based on the play an important role in local rainfall characteristics development and identification of a persistent AR off over California (e.g., Hecht and Cordeira 2017), and the the west coast of South Africa. same could apply here. It should also be noted that these Overall, these results improve our understanding of daily rainfall extremes are not necessarily associated the importance of ARs for regional rainfall patterns
140                                 JOURNAL OF HYDROMETEOROLOGY                                                           VOLUME 19

along the west coast of South Africa. The next scientific          Acknowledgments. The NCEP-2 data were provided by
challenge is to investigate and understand factors that         NOAA/OAR/ESRL PSD (Boulder, CO; http://www.esrl.
influence the formation and location of ARs in the South        noaa.gov/psd/), and the ERAI data were obtained from the
Atlantic. This includes investigating the influence of          Meteorological Archival and Retrieval System (MARS) at
South American climate variability on African climate,          the ECMWF. We thank the South African Weather Ser-
which has not been well documented. Grimm and Reason            vice for providing the station data and Pierre Kloppers for
(2015) investigated the link between climate variability in     the data management. We would also like to thank the
the South America monsoon region and summer and                 reviewers for their insightful comments that helped im-
winter rainfall patterns over southern Africa. During the       prove the manuscript. Ross Blamey and Chris Reason were
winter months, these authors note a 4–5-day lag in the          supported by the Natural Environment Research Council
positive correlation between rainfall in southeastern           (NERC) Future Climate for Africa (FCFA) regional con-
South America and in southwestern South Africa. Their           sortium project UMFULA (NE/M020223/1). Alexandre
findings suggest that the link between the two regions          Ramos, Ricardo Trigo, and Chris Reason were supported
may occur directly via atmospheric circulation anoma-           by the project Improving Drought and Flood Early
lies induced by convection over South America. Another          Warning, Forecasting and Mitigation using real-time hy-
potential link between the two regions during the               droclimatic indicators (IMDROFLOOD) funded by Fun-
winter months could be through water vapor trans-               dação para a Ci^  encia e a Tecnologia, Portugal (FCT)
port via ARs, with South America acting as a moisture           (WaterJPI/0004/2014) and the Water Research Commis-
source. Furthermore, it is understood that the south-           sion (K5-2618). Alexandre M. Ramos was also supported
west Atlantic Ocean is a region of intense cyclogenesis         by an FCT postdoctoral grant (FCT/DFRH/SFRH/BPD/
(Bengtsson et al. 2006; Hoskins and Hodges 2005).               84328/2012).
Considering the close association between ARs and
midlatitude cyclones, it is likely that regional climate                                  REFERENCES
dynamics off the east coast of South America could
play a key role in winter rainfall in South Africa. Thus,       Bao, J.-W., S. A. Michelson, P. J. Neiman, F. M. Ralph, and J. M.
                                                                    Wilczak, 2006: Interpretation of enhanced integrated water
the potential links between moisture availability in                vapor bands associated with extratropical cyclones: Their
South America, the formation and location of mid-                   formation and connection to tropical moisture. Mon. Wea.
latitude cyclones, and winter rainfall in South Africa              Rev., 134, 1063–1080, https://doi.org/10.1175/MWR3123.1.
warrant further investigation.                                  Bengtsson, L., K. I. Hodges, and E. Roeckner, 2006: Storm tracks
                                                                    and climate change. J. Climate, 19, 3518–3543, https://doi.org/
   Finally, midlatitude atmospheric water vapor content             10.1175/JCLI3815.1.
is expected to rise in a warmer climate due to an increase      Blamey, R., and C. J. C. Reason, 2007: Relationships between
in saturation water vapor pressure with air temperature,            Antarctic sea-ice and South African winter rainfall. Climate
as governed by the Clausius–Clapeyron equation (Held                Res., 33, 183–193, https://doi.org/10.3354/cr033183.
and Soden 2006). This has the potential to result in in-        Cordeira, J. M., F. M. Ralph, and B. J. Moore, 2013: The devel-
                                                                    opment and evolution of two atmospheric rivers in proximity
creased water vapor transport through ARs (Gimeno                   to western North Pacific tropical cyclones in October 2010.
et al. 2016). The link between increased AR activity/               Mon. Wea. Rev., 141, 4234–4255, https://doi.org/10.1175/
intensity through climate change and local flooding has             MWR-D-13-00019.1.
already been projected for some regions, such as Cal-           Dacre, H. F., P. A. Clark, O. Martinez-Alvarado, M. A. Stringer,
ifornia (Dettinger 2011), Great Britain (Lavers et al.              and D. A. Lavers, 2015: How do atmospheric rivers form?
                                                                    Bull. Amer. Meteor. Soc., 96, 1243–1255, https://doi.org/
2013), and western Europe (Ramos et al. 2016). Given                10.1175/BAMS-D-14-00031.1.
the results highlighting the impact ARs have on heavy           Dee, D. P., and Coauthors, 2011: The ERA-Interim reanalysis: Con-
regional winter rainfall events, this implies, all else being       figuration and performance of the data assimilation system. Quart.
equal, that there may be an increased risk of flooding              J. Roy. Meteor. Soc., 137, 553–597, https://doi.org/10.1002/qj.828.
events in the southwest region of South Africa in the           Dettinger, M., 2011: Climate change, atmospheric rivers, and floods
                                                                    in California—A multimodel analysis of storm frequency and
future through changes in AR activity. This again                   magnitude changes. J. Amer. Water Resour. Assoc., 47, 514–
highlights the need to better understand the factors that           523, https://doi.org/10.1111/j.1752-1688.2011.00546.x.
influence the formation, frequency, and intensity of ARs        ——, F. M. Ralph, T. Das, P. J. Neiman, and D. R. Cayan, 2011:
in the South Atlantic. Given the close association be-              Atmospheric rivers, floods and the water resources of Cal-
                                                                    ifornia. Water, 3, 445–478, https://doi.org/10.3390/w3020445.
tween these ARs and the winter rainfall region of South
                                                                Durre, I., M. J. Menne, B. E. Gleason, T. G. Houston, and R. S.
Africa, this could potentially play a key role in un-               Vose, 2010: Comprehensive automated quality assurance of
derstanding any local changes in the context of global              daily surface observations. J. Appl. Meteor. Climatol., 49,
climate change.                                                     1615–1633, https://doi.org/10.1175/2010JAMC2375.1.
JANUARY 2018 BLAMEY ET AL. 141
Gimeno, L., R. Nieto, M. Vázquez, and D. A. Lavers, 2014: At- Liniger, H., R. Weingartner, and M. Grosejean, 1998: Mountains of
mospheric rivers: A mini-review. Front. Earth Sci., 2, 2, https:// the world: Water towers for the 21st century. University of Bern
doi.org/10.3389/feart.2014.00002. Centre for Development and Environment Tech. Rep., 32 pp.
——, and Coauthors, 2016: Major mechanisms of atmospheric Messerli, B., D. Viviroli, and R. Weingartner, 2004: Mountains of
moisture transport and their role in extreme precipitation the world: Vulnerable water towers for the 21st century.
events. Annu. Rev. Environ. Resour., 41, 117–141, https://doi.org/ Ambio Spec. Rep., 13, 29–34.
10.1146/annurev-environ-110615-085558. Midgley, G. F., and Coauthors, 2007: Assessing impacts, vulnerability
Grimm, A. M., and C. J. C. Reason, 2015: Intraseasonal and adaptation in key South African sectors: An input into the
teleconnections between South America and South Long Term Mitigation Scenarios process. University of Cape
Africa. J. Climate, 28, 9489–9497, https://doi.org/10.1175/ Town Energy Research Centre Rep., 24 pp., http://www.erc.uct.
JCLI-D-15-0116.1. ac.za/sites/default/files/image_tool/images/119/Papers-2007/
Hecht, C. W., and J. M. Cordeira, 2017: Characterizing the influ- 07Midgley-etal-LTMS_Impacts_Vulnerability_Adaptation.pdf.
ence of atmospheric river orientation and intensity on pre- Moore, B. J., P. J. Neiman, F. M. Ralph, and F. E. Barthold, 2012:
cipitation distributions over north coastal California. Physical processes associated with heavy flooding rainfall in
Geophys. Res. Lett., 44, 9048–9058, https://doi.org/10.1002/ Nashville, Tennessee, and vicinity during 1–2 May 2010: The
2017GL074179. role of an atmospheric river and mesoscale convective sys-
Held, I. M., and B. J. Soden, 2006: Robust responses of the hy- tems. Mon. Wea. Rev., 140, 358–378, https://doi.org/10.1175/
drological cycle to global warming. J. Climate, 19, 5686–5699, MWR-D-11-00126.1.
https://doi.org/10.1175/JCLI3990.1. Neiman, P. J., F. M. Ralph, A. B. White, D. E. Kingsmill, and P. O. G.
Hirota, N., Y. N. Takayabu, M. Kato, and S. Arakane, 2016: Persson, 2002: The statistical relationship between upslope flow
Roles of an atmospheric river and a cutoff low in the ex- and rainfall in California’s coastal mountains: Observations dur-
treme precipitation event in Hiroshima on 19 August 2014. ing CALJET. Mon. Wea. Rev., 130, 1468–1492, https://doi.org/
Mon. Wea. Rev., 144, 1145–1160, https://doi.org/10.1175/ 10.1175/1520-0493(2002)130,1468:TSRBUF.2.0.CO;2.
MWR-D-15-0299.1. ——, ——, G. A. Wick, J. D. Lundquist, and M. D. Dettinger, 2008:
Hoskins, B. J., and K. I. Hodges, 2005: A new perspective on Meteorological characteristics and overland precipitation
Southern Hemisphere storm tracks. J. Climate, 18, 4108–4129, impacts of atmospheric rivers affecting the west coast of
https://doi.org/10.1175/JCLI3570.1. North America based on eight years of SSM/I satellite
Jones, D. A., and I. Simmonds, 1993: A climatology of Southern observations. J. Hydrometeor., 9, 22–47, https://doi.org/
Hemisphere extratropical cyclones. Climate Dyn., 9, 131–145, 10.1175/2007JHM855.1.
https://doi.org/10.1007/BF00209750. ——, M. Hughes, B. J. Moore, F. M. Ralph, and E. M. Sukovich,
Junker, N. W., R. H. Grumm, R. Hart, L. F. Bosart, K. M. Bell, and 2013: Sierra barrier jets, atmospheric rivers, and precipitation
F. J. Pereira, 2008: Use of normalized anomaly fields to an- characteristics in Northern California: A composite perspec-
ticipate extreme rainfall in the mountains of Northern Cal- tive based on a network of wind profilers. Mon. Wea. Rev., 141,
ifornia. Wea. Forecasting, 23, 336–356, https://doi.org/10.1175/ 4211–4233, https://doi.org/10.1175/MWR-D-13-00112.1.
2007WAF2007013.1. Newell, R. E., N. E. Newell, Y. Zhu, and C. Scott, 1992: Tropo-
Kalnay, E., and Coauthors, 1996: The NCEP/NCAR 40-Year Re- spheric rivers?—A pilot study. Geophys. Res. Lett., 19,
analysis Project. Bull. Amer. Meteor. Soc., 77, 437–471, https:// 2401–2404, https://doi.org/10.1029/92GL02916.
doi.org/10.1175/1520-0477(1996)077,0437:TNYRP.2.0.CO;2. Pereira, S., A. M. Ramos, J. L. Z^ezere, R. M. Trigo, and J. M.
Kanamitsu, M., W. Ebisuzaki, J. Woollen, S. K. Yang, J. Hnilo, Vaquero, 2016: Spatial impact and triggering conditions of
M. Fiorino, and G. L. Potter, 2002: NCEP–DOE AMIP-II the exceptional hydro-geomorphological event of December
Reanalysis (R-2). Bull. Amer. Meteor. Soc., 83, 1631–1643, 1909 in Iberia. Nat. Hazards Earth Syst. Sci., 16, 371–390,
https://doi.org/10.1175/BAMS-83-11-1631. https://doi.org/10.5194/nhess-16-371-2016.
Lavers, D. A., and G. Villarini, 2013: The nexus between atmo- Philippon, N., M. Rouault, Y. Richard, and A. Favre, 2012: The
spheric rivers and extreme precipitation across Europe. influence of ENSO on winter rainfall in South Africa. Int.
Geophys. Res. Lett., 40, 3259–3264, https://doi.org/10.1002/ J. Climatol., 32, 2333–2347, https://doi.org/10.1002/joc.3403.
grl.50636. Ralph, F. M., and M. D. Dettinger, 2012: Historical and national
——, and ——, 2015: The contribution of atmospheric rivers to perspectives on extreme West Coast precipitation associ-
precipitation in Europe and the United States. J. Hydrol., ated with atmospheric rivers during December 2010. Bull.
522, 382–390, https://doi.org/10.1016/j.jhydrol.2014.12.010. Amer. Meteor. Soc., 93, 783–790, https://doi.org/10.1175/
——, R. P. Allan, E. F. Wood, G. Villarini, D. J. Brayshaw, and BAMS-D-11-00188.1.
A. J. Wade, 2011: Winter floods in Britain are connected to ——, P. J. Neiman, and G. A. Wick, 2004: Satellite and CALJET
atmospheric rivers. Geophys. Res. Lett., 38, L23803, https:// aircraft observations of atmospheric rivers over the eastern
doi.org/10.1029/2011GL049783. North Pacific Ocean during the winter of 1997/98. Mon. Wea.
——, G. Villarini, R. P. Allan, E. F. Wood, and A. J. Wade, 2012: Rev., 132, 1721–1745, https://doi.org/10.1175/1520-0493(2004)
The detection of atmospheric rivers in atmospheric rean- 132,1721:SACAOO.2.0.CO;2.
alyses and their links to British winter floods and the large- ——, ——, ——, S. I. Gutman, M. D. Dettinger, D. R. Cayan, and
scale climatic circulation. J. Geophys. Res., 117, D20106, A. B. White, 2006: Flooding on California’s Russian River:
https://doi.org/10.1029/2012JD018027. Role of atmospheric rivers. Geophys. Res. Lett., 33, L13801,
——, R. P. Allan, G. Villarini, B. Lloyd-Hughes, D. J. Brayshaw, and https://doi.org/10.1029/2006GL026689.
A. J. Wade, 2013: Future changes in atmospheric rivers and ——, T. Coleman, P. J. Neiman, R. J. Zamora, and M. D.
their implications for winter flooding in Britain. Environ. Res. Dettinger, 2013: Observed impacts of duration and seasonality
Lett., 8, 034010, https://doi.org/10.1088/1748-9326/8/3/034010. of atmospheric-river landfalls on soil moisture and runoff in142 JOURNAL OF HYDROMETEOROLOGY VOLUME 19
coastal Northern California. J. Hydrometeor., 14, 443–459, Singleton, A. T., and C. J. C. Reason, 2007a: A numerical model
https://doi.org/10.1175/JHM-D-12-076.1. study of an intense cutoff low pressure system over South
Ramos, A. M., R. M. Trigo, and M. L. R. Liberato, 2014: A ranking of Africa. Mon. Wea. Rev., 135, 1128–1150, https://doi.org/
high-resolution daily precipitation extreme events for the Iberian 10.1175/MWR3311.1.
Peninsula. Atmos. Sci. Lett., 15, 328–334, https://doi.org/10.1002/ ——, and ——, 2007b: Variability in the characteristics of cut-off
asl2.507. low pressure systems over subtropical southern Africa. Int.
——, ——, ——, and R. Tomé, 2015: Daily precipitation extreme J. Climatol., 27, 295–310, https://doi.org/10.1002/joc.1399.
events in the Iberian Peninsula and its association with at- Sun, X., K. H. Cook, and E. K. Vizy, 2017: The South Atlantic
mospheric rivers. J. Hydrometeor., 16, 579–597, https://doi.org/ subtropical high: Climatology and interannual variability.
10.1175/JHM-D-14-0103.1. J. Climate, 30, 3279–3296, https://doi.org/10.1175/
——, R. Nieto, R. Tomé, L. Gimeno, R. M. Trigo, M. L. R. JCLI-D-16-0705.1.
Liberato, and D. A. Lavers, 2016: Atmospheric rivers mois- Tennant, W., 2004: Considerations when using pre-1979
ture sources from a Lagrangian perspective. Earth Syst. Dyn., NCEP/NCAR reanalyses in the Southern Hemisphere.
7, 371–384, https://doi.org/10.5194/esd-7-371-2016. Geophys. Res. Lett., 31, L11112, https://doi.org/10.1029/
Reason, C. J. C., 1998: Warm and cold events in the southeast 2004GL019751.
Atlantic/southwest Indian Ocean region and potential im- Trenberth, K. E., J. T. Fasullo, and J. Mackaro, 2011: Atmospheric
pacts on circulation and rainfall over southern Africa. Meteor. moisture transports from ocean to land and global energy
Atmos. Phys., 69, 49–65, https://doi.org/10.1007/BF01025183. flows in reanalyses. J. Climate, 24, 4907–4924, https://doi.org/
——, and D. Jagadheesha, 2005: Relationships between South 10.1175/2011JCLI4171.1.
Atlantic SST variability and atmospheric circulation over the Viale, M., and M. N. Nuñez, 2011: Climatology of winter
South African region during austral winter. J. Climate, 18, orographic precipitation over the subtropical central
3339–3355, https://doi.org/10.1175/JCLI3474.1. Andes and associated synoptic and regional characteristics.
——, and M. Rouault, 2005: Links between the Antarctic Oscilla- J. Hydrometeor., 12, 481–507, https://doi.org/10.1175/
tion and winter rainfall over western South Africa. Geophys. 2010JHM1284.1.
Res. Lett., 32, L07705, https://doi.org/10.1029/2005GL022419. Warner, M. D., C. F. Mass, and E. P. Salathé, 2012: Wintertime
——, ——, J. L. Melice, and D. Jagadheesha, 2002: Interannual extreme precipitation events along the Pacific Northwest
winter rainfall variability in SW South Africa and large scale coast: Climatology and synoptic evolution. Mon. Wea. Rev.,
ocean–atmosphere interactions. Meteor. Atmos. Phys., 80, 140, 2021–2043, https://doi.org/10.1175/MWR-D-11-00197.1.
19–29, https://doi.org/10.1007/s007030200011. Wick, G. A., P. J. Neiman, F. M. Ralph, and T. M. Hamill, 2013:
Rienecker, M. M., and Coauthors, 2011: MERRA: NASA’s Modern-Era Evaluation of forecasts of the water vapor signature of at-
Retrospective Analysis for Research and Applications. J. Climate, mospheric rivers in operational numerical weather prediction
24, 3624–3648, https://doi.org/10.1175/JCLI-D-11-00015.1. models. Wea. Forecasting, 28, 1337–1352, https://doi.org/
Rutz, J. J., and W. J. Steenburgh, 2012: Quantifying the role of 10.1175/WAF-D-13-00025.1.
atmospheric rivers in the interior western United States. At- WWF, 2013: An introduction to South Africa’s water source areas.
mos. Sci. Lett., 13, 257–261, https://doi.org/10.1002/asl.392. World Wildlife Fund South Africa (WWF-SA) Rep., 29 pp.
——, ——, and F. M. Ralph, 2014: Climatological characteristics of Zhu, Y., and R. E. Newell, 1998: A proposed algorithm for mois-
atmospheric rivers and their inland penetration over the ture fluxes from atmospheric rivers. Mon. Wea. Rev., 126,
western United States. Mon. Wea. Rev., 142, 905–921, https:// 725–735, https://doi.org/10.1175/1520-0493(1998)126,0725:
doi.org/10.1175/MWR-D-13-00168.1. APAFMF.2.0.CO;2.You can also read