The nZEB Requirements for Residential Buildings: An Analysis of Thermal Comfort and Actual Energy Needs in Portuguese Climate
←
→
Page content transcription
If your browser does not render page correctly, please read the page content below
sustainability

Article
The nZEB Requirements for Residential Buildings: An Analysis
of Thermal Comfort and Actual Energy Needs in
Portuguese Climate
Jaime Resende              and Helena Corvacho *

                                          CONSTRUCT (LFC), Faculty of Engineering (FEUP), University of Porto, 4200-465 Porto, Portugal;
                                          jaime.resende@fe.up.pt
                                          * Correspondence: corvacho@fe.up.pt

                                          Abstract: As of now, in the EU, all new buildings will have to comply with the requirements for
                                          nearly zero energy buildings (nZEB). Portugal defines limits for the maximum useful energy needs
                                          for heating and for the maximum primary energy needs and establishes that 50% of primary energy
                                          needs must be covered by local renewable energy sources, based on the dwellings’ nominal condition
                                          of use. However, the actual use is different. Thus, a simulation tool is used to assess thermal comfort
                                          and energy needs for different conditions of use of a dwelling complying with nZEB requirements.
                                          Eight different locations are chosen, covering all Portuguese climate zones. The nZEB requirements
                                          lead to unusually high levels of thermal insulation, especially in the coldest regions, so special care
                                          must be taken by the designers to avoid overheating in summer. Without using HVAC system,
                                          some discomfort is found but comfort is possible with low energy consumption. Furthermore, the
                                          compliance with nZEB requirements proved to be enough to ensure that a significant percentage

                                   of useful energy needs for heating, cooling and domestic hot water is supplied by local renewable
Citation: Resende, J.; Corvacho, H.       energy sources. This is key in order to overcome the high rate of energy poverty in Portugal.
The nZEB Requirements for
Residential Buildings: An Analysis of     Keywords: nZEB requirements; conditions of use; thermal comfort; energy needs; renewable energy
Thermal Comfort and Actual Energy
Needs in Portuguese Climate.
Sustainability 2021, 13, 8277. https://
doi.org/10.3390/su13158277                1. Introduction
                                               The European Union (EU) introduced the concept of nearly zero energy buildings
Academic Editor: Antonio Caggiano
                                          (nZEB) a decade ago as a way to decarbonize the building stock, which is responsible for
                                          40% of total energy consumption and for 36% of greenhouse gas (GHG) emissions [1,2].
Received: 22 May 2021
                                               The construction sector, as a major contributor of negative environmental impacts,
Accepted: 19 July 2021
                                          must therefore be the object of particular attention. The strategies to achieve the goal
Published: 24 July 2021
                                          of a radical reduction of GHG emissions include applying energy and environmental
                                          standards and policies, conducting impact assessments, adopting low-carbon technologies,
Publisher’s Note: MDPI stays neutral
with regard to jurisdictional claims in
                                          and reducing the energy consumption in buildings [3] in all phases of their life cycle.
published maps and institutional affil-
                                               The Energy Performance of Buildings Directive (EPBD) in its recast of 2010 established
iations.
                                          that all new buildings constructed in the EU from January 2021 onwards must be nZEB.
                                          This concept was defined as “a building that has a very high energy performance” and in
                                          which “the nearly zero or very low amount of energy required should be covered to a very
                                          significant extent by energy from renewable sources, including energy from renewable
                                          sources produced on-site or nearby”. Its practical application is the responsibility of each
Copyright: © 2021 by the authors.
                                          Member State which should define the requirements for a “very high energy performance”
Licensee MDPI, Basel, Switzerland.
                                          and what would be the recommended significant contribution of “energy from renewable
This article is an open access article
distributed under the terms and
                                          sources” [1].
conditions of the Creative Commons
                                               Establishing a single level of nZEB target requirement for the whole of Europe is
Attribution (CC BY) license (https://     neither possible nor feasible due to the influence of regional climate conditions on heating
creativecommons.org/licenses/by/          and cooling needs and the cost-effectiveness of energy efficiency measures and renewable
4.0/).                                    energy packages. In scenarios where a numerical indicator has already been defined,

Sustainability 2021, 13, 8277. https://doi.org/10.3390/su13158277                                    https://www.mdpi.com/journal/sustainability
Sustainability 2021, 13, 8277                                                                                          2 of 21

                                requirements vary widely from 0 kWh/(m2 year) to 270 kWh/(m2 year). In residential
                                buildings, most Member States aim to achieve a level of primary energy use not exceeding
                                50 kWh/(m2 year) [4].
                                      The application of the nZEB concept is at different stages, depending on the region,
                                since different Member States face different challenges. Northern European countries
                                already have an advanced application experience, due to their overriding need to manage
                                cold climates and their focus is on controlling heating energy needs and consumption. In
                                southern European countries, with high temperatures and high solar irradiance in summer,
                                most buildings have to reach a compromise between heating and cooling energy needs.
                                Thus, it is necessary to resolve potential conflicts between winter and summer comfort
                                requirements [5].
                                      The two most significant energy uses in European residential sector are heating and
                                domestic hot water (DHW). However, there are great differences between the regions.
                                Northern countries consume twice as much energy with these services as southern coun-
                                tries. Although consumption is still high, rates have decreased over the years, thanks to
                                energy policies [5,6].
                                      On the other hand, the energy for cooling demand is growing faster than any other
                                end-use in buildings. Its numbers more than tripled between 1990 and 2016 becoming one
                                of the most critical factors that puts the most stress on several countries energy systems
                                and increases carbon emissions. Besides, there is no or little doubt that the global demand
                                for cooling will continue to grow in the coming decades due to global warming. According
                                to a baseline scenario, the cooling energy needs could triple by 2050. This means that
                                measures to improve buildings energy performance will be of more crucial importance in
                                the long run [7].
                                      In general, European nZEB guidelines are more concerned with cold weather con-
                                ditions. Bioclimatic strategies should be reevaluated to integrate recommendations for
                                heating and cooling seasons for new and refurbishment nZEB projects [8]. In southern
                                Europe, this is even more important. The prevention of overheating in buildings during
                                the summer is crucial and the amount of solar radiation transmitted through the building’s
                                glazing must be controlled [9].
                                      A significant and concerning anomaly found in the context of thermal comfort in
                                dwellings is that southern European countries, which have a milder climate and greater
                                solar radiation availability, are those with the worst indoor thermal comfort conditions due
                                to their high energy poverty rates [10].
                                      Decree-Law No. 118/2013 [11], that transposed the Directive 2010/31/EU into Por-
                                tuguese national regulation, introduced the nZEB concept, adopting the exact definition
                                of the Directive, and making them mandatory from January 2021. That decree-law was
                                complemented by several ordinances, such as Ordinance No. 349B/2013 [12] that defined
                                the requirements to comply with the decree-law and the respective calculation method.
                                Buildings have to comply with a maximum allowable value of annual nominal needs of
                                primary energy (Nt ), which takes into consideration the maximum allowable values of the
                                annual nominal needs of useful energy for heating (Ni ) and for cooling (Nv ), in addition to
                                the useful energy needed for DHW.
                                      Six years later, Ordinance No. 98/2019 [13] detailed the nZEB requirements for
                                dwellings, which are: an annual nominal needs of useful energy for heating (Nic ) equal to
                                or less than 75% of its maximum allowable value (Ni ); an annual nominal needs of primary
                                energy (Ntc ) equal to or less than 50% of its maximum allowable value (Nt ); and the use of
                                local renewable energy systems able to cover at least 50% of annual primary energy needs.
                                      The maximum allowable values of heating useful energy needs and primary energy
                                needs are established by the regulation based on reference values of thermal parameters
                                and reference conditions applied to the geometry of the building under analysis. Therefore,
                                there is no fixed threshold for energy needs applicable to all buildings.
                                      It is possible to optimize energy consumption in buildings through the appropriate
                                and holistic use of modelling and simulation tools in the design phase, allowing for a better
Sustainability 2021, 13, 8277                                                                                          3 of 21

                                choice of the building envelope and the technical systems. So, the use of control strate-
                                gies for HVAC systems fueled by renewable energy contributes to effectively achieving
                                considerable energy savings and reducing CO2 emissions [14]. Notable technological ad-
                                vances made in recent years have provided modelling and simulation tools with acceptable
                                accuracy.
                                      A holistic treatment is desirable, namely, a multidisciplinary approach that takes
                                into account different areas of action (architectural solutions, development of innovative
                                insulation materials, improvements in the level of engineering, economic viability and
                                others), to facilitate the achievement of the objective of improving the energy efficiency of
                                buildings [14].
                                      Bearing in mind that the EPBD recast allows several interpretations concerning the
                                numerical limits or ranges for the definition of nZEB requirements, each Member States
                                choices can and should be justified by variable factors such as specific climatic conditions,
                                local goals, cultural user behavior and local construction traditions. Southern European
                                countries have both heating and cooling needs due to their climate, making it more difficult
                                to find some balance through passive strategies. Besides, Portugal has one of the highest
                                levels of energy poverty in the EU, which may sound surprising due to its less demanding
                                mild climate and consequent lower energy needs for heating.
                                      It is undeniable that a high percentage of Portuguese families cannot afford to have
                                a high energy consumption. The price of energy for households in Portugal is one of the
                                highest in Europe, especially when expressed in purchasing power standards. A massive
                                adoption of systems for the local use of available renewable sources, mainly solar, will
                                certainly help to overcome this problem. The energy poverty that affects a significant part
                                of the population can and must be solved in an eco-friendly way. Some local authorities
                                that manage social housing neighborhoods are starting these initiatives, planning to install
                                solar collectors and solar PV panels centrally managed in order to get the most out of them,
                                lowering energy bills and improving comfort with no costs for the tenants.
                                      Thermal solar collectors for DHW were already made mandatory in all new buildings,
                                in 2006. The Decree-Law No. 118/2013 [11] and related regulatory documents allowed
                                the choice of any other renewable energy system as long as it provides the same amount
                                of renewable energy as an estimated number of standard solar collectors. As previously
                                stated, now the new nZEB requirements [13] go further and demand that the installed
                                systems cover at least 50% of the primary energy needs of the household.
                                      Another question that must be addressed is the fact that regulatory requirements
                                are based on nominal conditions of use which are often very far from the real conditions.
                                Regulation considers that the heating system is on 24 h a day, throughout the whole heating
                                season. The same is considered for the cooling system in summer. In function of these
                                considerations, the regulation establishes several requirements, namely the minimum
                                level of thermal insulation of the building envelope. However, because of energy poverty,
                                intrinsic life habits and, obviously, because of the mildness of the climate, almost no
                                households work in those nominal conditions. Many of them do not use heating at all or
                                just very occasionally and the great majority do not have an installed cooling system. This
                                means that it is very important to evaluate the implications of regulatory requirements
                                not only in terms of energy consumption but also in terms of thermal comfort. If a high
                                level of thermal insulation is always beneficial in winter for a building where no active
                                heating is provided, that is not always the case in summer, when a higher level of insulation
                                can cause overheating. In addition, an unrealistic estimation of energy needs may lead
                                to an oversizing of technical systems, which is definitely neither energy efficient nor
                                economically sensible. In the process of transposing the EU Directive 2018/844 [2] into the
                                national regulation, it was already announced that a new calculation methodology would
                                be established by the end of June 2021. It is foreseeable that dynamic simulation will be
                                made mandatory.
                                      The main goal of the work presented in this paper is to evaluate the impact of nZEB
                                requirements on the performance of residential buildings in Portuguese climate zones,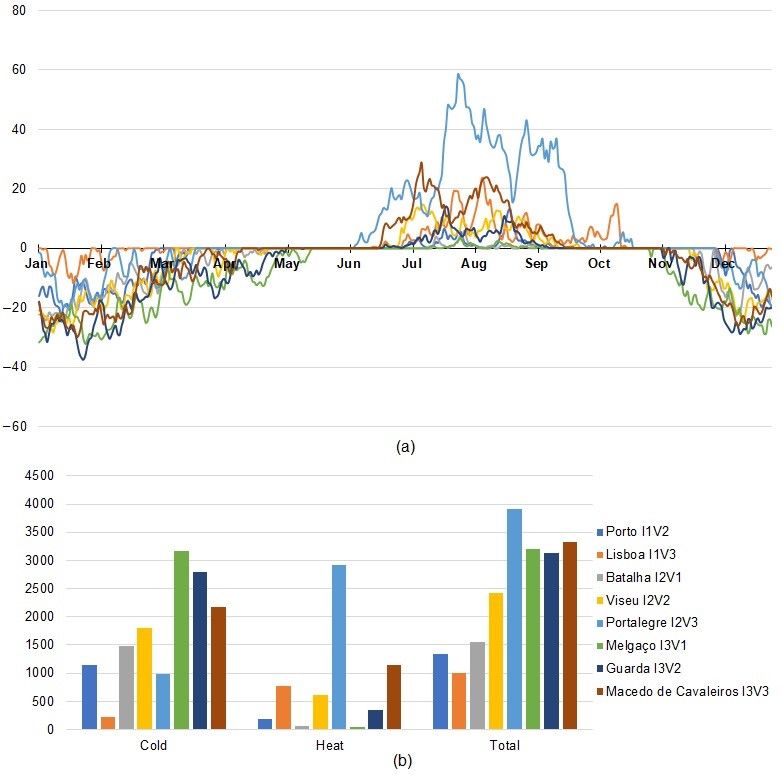
Sustainability 2021, 13, x FOR PEER REVIEW 4 of 21
Sustainability 2021, 13, 8277 4 of 21
The main goal of the work presented in this paper is to evaluate the impact of nZEB
requirements on the performance of residential buildings in Portuguese climate zones, in
actual conditions of use. In particular, it aims at giving an answer to the following ques-
in actual conditions of use. In particular, it aims at giving an answer to the following
tions:
questions:
•• What
Whatisisthe
theimpact
impactof ofnZEB
nZEBrequirements
requirementson onbuilding
buildingenvelope
envelopesolutions?
solutions?
•• Are the results of regulatory calculation on which nZEB requirements
Are the results of regulatory calculation on which nZEB requirements are based com-
are based
parable to the results of dynamic simulations?
comparable to the results of dynamic simulations?
•• What
Whatisisthe
the level
level of discomfort
of discomfort in ain a building
building complying
complying with nZEB
with nZEB requirements
requirements when
when HVAC
HVAC system system is not used?
is not used?
•• HowHowmuch
muchenergy
energyisisneeded
neededtotoeliminate
eliminatediscomfort
discomfortininoccupancy
occupancyhours?
hours?
•• Can additional passive strategies have a significant
Can additional passive strategies have a significant effect?effect?
•• What
Whatisisthe
thepercentage
percentageof ofenergy
energyneeds
needssupplied
suppliedbybyrenewable
renewableenergy
energysources
sourcesininaa
building complying with minimum nZEB requirements, in actual conditions
building complying with minimum nZEB requirements, in actual conditions of use? of use?
2.2.Materials
Materialsand
andMethods
Methods
2.1.
2.1.Standard
StandardDwelling
Dwelling
For
Forthe
thepurpose
purposeofofthe
thestudy,
study,aastandard
standarddwelling
dwellingisisconsidered
considered(Figure
(Figure1),
1),based
basedon
on
the data available in Construction and Housing Statistics [15].
the data available in Construction and Housing Statistics [15].
Figure 1. Floor
Figure planplan
1. Floor of the considered
of the standard
considered dwelling.
standard dwelling.
Table
Table11shows
showsthethenumber
numberofofwindows
windowsinineach
eachindoor
indoorspace,
space,their
theirdimensions,
dimensions,the the
glazed area and the orientation. All windows have external roller shutters that
glazed area and the orientation. All windows have external roller shutters that are closedare closed
at
atnight,
night,throughout
throughout thetheyear.
year. In
In the
the cooling
cooling season
season (months
(months of
of June,
June, July,
July,August
Augustand and
September),
September), they are also partially closed during the day for solar protection,as
they are also partially closed during the day for solar protection, asfollows:
follows:
on
onthe
thenorth
northfaçade,
façade,nonoclosing
closingisisnecessary
necessaryduring
duringthetheday,
day,on
onthe
theeast
eastand
andsouth
southfaçades
façades
the shutters will be closed for 60% of the day. The air change rate is equal to 0.6 air changes
per hour.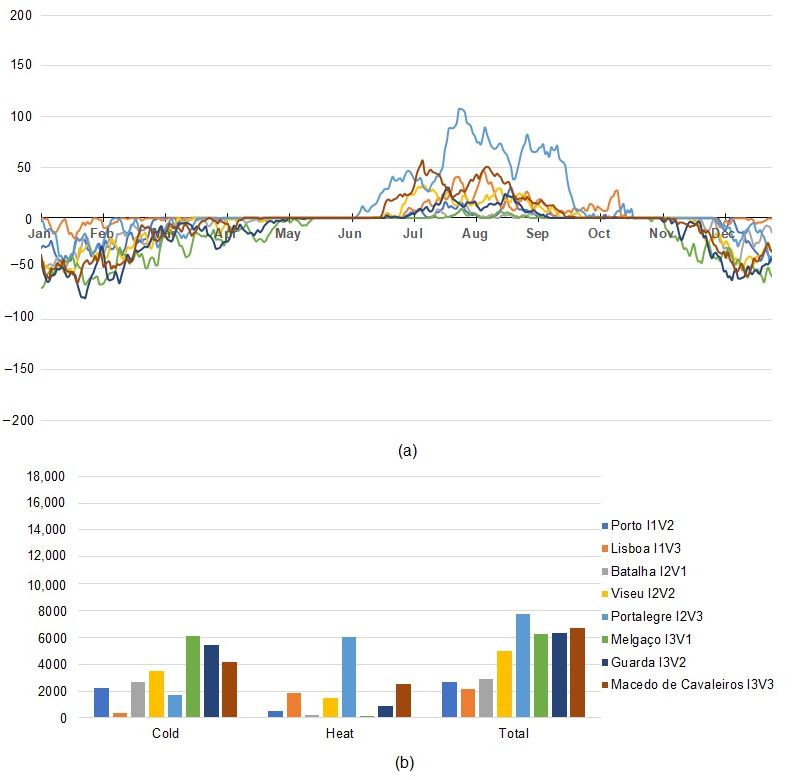
Sustainability
Sustainability2021,
2021,13,
13,x8277
FOR PEER REVIEW 5 5ofof21
21
the shutters
Table will be
1. Number, closed
area for 60% of of
and distribution thewindows
day. Theinair
thechange rate is equal to 0.6 air changes
dwelling.
per hour.
Indoor Space Nº. of Windows Dimensions Glazing Area Orientation
Table Living
1. Number,
Roomarea and distribution
3 of windows in the
1.2 × 1.15 mdwelling. 4.14 m2 South
Indoor
En suite Space
bedroom Nº. of Windows 2 Dimensions
1.0 × 1.15 m Glazing m2
2.30Area Orientation
South
Living Room
En suite WC 3 1 1.2 × 1.15 m
0.5 × 0.5 m 4.14 m 2 2
0.25 m South
East
En suite WCbedroom 2 1 1.0 ×0.51.15 m
× 0.5 m 2.30 m 2
0.25 m 2 South
East
En suite WC 1 0.5 × 0.5 m 0.25 m2 2 East
Kitchen 2 1.0 × 1.15 m 2.30 m North
WC 1 0.5 × 0.5 m 0.25 m2 East
Bedroom 1 1 1.2 × 1.15 m 1.38 m 2 North
Kitchen 2 1.0 × 1.15 m 2.30 m2 North
Bedroom12 × 1.15 2
Bedroom 1 1 1.2 1.2
× 1.15 mm 1.381.38
m2m North
North
Bedroom 2 1 1.2 × 1.15 m 1.38 m2 North
2.2. Portuguese Climate Zoning
2.2. Portuguese Climateclimate
The Portuguese Zoning zoning is defined by dividing the territory into three winter
climate zones (I1, I2 and
The Portuguese climate I3) and three
zoning is summer
defined by climate zones
dividing the(V1, V2 and
territory V3)three
into [16]. winter
Winter
climate zones are defined in function of the number of heating degree-days
climate zones (I1, I2 and I3) and three summer climate zones (V1, V2 and V3) [16]. Winter (HDD) for a
baselinezones
temperature ◦
of 18inC, corresponding to the heating season. Summer climate
climate are defined function of the number of heating degree-days (HDD) zones
for a
are defined
baseline based on the
temperature mean
of 18 °C, outdoor temperature
corresponding to thefor the conventional
heating coolingclimate
season. Summer season
(θext,vare
zones ). The criteria
defined for defining
based on the meanthe climate
outdoor zones and theirfor
temperature graphical representation
the conventional are
cooling
shown in Table 2 and Figure 2, respectively.
season (θext,v). The criteria for defining the climate zones and their graphical representa-
tion are shown in Table 2 and Figure 2, respectively.
Table 2. Criteria for defining the Portuguese climate zones [16].
Table 2. Criteria for defining the Portuguese climate zones [16].
Winter Criteria HDD ≤ 1300 1300 < HDD ≤ 1800 HDD > 1800
Winter
Winter Criteria
climate zone HDD I1 ≤ 1300 1300 < HDD
I2 ≤ 1800 HDD I3 > 1800
Winter
Summerclimate
criteriazone I1 ◦ C
θext,v ≤ 20 ◦ I2 ≤ 22 ◦ C
20 C < θext,v θext,v >I322 ◦ C
Summer criteria
Summer climate zone
θext,v
V1
≤ 20 °C 20 °C < V2
θext,v ≤ 22 °C θext,vV3
> 22 °C
Summer climate zone V1 V2 V3
Graphicalrepresentation
Figure2.2.Graphical
Figure representationofofthe
the(a)
(a)winter
winterclimate
climatezones
zonesand
and(b)
(b) summer
summerclimate
climatezones
zones
Adapted from [16].
Adapted from [16].Sustainability 2021, 13, 8277 6 of 21
For the calculation of HDD and θext,v , reference values are given for each NUTS III
region in [16] and an adjustment must be done for each specific location, in function of their
altitude. After overlapping the maps of Figure 2, checking the criteria for the Portuguese
municipalities through their altimetry possibilities [17], eight possible combinations were
identified for the Portuguese climate zoning. The combination I1V1, which would combine
the mildest winter and the mildest summer, does not exist in Portuguese mainland, by
the current criteria [16]. The municipalities chosen to represent each of the eight possible
combinations of climate zones and the altitude of the chosen location for the building
within each municipality are shown in Table 3. The municipalities are identified on the
maps of Figure 2.
Table 3. Combinations of climate zones, representative municipality and location altitude.
Climate Zones Municipality Altitude
I1V2 Porto 83 m
I1V3 Lisboa 4m
I2V1 Batalha 247 m
I2V2 Viseu 475 m
I2V3 Portalegre 483 m
I3V1 Melgaço 678 m
I3V2 Guarda 1017 m
I3V3 Macedo de Cavaleiros 572 m
2.3. Discomfort Assessment
The concept of degree hours of discomfort is used to assess the discomfort in each of
the analyzed situations when the indoor air temperature is outside the defined set points,
which means below 18 ◦ C for heating and above 25 ◦ C for cooling. For each hourly value
of indoor air temperature in that condition, for heating and cooling season, the difference
to the respective set point temperature is calculated.
2.4. Study Phases and Tools
The study carried out was developed in five phases:
• First phase: first, the quasi-stationary method of Portuguese regulation is used to
check if the requirements previously in force, applied to the standard dwelling, could
make it reach the nZEB status, in any of the climate zones. Then, using the same
method, the construction solutions and the technical systems needed to reach nZEB
status with a minimum margin, in each climate zone, are identified.
• Second phase: using those construction solutions and technical systems, the standard
dwelling is evaluated, by dynamic simulation, first in free-floating regime for passive
comfort assessment and then using the regulatory nominal conditions (heating and
cooling systems ON, 24 h a day, with a set point of 18 ◦ C, in the heating season and a
set point of 25 ◦ C, in the cooling season) to estimate the energy needs;
• Third phase: a more realistic schedule for the use of HVAC, in winter, is tested
for determining, by dynamic simulation, the energy needed and the corresponding
thermal comfort conditions. Only natural ventilation is considered for cooling in
summer;
• Fourth phase: the energy needed to totally eliminate thermal discomfort in occupancy
hours is determined, by dynamic simulation;
• Fifth phase: for the most uncomfortable scenarios and the most adverse climates,
the possibilities of improving comfort without increasing energy consumption are
analyzed through the implementation of additional passive measures.Sustainability 2021, 13, 8277 7 of 21
The calculation spreadsheet developed and provided by the Platform for Energy
Efficiency in Buildings (P3E) of the Institute for Research and Technological Development
in Construction, Energy, Environment and Sustainability (Itecons) [18] is used to verify
the compliance with the regulatory requirements, in each of the Portuguese climate zones.
The SCE.ER tool [19], made available by the Portuguese General Directorate of Energy and
Geology, is used to calculate the contribution of the technical systems of the building that
use a renewable energy source locally available (for example, a heat pump) or make the
energy from that kind of energy source usable by the household (for example, PV panels).
The SCE.ER tool is also a spreadsheet that works as a complement to the first spreadsheet,
providing it with an estimation of the mentioned contribution.
DesignBuilder software version 6.1 is used in this study, for all the dynamic sim-
ulations. DesignBuilder is an EnergyPlus based software tool used for energy, carbon
emissions, lighting and comfort assessment and control. It is widely used to create and
evaluate building designs. Validation was performed using the ANSI/ASHRAE Standard
140−2017 (BESTEST) validation test results for DesignBuilder v6.1 with EnergyPlus v8.9,
specifically, through the Building Thermal Envelope and Fabric Load Tests [20].
3. Results
3.1. First Phase-Characterisation of Minimum nZEB Requirements for Construction Solutions and
Technical Systems
Regulatory requirements for new construction [11,12] were in place long before the
nZEB requirements were established [13].
Following the method of Portuguese regulation and the spreadsheet that applies it,
using thermal parameters calculated according to [21] and complying with the requirements
previously in force, it was possible to obtain the values of the annual nominal needs of
useful energy for heating (Nic ), the annual nominal needs of primary energy (Ntc ) and
the percentage of the annual nominal needs of primary energy that are covered by local
renewable energy sources. The annual nominal needs of useful energy for heating (Ni )
and the annual nominal needs of primary energy (Nt ) are the maximum allowable values
defined by the regulation, based on reference values of the relevant parameters applied
to the geometry of the actual building, as explained in the Introduction. The value of the
nominal annual useful energy needs for heating the building (Nic ) is determined using the
real thermal characteristics of the building under analysis and taking into account the heat
transfer by transmission through the building envelope, the heat transfer by ventilation
and the useful thermal gains resulting from the solar gains and the internal gains (a default
value including thermal gains from lighting, equipment and occupants). The value of
nominal primary energy needs of the building (Ntc ) results from the sum of the nominal
primary energy needs for heating, cooling, DHW production and mechanical ventilation,
deducing any contributions from local renewable energy sources. In order to convert
useful energy into primary energy in the calculation of Ntc , useful energy is divided by
the efficiency of the respective technical system, converting it into final energy, and then
multiplied by a conversion factor depending on the energy source which converts final
energy into primary energy. With that calculation, it was checked if the previously existing
requirements were sufficient for a residential building to be considered nZEB or at least to
comply with any of its conditions. Table 4 shows that the standard dwelling, complying
with the requirements previously in force, fails to reach nZEB status at all of the eight
analyzed locations.Sustainability 2021, 13, 8277 8 of 21
Table 4. Results of the regulatory calculation applying the requirements previously in force.
Envelope U-Values [W/(m2 .K)] Renewable Energy Nic Ni Ntc Nt
% of Renew
Locations External Supplied by Solar [kWh/ [kWh/ Nic /Ni [kWhEP/ [kWhEP/ Ntc /Nt
Floor Roof Windows Energy
Walls Collectors [kWh/year] (m2 .year)] (m2 .year)] (m2 .year)] (m2 .year)]
Porto 0.50 0.46 0.38 2.80 1365 50.99 65.57 77.76% 156.51 239.72 65.29% 8.68%
Lisboa 0.50 0.46 0.38 2.80 1503 30.71 44.42 69.14% 110.82 192.99 57.42% 12.88%
Batalha 0.40 0.46 0.32 2.40 1476 62.25 77.87 79.94% 181.48 268.33 67.63% 8.14%
Viseu 0.40 0.46 0.32 2.40 1411 65.99 82.86 79.64% 192.68 283.95 67.86% 7.39%
Portalegre 0.40 0.46 0.32 2.40 1504 63.84 77.34 82.54% 205.08 286.81 71.50% 7.40%
Melgaço 0.34 0.46 0.27 2.20 1365 99.34 113.43 87.58% 277.4 355.3 78.07% 5.09%
Guarda 0.34 0.46 0.27 2.20 1428 97.51 112.07 87.01% 271.01 354.47 76.45% 5.43%
Macedo de
0.34 0.46 0.27 2.20 1335 76.85 91.32 84.15% 228.11 307.89 74.09% 6.00%
CavaleirosSustainability 2021, 13, 8277 9 of 21
None of the three conditions necessary to be considered an nZEB (which are Nic /Ni ≤
75%, Ntc /Nt ≤ 50% and a percentage of renewable energy contribution ≥ 50% of primary
energy needs) was met at seven of the eight locations.
In Lisboa, the dwelling meets the first condition Nic /Ni ≤ 75%. In the other seven
climate zones, changes were necessary. In Table 5, the U-values of the building envelope
that needed to be changed in order to achieve, as closely as possible, the requirement
for Nic /Ni ≤ 75% are highlighted in bold. Therefore, these new U-values represent, for
the standard dwelling, the maximum values that still allow reaching nZEB status. Other
changes were needed too, namely, the definition of efficient technical systems and the
increase of local renewable energy contribution in order to meet the second condition,
Ntc /Nt ≤ 50%. The same split air conditioning system was installed for space heating
and cooling, in all cases. In what concerns heat pumps for water heating and photovoltaic
panels, the models and their number and size, for each climate zone, were chosen so that
the condition Ntc /Nt ≤ 50% could be met with the lowest margin possible, thus showing
the impact of nZEB status on the minimum requirements for these systems.
Table 5 shows that the third condition for a building to be considered nZEB, local
renewable energy covering at least 50% of primary energy needs, was achieved with a
significant margin. Following a logical order of compliance with the first condition and after
that, with the second condition, which were both met with a minimum margin, a significant
margin occurred in the third criterion because the authors opted for high-efficiency models
of technical systems that works, in a low percentage, on electricity supplied by the grid and,
in a high percentage, on energy from a local renewable source, the air, reducing Ntc just
what was needed to comply with Ntc /Nt ≤ 50% but introducing a significant contribution
of renewables. This choice results in a minimum need of photovoltaic panels for the supply
of renewable energy. Other options of systems could lead to a high need of PV panels,
which is often not easy to manage.
Table 6 shows all the construction solutions of the building envelope used in the
analyzed cases, as well as the technical systems.
3.2. Second Phase-Dynamic Simulation of the Standard Dwelling Complying with
nZEB Requirements
After obtaining all the necessary parameters for minimum compliance with the nZEB
requirements, the performance of the standard dwelling was simulated, first in free-floating
regime, with no heating nor cooling, in order to assess passive comfort and after that, in
the regulatory nominal conditions which means that the HVAC system is permanently
in operation, 24 h a day, during the whole heating season and during the whole cooling
season, with setpoint temperatures of 18 ◦ C for heating and 25 ◦ C for cooling. The sec-
ond simulation gives an estimation of the energy needed to keep indoor environment
comfortable.Sustainability 2021, 13, 8277 10 of 21
Table 5. Results of the compliance with nZEB requirements (Nic , Ni , Ntc and Nt , in kWh/(m2 .year)).
Envelope U-Values [W/(m2 .K)] Renewable Energy
Nic /Ni Ntc /Nt % of Renew. Energy
Locations Supplied by Solar Collectors Nic Ni Ntc Nt
External Walls Floor Roof Windows (Sustainability 2021, 13, 8277 11 of 21
Table 6. Envelope construction solutions and technical systems.
U-Value
Envelope Solution Description
[W/(m2 ◦ C)]
Double wall with 15 cm + 11 cm hollow brick masonry, rendered in both faces with 2
0.50 cm cement mortar
with 8 cm non-ventilated air gap + 4 cm EPS, between walls
External walls 0.40 The same double wall with 6 cm non-ventilated air gap + 6 cm EPS, between walls
0.34 The same double wall with 4 cm non-ventilated air gap + 8 cm EPS, between walls
0.31 The same double wall with 4 cm non-ventilated air gap + 8 cm XPS, between walls
0.24 The same double wall with 12 cm XPS, between walls
20 cm gravel + 5 cm screed + 2 cm EPS + 10 cm reinforced rigging + 5 cm light
0.46
concrete + 2 cm leveling screed + 1 cm ceramic coating
Floor
0.36 The same floor solution, with 4 cm XPS
0.29 The same floor solution, with 6 cm XPS
Pitched roof with ceramic tiles and slab: 2 cm mortar cement coating + 25 cm hollow
0.38
blocks and concrete ribs slab + 8 cm XPS
Roof
0.32 The same roof with 10 cm XPS
0.27 The same roof with 12 cm XPS
Window with a double glass, 6 mm spacing between glasses, with an external roller
2.80
shutter and a shutter box with high air permeability
Windows [22] 2.40 The same window with 16 mm spacing between glasses
The same window with 16 mm spacing between glasses, but with a shutter box with
2.20
low air permeability
Window with double glass with low emissivity,16 mm spacing between glasses and
2.00
a shutter box with low air permeability
Technical systems Model Solution description
240 PE Photovoltaic panels-peak energy BLK series, 240 W
PV panels [23] 245 PE Photovoltaic panels-peak energy BLK series, 245 W
260 PE Photovoltaic panels REC peak energy BLK series, 260 W
Split150 DHW Heat pump Split model 150, with COP: 3.78
Split200 DHW Heat pump Split model 200, with COP: 3.99
Heat pump [24–26]
IN200 DHW Heat pump IN model 200, with COP: 3.34
IN230 DHW Heat pump IN model 230, with COP: 3.02
Residential Split Air Conditioning 2.5 kW R32, with EER (Cooling): 3.57; COP
AC Split
(Heating): 3.81 [27]
Figure 3 shows the degree-hours of discomfort for each location, when the dwelling
is in free-floating regime. Figure 3a, gives the daily sum of degree-hours, over the year,
with the negative values representing the cold-induced discomfort and the positive values
representing the heat-induced discomfort. Figure 3b shows the annual sum of the degree-
hours of discomfort for cold (heating season) and for heat (cooling season), as well as the
total values.
Table 7 shows the values of the useful energy needs calculated through the quasi-
stationary method of the regulation and through dynamic simulation and values of PV
production calculated through the SCE.ER spreadsheet and through dynamic simulation.
It should be noted that the quasi-stationary method of Portuguese regulation tends to
overestimate heating needs for all the regions, except the two coldest ones. In contrast, the
cooling needs are highly underestimated. The variations found in the values of PV energy
production are minor.Sustainability 2021, 13, 8277 12 of 21
Sustainability 2021, 13, x FOR PEER REVIEW 11 of 21
Degree-hours
Figure3.3.Degree-hours
Figure ofof discomfort
discomfort without
without heating
heating or cooling:
or cooling: (a) daily
(a) daily sum,sum,
over over the year,
the year, with negative
with negative valuesvalues
indi-
indicating
cating discomfort
discomfort due
due to to cold
cold and positive
and positive values
values indicating
indicating discomfort
discomfort due
due to to heat;
heat; (b) seasonal
(b) seasonal and annual
and annual sum sum of
of de-
gree-hours of discomfort
degree-hours (absolute
of discomfort values).
(absolute values).
Table 7. Values of the useful energy needs
Table calculated
7 shows throughof
the values thethe
quasi-stationary
useful energy method
needsofcalculated
the regulation and through
through the quasi-
dynamic simulation and values of PV production calculated through the SCE.ER spreadsheet and through
stationary method of the regulation and through dynamic simulation and values of PV dynamic
simulation. production calculated through the SCE.ER spreadsheet and through dynamic simulation.
Useful Energy NeedsIt should be noted that the quasi-stationary method of Portuguese regulation tends to
Useful Energy Needs through Dynamic Simulation
through the Regulation
overestimate heating needs for2 .year)] PV Production
all the regions, except the two coldest ones.[kWh/year]
In contrast, the
[kWh/(m
Locations Method [kWh/(m2 .year)]
cooling needs are Variation
highly underestimated.
in
The variations found
Variation in (a)
in the values
(b)
ofVariation
PV energy from
Nic Nvc For Heating For Cooling
production are minor.
Relation to Nic Relation to Nvc SCE.ER Simulation (a) to (b)
Porto 48.77 3.38 38.68 −21% 15.22 +350% 374 334.3 −11%
Table
Lisboa 7. Values
30.71of the useful
10.75 energy10.13
needs calculated
−67%through the quasi-stationary
59.48 +453%method of403the regulation
368.2 and through
−9%
dynamic simulation
Batalha 58.34 and1.64
values of PV production −calculated
45.20 23% through
9.95 the SCE.ER spreadsheet426and through
+507% 393.0dynamic sim-
−8%
ulation.
Viseu 61.81 3.82 56.52 −9% 29.23 +665% 388 393.8 1%
Portalegre 57.9 Energy
Useful 23.44 30.75
Needs through the −Useful
47% 72.75Needs through
Energy +210% Dynamic799 732.3 −8%
Melgaço 84.04 1.29 92.61 +10% 7.36 +471% 737 PV Production
654.1 −11%
Regulation Method Simulation
Guarda 83.73 2.67 85.49 +2% 19.92 +646% 770 [kWh/year]
696.4 −10%
[kWh/(m 2.year)] [kWh/(m2.year)]
Locations
Macedo de
67.94 8.23 67.00 −For
1% Variation
18.19 in For
+121%Variation
727in (a) 649.5(b) −11%
Variation
Cavaleiros
Nic Nvc Heat- Relation to Cool- Relation to SCE. Simu- from (a) to
ing Nic ing Nvc ER lation (b)
Porto 48.77 3.38 38.68 −21% 15.22 +350% 374 334.3 −11%Sustainability 2021, 13, 8277 13 of 21
3.3. Third Phase-Realistic Schedule for the Use of HVAC
The continuous use of HVAC systems is not common in Portuguese dwellings. Fur-
thermore, an nZEB is expected to provide a certain degree of passive comfort to users,
especially in mild climates. Thus, for the third phase of this study, it was established that
the HVAC system would only be used for heating and would be activated between 18:00
and 23:00, during the heating season. For cooling, natural ventilation is used during the
cooling season (June to September), whenever the indoor temperature is higher than the
outdoor temperature and if the outdoor temperature is at least 18 ◦ C, with a limit of four
air changes per hour.
Figure 4 shows the degree-hours of discomfort for each location with the usage
profile described. Figure 4a presents the daily sum of degree-hours, with the negative
values representing the cold-induced discomfort and the positive values the heat-induced
Sustainability 2021, 13, x FOR PEER REVIEW
discomfort. Figure 4b presents the annual sum of the degree-hours of discomfort due 13 of to
21
cold (heating season), due to heat (cooling season), as well as the total values. Figure 4 uses
the same graph scales as Figure 3, for a better comparison between the two situations.
Figure4.4.Degree-hours
Figure Degree-hoursofofdiscomfort
discomfortfor
forthe
thedefined
defined more
more realistic
realistic usage
usage profile:
profile: (a)(a) daily
daily sum,
sum, over
over thethe year,
year, with
with nega-
negative
tive values indicating discomfort due to cold and positive values indicating discomfort due to heat; (b) seasonal
values indicating discomfort due to cold and positive values indicating discomfort due to heat; (b) seasonal and annual and an-
nual sum of degree-hours of discomfort (absolute
sum of degree-hours of discomfort (absolute values). values).
Figure 33; and
Figures Figure 4 show
4 show the the degree-hours
degree-hours of discomfort,
of discomfort, throughout
throughout the2424hhofofthe
the the
day. Figure
day. Figure 55shows
showsthe thedegree-hours
degree-hoursofof
discomfort, forfor
discomfort, thethe
realistic usage
realistic profile
usage but only
profile but
during the occupancy hours, which were considered to be between 18:00 and 07:00. Figure
5 does not use the same graph scales as the previous figures, in order to visualize the data
better since the numbers are considerably lower.Sustainability 2021, 13, 8277 14 of 21
Sustainability 2021, 13, x FOR PEER REVIEW 14 of 21
only during the occupancy hours, which were considered to be between 18:00 and 07:00.
Figure 5 does not use the same graph scales as the previous figures, in order to visualize
the data better since the numbers are considerably lower.
Figure5.
Figure 5. Degree-hours
Degree-hours ofof discomfort
discomfort for
for the
the defined
defined more
more realistic
realistic usage
usage profile,
profile,when
whenthe
thedwelling
dwellingisisoccupied:
occupied: (a)
(a) daily
daily
sum,over
sum, overthe
theyear,
year,with
withnegative
negativevalues
valuesindicating
indicatingdiscomfort
discomfort due
due toto cold
cold and
and positive
positive values
values indicating
indicating discomfort
discomfort duedue
to
to heat;
heat; (b) (b) seasonal
seasonal andand annual
annual sumsum of degree-hours
of degree-hours of discomfort
of discomfort (absolute
(absolute values).
values).
As expected,
As expected,the
therealistic
realisticusage
usage profile
profile leads
leads to atoconsiderable
a considerable reduction
reduction in heating
in heating and
and cooling
cooling energy
energy consumption
consumption compared
compared to the to the regulatory
regulatory nominal nominal conditions
conditions of con-
of continuous
tinuoususe.
HVAC HVAC
Tableuse. Table that
8 shows 8 shows that reduction
reduction for each location.
for each location.
However, there are still periods of discomfort during the occupancy hours, which vary
Table 8. Energy consumption, in kWh/year,
in intensity in regulatory
depending on thenominal
climate.conditions,
Therefore, with
it isa necessary
realistic HVAC schedule and
to investigate the for
energy
ensuring occupancy thermal comfort.
consumption needed to provide comfort through the HVAC system, during the whole
period of occupancy, in addition to the possibility of using natural ventilation for cooling.
Regulatory
Loca- Realistic HVAC Variation in Rela- Occupancy Variation in Rela-
End Use Nominal
tion Schedule tion to (A) Comfort tion to (A)
Conditions (A)
Heating 931.40 431.85 −53.6% 756.34 −18.8%
Porto Cooling 391.26 0.00 −100.0% 60.58 −84.5%
I1V2 Heat-
1322.66 431.85 −67.3% 816.92 −38.2%
ing+Cooling
Lisboa Heating 243.90 84.76 −65.2% 191.82 −21.4%
I1V3 Cooling 1528.67 0.00 −100.0% 552.45 −63.9%Sustainability 2021, 13, 8277 15 of 21
Table 8. Energy consumption, in kWh/year, in regulatory nominal conditions, with a realistic HVAC schedule and for
ensuring occupancy thermal comfort.
Regulatory Realistic
Variation in Occupancy Variation in
Location End Use Nominal HVAC
Relation to (A) Comfort Relation to (A)
Conditions (A) Schedule
Heating 931.40 431.85 −53.6% 756.34 −18.8%
Porto
Cooling 391.26 0.00 −100.0% 60.58 −84.5%
I1V2
Heating+Cooling 1322.66 431.85 −67.3% 816.92 −38.2%
Heating 243.90 84.76 −65.2% 191.82 −21.4%
Lisboa
Cooling 1528.67 0.00 −100.0% 552.45 −63.9%
I1V3
Heating+Cooling 1772.57 84.76 −95.2% 744.27 −58.0%
Heating 1088.45 518.59 −52.4% 908.24 −16.6%
Batalha Cooling 255.66 0.00 −100.0% 78.26 −69.4%
I2V1 Heating+Cooling 1344.11 518.59 −61.4% 986.50 −26.6%
Heating 1361.12 681.18 −50.0% 1129.52 −17.0%
Viseu
Cooling 751.34 0.00 −100.0% 182.99 −75.6%
I2V2
Heating+Cooling 2112.46 681.18 −67.8% 1312.51 −37.9%
Heating 740.45 342.28 −53.8% 621.50 −16.1%
Portalegre
Cooling 1869.80 0.00 −100.0% 984.30 −47.4%
I2V3
Heating+Cooling 2610.25 342.28 −86.9% 1605.80 −38.5%
Heating 2230.23 1227.58 −45.0% 1915.28 −14.1%
Melgaço I3V1 Cooling 189.24 0.00 −100.0% 30.93 −83.7%
Heating+Cooling 2419.47 1227.58 −49.3% 1946.21 −19.6%
Heating 2058.74 1136.23 −44.8% 1755.28 −14.7%
Guarda
Cooling 511.95 0.00 −100.0% 176.68 −65.5%
I3V2
Heating+Cooling 2570.69 1136.23 −55.8% 1931.96 −24.8%
Macedo de Heating 1613.48 845.26 −47.6% 1345.73 −16.6%
Cavaleiros Cooling 467.55 0.00 −100.0% 121.62 −74.0%
I3V3 Heating+Cooling 2081.03 845.26 −59.4% 1467.35 −29.5%
3.4. Fourth Phase–Energy Consumption Needed to Ensure Thermal Comfort during Occupancy
The results presented in the previous point, through Figure 5, shows that the degree-
hours of discomfort during periods of occupancy, assuming a more realistic usage profile,
are quite low, offering a very significant reduction in energy consumption. However, there
is still some discomfort. Thus, another simulation was carried out to estimate the energy
consumption needed to eliminate discomfort during occupancy. Natural ventilation is also
used in periods where it is possible to guarantee comfort through this passive strategy.
Table 8 shows the energy consumption using the HVAC system, during the occupancy,
in such a way that ensures thermal comfort to the users. In these conditions, since the
HVAC system is only used in the occupancy periods, the values of energy consumption
are obviously lower than the ones of the regulatory nominal conditions that correspond to
a continuous use of it.
3.5. Fifth Phase-Additional Passive Strategies for the Most Critical Locations
By analyzing the results for all the locations, presented in Figures 3–5, it is possible to
notice that Melgaço and Guarda present significant cold-induced discomfort. In contrast,
Portalegre presents high heat-induced discomfort. In order to reduce discomfort in these
three locations, some additional passive strategies were tested.
For Melgaço and Guarda, which have more significant discomfort due to cold, the
strategy used was to increase the glazing area on the south façade to enhance solar passive
gains during the heating season. Two attempts were made for each location: in the first
attempt, the three windows in the living room and the two windows in the en suite
bedroom were enlarged to a width of 1.5 m; in the second attempt, the width of these same
windows was increased to 1.6 m. The height was kept at its original value of 1.15 m.
Table 9 shows the results of the attempts to reduce cold discomfort in the cases of
Melgaço and Guarda. As expected, in addition to reducing cold-induced discomfort inSustainability 2021, 13, 8277 16 of 21
winter, there is a slight increase in discomfort due to heat in summer. However, the total
degree-hours of discomfort presents a reduction of about 20% in both locations, for the
larger glazing dimensions. The values of discomfort due to cold are much higher than
the ones of discomfort due to heat, so the tested strategy results in a significant general
comfort gain. In addition to improving occupant comfort conditions, it was also possible
to reduce around 24% in energy consumption for heating, which further confirms this
strategy benefits in these two cold winter climate zones.
Table 9. Results of attempts to reduce the degree-hours of discomfort at the most critical locations.
Realistic HVAC
First Attempt Second Attempt
Schedule
Due to cold 3162.85 2604.38 −17.7% 2491.83 −21.2%
Degree-hours of
discomfort during Due to heat 46.14 63.40 37.4% 67.31 45.9%
Melgaço occupancy
I3V1 Total 3208.99 2667.78 −16.9% 2559.14 −20.3%
Heating energy consumption
1227.58 982.64 −20.0% 937.54 −23.6%
[kWh/year]
Due to cold 2793.62 2208.94 −20.9% 2086.36 −25.3%
Degree-hours of
discomfort during Due to heat 339.81 399.67 17.6% 416.26 22.5%
Guarda occupancy
I3V2 Total 3133.43 2608.60 −16.7% 2502.62 −20.1%
Heating energy consumption
1136.23 908.01 −20.1% 858.11 −24.5%
[kWh/year]
Due to cold 983.17 983.24 0.0% 989.372 0.6%
Degree-hours of
discomfort during Due to heat 2922.77 2295.76 −21.5% 2258.32 −22.7%
Portalegre occupancy
I2V3 Total 3905.94 3279 −16.1% 3247.69 −16.9%
Heating energy consumption
342.28 342.31 0.0% 344.25 0.6%
[kWh/year]
For the case of Portalegre, the strategy used to reduce degree-hours of discomfort due
to heat was to increase the rate of natural ventilation. In the first attempt, the air change
rate goes from 4 ach to 6 ach, with the same criteria defined in the third phase of the study.
In the second attempt, in addition to this modification, the period for the use of natural
ventilation and the shading of glazing during the day in summer months is also changed to
reduce heat gains: they are used from May to October, instead of from June to September,
as before.
Table 9 shows the results of the attempts to reduce discomfort due to heat in the
case of Portalegre. In both attempts, there is a significant reduction of degree-hours of
discomfort due to heat, a total reduction of more than 16%. Since the aforementioned
strategies are applied only in summer, there is no negative effect in winter, i.e., no increase
of degree-hours of discomfort due to cold nor of heating energy consumption.
In addition to reducing the degree-hours of discomfort in the three most critical
locations, it is also possible to obtain a reduction in energy consumption for the HVAC
system, as shown in Table 10.Sustainability 2021, 13, 8277 17 of 21
Table 10. HVAC energy consumption, in kWh/year; in the scenarios with additional passive strategies, compared to energy
consumption in regulatory nominal conditions and to energy consumption for ensuring occupancy thermal comfort before
the passive strategies.
Regulatory
Passive Variation Occupancy Variation
Location End Use Nominal
Strategies (A) (A-B)/B Comfort (C) (A-C)/C
Conditions (B)
Heating 1514.87 2230.23 −32.1% 1915.28 −20.9%
Melgaço I3V1 Cooling 45.69 189.24 −75.9% 30.93 47.7%
HVAC 1560.56 2419.47 −35.5% 1946.21 −19.8%
Heating 1353.46 2058.74 −34.3% 1755.28 −22.9%
Guarda I3V2 Cooling 214.78 511.95 −58.0% 176.68 21.6%
HVAC 1568.24 2570.69 −39.0% 1931.96 −18.8%
Heating 625.08 740.45 −15.6% 621.50 0.6%
Portalegre I2V3 Cooling 826.91 1869.80 −55.8% 984.30 −16.0%
HVAC 1451.99 2610.25 −44.4% 1605.80 −9.6%
With the implementation of passive strategies and the HVAC system used only during
occupancy hours, the results show a reduction in the HVAC energy consumption that
varies from 35% to more than 44% compared to the use in regulatory nominal conditions,
before the passive measures. Comparing this to the results before the passive strategies
but also using HVAC only during occupancy hours (“Occupancy comfort”, in Table 10),
it is possible to observe a reduction in heating energy consumption of more than 20%, in
Melgaço and Guarda, which, even with an increased consumption for cooling, generates
total savings of almost 20% in both cases. In Portalegre, the energy consumption for cooling
has a reduction of 16%, just by applying simple passive measures. Total savings are of
almost 10%.
Table 11 shows, for the several studied scenarios, the percentage of useful energy
needs for heating, cooling and DHW that is supplied by local renewable energy sources.
Table 11. Percentage of the useful energy needs for heating, cooling and DHW that is supplied by local renewable
energy sources.
Location Regulatory Nominal Conditions Realistic HVAC Schedule Occupancy Comfort
Porto
74.2% 74.7% 74.5%
I1V2
Lisboa
73.7% 75.0% 74.3%
I1V3
Batalha
75.1% 75.8% 75.4%
I2V1
Viseu
74.7% 75.7% 75.2%
I2V2
Portalegre
72.9% 73.6% 73.2%
I2V3
Melgaço
73.5% 73.5% 73.5%
I3V1
Guarda
72.5% 72.2% 72.5%
I3V2
Macedo de Cavaleiros
73.3% 73.4% 73.4%
I3V3Sustainability 2021, 13, 8277 18 of 21
4. Discussion
The first point to discuss is the impact of minimum nZEB requirements on the con-
struction solutions. As shown by the results, the standard dwelling, in seven of the eight
analyzed locations, would not comply with nZEB first condition (Nic /Ni ≤ 75%) if it
complied only with the minimum regulatory requirements for the maximum allowable
U-values. Nic , meaning the annual nominal needs of useful energy for heating, depends
mostly on the building heat exchanges by transmission through its envelope and by ven-
tilation. A more demanding requirement on Nic leads to the need of increasing thermal
insulation of the envelope elements. In Table 5, the changes needed are highlighted and
in Table 6, the corresponding construction solutions are presented. Only for Lisboa, no
changes were needed. For the coldest winter climate zone, the U-value of the walls changed
from 0.34 to 0.24 W/(m2 ◦ C), with 12 cm of XPS, which is a very unusual wall insulation
thickness for Portugal. In some cases, also the window solutions had to change. These are
welcome changes, as long as buildings are conceived and used in the right conditions in
what concerns three determinant factors: thermal inertia, solar protection and ventilation.
A high level of insulation may lead to an overheating problem in summer if solar gains
are not limited and/or thermal mass is not available and/or ventilation is not used in a
way it can contribute for cooling. The balance between these factors is critical and sensitive.
Designers must be aware of this fact when nZEB standards are implemented.
Through the comparison of the results obtained with the quasi-stationary method
of the regulation to the results of hourly dynamic simulations (Table 7) it is clear that the
current regulatory method gives a good approximation to the simulated values, for the
heating season. However, in the cooling season, it fails to express the highly variable
climate conditions and it underestimates the cooling energy needs by a great margin. This
point shows the need for an update of the regulatory calculation method, which will be
defined soon through new ordinances, already announced in [28]. The adoption of the
dynamic simulation is foreseen.
As stated before, the usage conditions of Portuguese households are far from the nom-
inal conditions considered by the regulation. Certainly, a general regulation must define
some nominal conditions and based on them, establishes the recommendable requirements.
It would be difficult and even questionable to do it in any other way. However, in order to
analyze the impact of those requirements in the actual use of the buildings, some different
scenarios must be tested. Taking into account that a great part of Portuguese residential
buildings is never heated or cooled by HVAC systems, it is important to simulate the free-
floating scenario in order to estimate the actual comfort conditions and after that, absolute
priority should be given to passive strategies and to local renewable energy sources that
could fulfill the remaining energy needs.
The degree-hours of discomfort in free-floating regime, without any use of the HVAC
system, leads to high levels of discomfort, especially in the harshest climates in the country
(Figure 3). Cold-induced discomfort is prevailing especially in I3 climate zone but for some
of the analyzed locations, like Lisboa and mostly Portalegre, the heat-induced discomfort
is dominant.
In a second step of the analysis, a different possible usage profile was considered,
with the use of heating in a certain period of the day, in winter. In summer, active cooling
was not considered, just passive cooling by reinforcing natural ventilation. This usage
profile was called the realistic HVAC schedule compared to the nominal conditions of
the regulation. Thus, the degree-hours of discomfort values are reduced to less than a
half of the previous ones (Figure 4). However, comfort analysis must take into account
occupancy. There is no real sense in providing comfort for unoccupied dwellings. Figure 4
is still analyzing discomfort for all the hours of the day and not only during periods of
occupancy. Those periods are a variable factor depending on the household, for obvious
reasons. However, it is evident that most dwellings are occupied especially from the end
of the afternoon to the early morning of the next day and taking this into consideration, a
theoretical period of occupancy was defined. Therefore, for the realistic HVAC scheduleSustainability 2021, 13, 8277 19 of 21
and for the period of occupancy, the analysis of the degree-hours of discomfort (Figure 5)
finds a reduction of the values to less than a quarter of the initial ones. However, it must be
noted that using the HVAC system, between 18:00 and 23:00, in the heating season, was
not enough to eliminate discomfort in occupancy hours.
Arriving at this point, it became necessary to check how much energy would be
necessary to eliminate discomfort in occupancy hours. A comparison between the energy
consumption by HVAC in the three different scenarios (regulatory nominal conditions,
realistic HVAC schedule and ensuring occupancy comfort) shows in Table 8 that ensuring
occupancy comfort through the HVAC system for both heating and cooling (using natural
ventilation for cooling in summer, whenever possible), presents a reduction in the energy
consumption of the HVAC system that varies from 19.6% to 58%, depending on the location,
when compared to the nominal conditions. As expected, the scenario of realistic HVAC
schedule, with HVAC working just five hours a day and only in the heating season presents
a greater energy consumption reduction varying from 49% to 95%.
It should also be noted that the three locations closest to the coast have lower rates
of discomfort, while the other regions located further inland and that also have a higher
altitude have higher levels of discomfort. To demonstrate that the designer can (and should)
carry out analyses of passive strategies to reduce levels of discomfort and, consequently,
energy consumption, modifications were made to the standard model in the two cases of
the greatest discomfort due to cold (Melgaço and Guarda) and in the case of the greatest
discomfort due to heat (Portalegre). To reduce the levels of discomfort due to the cold,
the strategy used was to increase the solar gains on the south façade by increasing the
glazing area, which did not represent great heat gains in summer due to the available
glazing solar protection. To reduce the levels of heat-induced discomfort, a higher rate
of natural ventilation and the extension of the period of use of it and of the use of solar
protection were tested. A significant reduction of discomfort was achieved with these
passive strategies.
The second and third nZEB conditions define a demanding frame that leads to the
choice of systems that are able to benefit from local renewable energy sources. As explained
before, the main criterion to define the technical systems, as well as the construction
solutions, used in this study was to comply with the minimum nZEB requirements by a
very short margin. Then in a building designed to reach nZEB status, a great variety of
uses may occur. Some of those uses were tested. In Table 11, the percentage of renewable
energy sources contribution is shown. In terms of useful energy needs for heating, cooling
and DHW, that contribution goes from 72% to almost 76%. This means that, depending
on the type of installed technical systems, the strict compliance with the minimum nZEB
requirements may lead to remarkable savings in the energy bill of the households.
5. Conclusions
Using the methodology of Portuguese regulation to evaluate the impact of nZEB
requirements on building envelope construction solutions, among the eight analyzed
locations in the different climate zones of the country, only for Lisboa no changes are
needed. In Lisboa, it is possible to meet the condition Nic /Ni ≤ 75%, when complying with
the current maximum allowable U-values. For the coldest regions, higher levels of thermal
insulation are needed. Thus, special attention must be given to summer conditions, because
of the overheating risk, particularly in regions where the coldest winter is combined with
the hottest summer.
In the study carried out, it became clear that the quasi-stationary method of the
regulation gives a good approximation of winter energy needs but fails to estimate summer
conditions with the same accuracy. A dynamic simulation is needed.
To evaluate the impact of nZEB requirements in the actual conditions of use of the
buildings, regulatory nominal conditions are not realistic. The behavior of the users is quite
complex and difficult to simulate. It is driven and most of the time, limited, by the economic
resources of the household but also by personal preferences. Thermal comfort conditionsYou can also read