The State of Pensions 2022 | Year End Update - RESEARCH BRIEF JANUARY 2023
←
→
Page content transcription
If your browser does not render page correctly, please read the page content below
JANUARY 2023

RESEARCH BRIEF

The State of Pensions 2022 | Year End Update

The Era of Volatility: Asset Shocks, Inflation, and War

ANTHONY RANDAZZO & JONATHAN MOODY
STATE OF PENSIONS 2022 | YEAR END UPDATE
The State of Pensions at the end of 2022 is Fragile.
The calendar year 2022 was not a great time to be managing pension fund assets. While a few hedge funds and
money managers successfully navigated the choppy and volatile investment waters of 2022, most lost money. Some
lost a lot. At one point during 2022, CalPERS was down around $80 billion from the $500 billion they'd started the
year with — and there were just 15 states that ended 2021 with more than $80 billion in total assets under
management.
Fortunately, the investment losses in 2022 didn't wipe out all the funded status gains from 2021. Unfortunately, the
sharp losses this year have exposed — yet again — the lack of resilience plaguing many public pension plans.
Once all public pension plans release their 2022 data, we estimate that the combined funded status for the top state
and local retirement systems will be 77.3% — factoring in estimates with data through December 31, 2022. This is
down from the 83.9% funded ratio during fiscal year 2021.
Looking ahead there are warning signs everywhere:
1. Most major public market indices are effectively flat over the last six months.
2. Private equity returns get reported on a lag of up to six months, and with each update in 2022 values were
coming down — which means 2022 numbers were including overstated private equity asset valuations and
2023 numbers are going to incorporate those losses.
3. The Federal Reserve is signaling more interest rate hikes with persisting inflation, war in Ukraine continues,
and the end of China’s Zero-Covid policy will create near-term pressures on global commerce in 2023.
This means that, to-date, it is unlikely that most pension funds are on track to hit their assumed rates of return for
2023, even if they do generate a positive overall return. Pension fund trustees should be considering lower
investment assumptions and state legislatures should be looking at larger contribution rates.
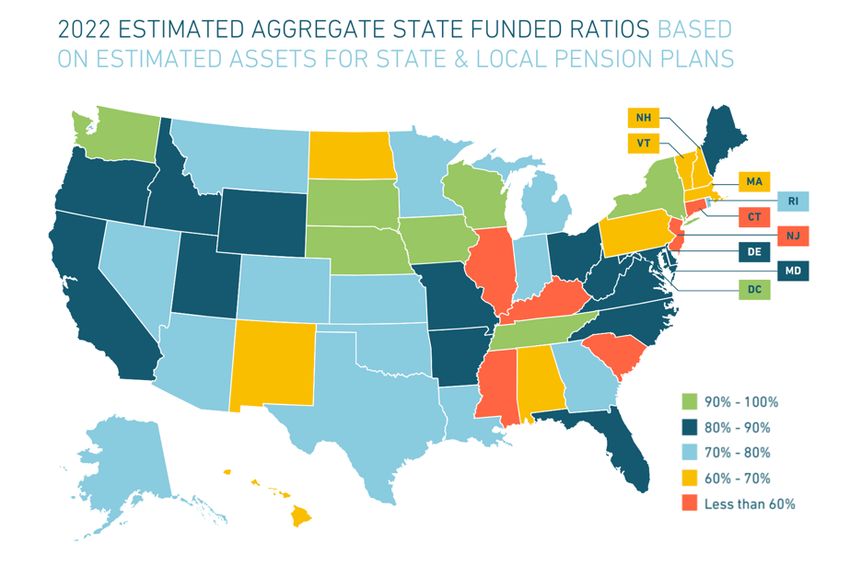
The national funded ratio average is projected to The total pension funding shortfall will increase
decline from 83.9% in 2021 to 77.3% in 2022. to $1.45 trillion in 2022, reversing the one-year
States and cities have made full contributions to their pension drip below the $1 trillion line in 2021.
funds and in many cases even provided supplemental
Strong investment returns in 2021 led to a decline in unfunded
contributions. But poor investment returns in 2022 have driven liabilities down to $986.6 billion. That pension debt has increased
down the average funded ratio for state and local plans. This is a back up to $1.45 trillion as of 2022’s calendar year end due to
loss of roughly half of last year’s improvement. poor investment returns. Better-than-expected performance
from private equity kept the increase from being larger.
1
STATE OF PENSIONS 2022 | YEAR END UPDATE
A -6.1% average investment return for the
2022 fiscal year has erased nearly half of the
funded ratio gains of 2021.
Preliminary 2022 investment returns show a -6.14% return
on average for state and local plans (for the 2022 fiscal year
as utilized by each plan, including data measured through
December 31). All systems are forecast to miss their
assumed return for the year, currently averaging 6.9%.
Last year’s incredible investment returns (24.8% on average)
did include some future returns that were “pulled forward”
and ultimately led to a market correction. The average return
for 2020-2022 is 7.1%; capital market forecasts suggest the
average return over the next decade is likely to be around 6%.
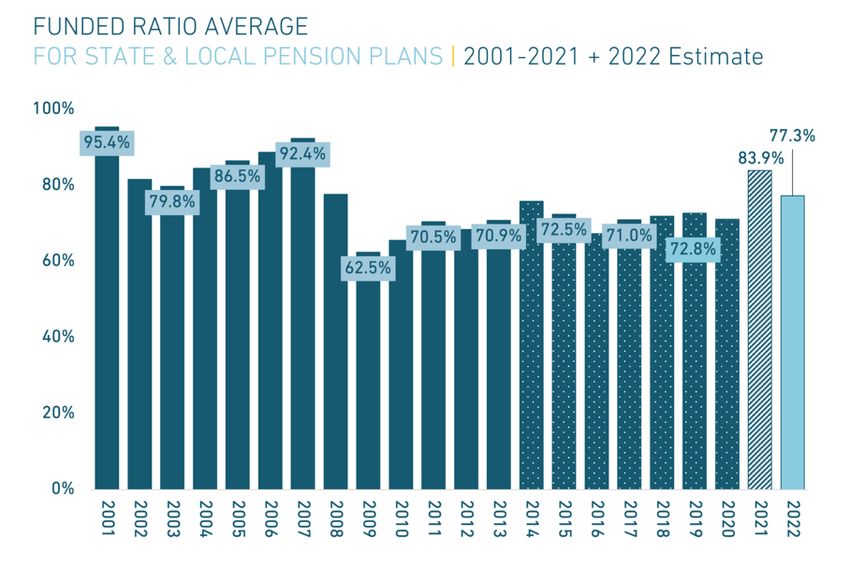
Most state and municipal pension plans in the
United States are distressed or fragile.
Within the states, funded ratios and unfunded liability levels
continue to vary considerably from state to state. For
example, in California the State Teachers’ Retirement
System is under 70% funded while the City of Los Angeles
Fire and Police Pension Plan is 98% funded.
A few state pension plans still report a Resilient funded
status (90% or better for three years continuously). However,
the vast majority of U.S. pension plans have a Fragile (90% to
60%) or Distressed (60% or less) funded status.
Please see page 3 of this report for a list of all states ranked
by funded ratio.
How This Update Changes Our Findings for State and Local Pension Plans:
• The average 2022 estimated rate of return shifted from -6.0% (as of data through September 30) to -6.14% after
factoring in reported preliminary returns and updated private equity data for the third quarter of 2022.
• The average 2022 funded ratio shifted from 77.9% (estimated as of June 30) to 77.3% based on updated return data
and recently published actuarial valuations.
• Total 2022 unfunded liabilities shifted from $1.4 trillion (estimated as of June 30) to $1.45 trillion based on updated
return data and recently published actuarial valuations.
• The average 2021 actual funded ratio shifted from 84.8% to 83.9% based on additional reported plan data.
• Total 2021 unfunded liabilities report shifted from $976.3 billion to $986.6 billion based additional reported plan data,
notably for California Public Employees’ Retirement System.
To read more about State of Pensions visit Equable.org/StateofPensions2022
2
STATE OF PENSIONS 2022 | YEAR END UPDATE

                           Funded Ratio Ranking, by State | 2022

                                  Funded          Unfunded                                                Funded          Unfunded
Rank               State           Ratio           Liability            Rank                State          Ratio           Liability
 1       District of Columbia     103.4%          -$323,351,808           27     Kansas                     76.4%        $8,270,645,616
 2       Washington               102.9%        -$4,006,809,472           28     Michigan                   75.5%       $32,950,344,720
 3       South Dakota             100.0%                        $0        29     Nevada                     75.1%       $18,054,893,568
 4       Tennessee                  99.5%          $330,451,520           30     Rhode Island               72.7%        $3,863,383,680
 5       Nebraska                   96.1%          $665,939,840           31     Montana                    72.4%        $4,344,711,168
 6       New York                   94.4%       $37,288,583,680           32     Georgia                    72.3%       $39,809,781,248
 7       Wisconsin                  93.2%       $10,018,704,512           33     Colorado                   72.2%       $26,397,374,336
 8       Iowa                       90.9%        $4,339,720,704           34     Arizona                    71.8%       $26,996,553,952
 9       North Carolina             88.8%       $14,425,116,672           35     Alaska                     71.3%        $6,763,752,448
 10      Delaware                   88.8%        $1,367,923,712           36     Louisiana                  71.1%       $21,530,430,224
 11      Maine                      87.2%        $2,678,935,552           37     Indiana                    70.0%       $14,527,537,152
 12      West Virginia              86.2%        $2,715,104,768           38     Hawaii                     68.5%       $11,190,476,800
 13      Utah                       86.0%        $6,244,379,112           39     Massachusetts              67.9%       $35,140,395,008
 14      Oregon                     84.5%       $15,312,052,224           40     Alabama                    67.3%       $21,070,035,072
 15      Virginia                   83.8%       $20,445,987,136           41     New Mexico                 66.3%       $16,214,644,736
 16      Florida                    83.3%       $36,957,610,240           42     Pennsylvania               65.3%       $63,830,526,208
 17      Idaho                      83.1%        $3,938,758,656           43     New Hampshire              65.1%        $5,736,130,560
 18      Arkansas                   82.9%        $7,327,147,776           44     Vermont                    61.9%        $3,355,864,768
 19      Wyoming                    82.6%        $1,951,591,424           45     North Dakota               60.1%        $4,427,750,400
 20      Ohio                       82.1%       $50,128,445,824           46     Mississippi                59.9%       $20,583,639,040
 21      Missouri                   81.6%       $17,675,925,568           47     South Carolina             57.8%       $27,865,324,032
 22      Maryland                   81.3%       $16,664,515,328           48     Connecticut                51.5%       $41,852,312,448
 23      California                 80.0%     $274,801,209,642            49     New Jersey                 50.1%     $100,052,413,440
 24      Texas                      78.9%       $84,597,283,200           50     Illinois                   50.0%     $209,967,487,488
 25      Minnesota                  77.9%       $22,457,894,528           51     Kentucky                   47.3%       $42,259,716,736
 26      Oklahoma                   77.9%       $10,430,485,248

     Data for each state includes statewide plans and large municipally managed plans (those with at least $1 billion in liabilities).

                       Funded ratio rankings for individual pension plans are available at
                                    Equable.org/PensionPlanFundedRatios

                                                                                                                                          3
STATE OF PENSIONS 2022 | YEAR END UPDATE
WHAT IS INCLUDED IN THIS UPDATE?
When we published State of Pensions in July 2022, there were still 31 state or local retirement systems that had not released
data for the fiscal year ending 2021. These plans amounted to 16.8% of anticipated accrued liabilities for 2021, most of which is
related to CalPERS (although we did include their reported market valued asset data). Further, our July report relied almost
entirely on estimated investment returns using benchmarks for the various reported asset classes that pension funds were
using as of 2021.
Over the last six months most retirement systems have released new and updated data, including preliminary investment return
data for 2022 and actuarial valuations. This January 2023 update uses those reports to include the following:
• Updated 2021 actual financial data (including the addition of actuarial valuation report data from 29 retirement systems
that represent 16.7% of the accrued liabilities in our dataset, which is nearly all outstanding data for the fiscal year).
Reports with 2021 data are still outstanding from one state system (Pennsylvania Municipal Retirement System) and an
assortment of municipal systems covered in our database.
• Updated 2022 estimates (using audited or preliminary investment returns from retirement systems, pension fund trusts,
and state treasurer or comptroller offices). As of this update, 76.4% of retirement systems (172 of 225 with available
data) reported preliminary investment returns for their full fiscal 2022. Nearly all of the remaining plans have fiscal years
ending December 31. For the remaining plans, 35 (15.6% of total plans) provided partial year returns for 2022, which we
combined with benchmark returns to estimate a fiscal year return. The other 18 plans (8.0% of total plans) have not
reported any investment performance for fiscal 2022, meaning that their estimates are based entirely on respective asset
allocations and asset class benchmark returns.
For this update, there were no additional retirement systems or pension plans added to the database of 228 entities from
Equable Public Retirement Research Database that were covered in the report. Three municipal plans did not provide enough
data to provide roll-forward estimate in this update: Omaha Police and Fire, Providence ERS, and Nashville-Davidson ERS.
Note: This report is not estimating mid-2023 fiscal year funded status. We use investment data through December 31 to estimate
returns for defined benefit plans with fiscal years ending in August, September, or December that have not otherwise released
preliminary estimates of their own rates of return for the 2022 fiscal year.
ABOUT STATE OF PENSIONS
State of Pensions is Equable Institute's annual report on the status of statewide public pension systems, put into a historic
context. Governments face a wide range of challenges in general – and some of the largest are growing, and often unpredictable,
pension costs. State of Pensions analyzes trends in public pension funding, investments, contributions, cash flows, and benefits
for 228 of the largest statewide and municipal retirement systems in all 50 states to illuminate the scale and effects of these
challenges. Click here to access previous editions of State of Pensions, as well as additional data and resources.
ABOUT EQUABLE INSTITUTE
Equable Institute is a bipartisan nonprofit that works with public retirement system stakeholders to solve complex pension
funding challenges with data-driven solutions.
ABOUT THE AUTHORS
Anthony Randazzo (Executive Director) is a national expert on public sector pension policy and has provided technical
assistance to more than a dozen states and cities on ways to improve retirement plan sustainability.
Jonathan Moody, PhD (Vice President for Research) has developed a wide range of academic and policy research on municipal
finance subjects, including state budgeting and reserve funds, state credit ratings, state fiscal management, and public
retirement benefits.
MEDIA CONTACT: Sam Shaw, Vice President of Communications | sam@equable.org | +1 646-470-0824
4You can also read