COVID-19 PANDEMIC AND UNEMPLOYMENT: EVIDENCE FROM MOBILE PHONE DATA IN CHINA - TENGLI PANLEJIABARWICK YONGHENGDENG XINFEIHUANG SHANJUNLI - ABFER
←
→
Page content transcription
If your browser does not render page correctly, please read the page content below
COVID-19 Pandemic and
Unemployment: Evidence from
 Mobile Phone Data in China
 Teng Li Panle Jia Barwick Yongheng Deng
 Xinfei Huang Shanjun Li

 1
CONTENTS

 1. Introduction
 2. Background and Data
 3. Empirical Framework
 4. Main Results
 5. Conclusion

 2
1. INTRODUCTION

 Impact of the COVID-19 pandemic on Unemployment?

 Effective and targeted
 RELY ON
 policies to address the Prompt and accurate
 adverse consequences of the measures of the labor
 COVID-19 pandemic for the market effects
 economy

 3
1. INTRODUCTION
 Prompt and accurate measures HOWEVER Traditional Measures are
 of the labor market effects based on Surveys

In China ROUTINELY
Measuring unemployment accurately is
particularly challenging due to 1. The substantial
 SPECIFICALLY time lag
 1. A large fraction of the population
 excluded from the unemployment 2. Limited
 surveys availability for
 2. Reporting and aggregation errors small geographic
 areas

 4
1. INTRODUCTION
 High-frequency and high-
 Prompt and accurate measures resolution mobile phone
 of the labor market effects usage data in Guangdong

Merits
 1. Representative:mobile phone records The most populous
 for 71 million users and location tracking province in China,
 information for one million randomly with a GDP larger
 selected users than all but the top 12
 2. Period:from January 2018 to September countries in the world
 2020

 5
2. BACKGROUND AND DATA
Why Mobile Phone Data? It is particularly advantageous in China

 Because of the high cellphone penetration rate

 1. According to the 2018 China Family Panel Studies, a nationally representative
 longitudinal survey of individuals’ social and economic status, 89% of
 correspondents sixteen years and older reported possessing a cellphone.

 2. In addition, each household owns 2.5 cell phones on average (National Bureau of
 Statistics 2018).

 6
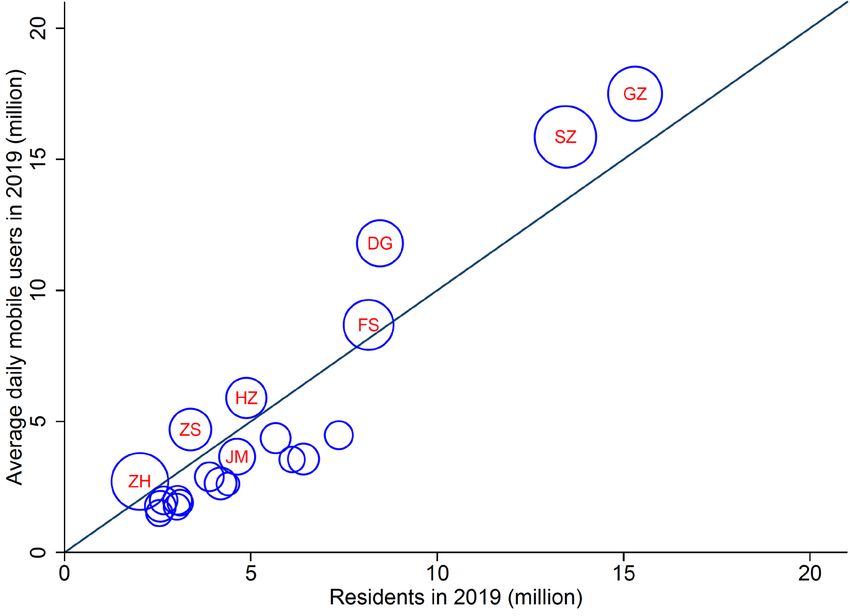
2. BACKGROUND AND DATA
Why Mobile Phone Data? It is particularly advantageous in China

 Because of the high cellphone
 penetration rate

 Figure A.1 shows a strong correlation
 between the number of phone users and
 the number of residents by city.

 Figure A.1. Mobile users vs.
 Cities with a higher GDP per capita
 residents in 2019 (represented by the size of the circles in
 Figure A.1) tend to have higher mobile
 phone ownership.

 7
2. BACKGROUND AND DATA
Why in Guangdong? It is highly relevant

 The most populous province with the largest provincial GDP in China

1. Guangdong contributes to 11% of China’s GDP and around a quarter of China’s
foreign trade (China Statistical Yearbook 2020).

2. The number of daily confirmed COVID cases are under a few handfuls since the full
reopening, similar to most other provinces in China.

Our measures on the pandemic’s consequences could apply to other regions as well.

 8
2. BACKGROUND AND DATA
Why in Guangdong? It is highly relevant

 The number of daily confirmed
 Figure A.2. Newly confirmed COVID- COVID cases are under a few
 19 cases in Guangdong province handfuls since the full reopening,
 similar to most other provinces
 in China.

 Our measures on the
 pandemic’s consequences
 could apply to other regions as
 well.

 9
2. BACKGROUND AND DATA
 Data Resources

Our data come from a dominant cellular service provider in China

1. We have access to detailed phone usage (encrypted IDs of the calling party and the
 receiving party, date of calls, and call duration in seconds) for all of its 71 million
 users in Guangdong Province from January 2018 to September 2020, accounting for
 63% of all mobile users in the province.

2. We observe some user demographic information, such as age, gender, and the place
 where the phone number is registered. In addition, we have access to the location
 records every five-minute interval for one million randomly selected users during
 the same period.

 10
2. BACKGROUND AND DATA
 Unemployment Measures
We leverage two features of the mobile phone data to construct unemployment measures

 WORK COMMUTING CALLS TO UNEMPLOYMENT HOTLINE
 Reductions in the number of people The number of individuals calling the
 working on-site before and after the designated government hotline (12333) for
 lockdown and relative to 2019 unemployment benefits

 11
2. BACKGROUND AND DATA
Unemployment Measures WORK COMMUTE

We use increase in the number of non-commuters before and after the lockdown
and relative to 2019 as our major measure of pandemic-induced unemployment.

1. We define the work location as the location where a user spends at least 5 hours a
 day between 9 am and 6 pm for at least fifteen workdays in a given month.

2. Changes in commuting patterns provides valuable barometer of changes in
 unemployment, especially when participation in the unemployment benefit
 programs is low (as is the case in China).

 12
2. BACKGROUND AND DATA

 Figure 1. The number of people commuting by commuting distance

 13
2. BACKGROUND AND DATA
 (A) Weekdays (B) Weekends

Figure A.3. Differences in (log) population during daytime and nighttime in Guangzhou

 14
2. BACKGROUND AND DATA
Unemployment Measures UNEMPLOYMENT BENEFIT CLAIMS

 Figure 2. Correlation of Baidu index between keywords
 12333 Unemployment Insurance
 of “12333” and “unemployment insurance” in
 Guangdong province

 The correlation of the Baidu Index
 of the two keywords is 0.83 during
 the sample period. The co-
 movement of the index for the two
 keywords offers additional support
 for using the 12333 hotline as a
 proxy for individuals claiming
 unemployment benefits.

 15
2. BACKGROUND AND DATA
Unemployment Measures UNEMPLOYMENT BENEFIT CLAIMS

 Figure A.4. Unemployment rate by city in 2019 based
 on the number of individuals making unemployment
 calls

 The correlation between city-level
 unemployment calls and the official
 unemployment rate released by the
 NBS, which is only available
 annually for city-level statistics, is
 reasonably high at 0.7 in 2019.

 16
2. BACKGROUND AND DATA
 Sample Construction

1. Our main analysis excludes users under the age of 18, and results excluding users
 under the age of 25 (to eliminate those still in school) are almost identical.

2. We define migrants as individuals who registered their phone numbers outside
 Guangdong province.

3. We only count the first time when a user reaches out to the unemployment benefit
 hotline.

 17
2. BACKGROUND AND DATA
Descriptive Analysis
 Jan.23 Feb.24 May 9

 60 days 32 days 76 days 144 days
 Before Lockdown Phase I Phase II Reopening
 Reopening

 People were allowed to go All businesses, including shopping
 back to work and visit malls, supermarkets, and restaurants,
 outdoor public places. were allowed to reopen fully. (The only
 exception was movie theaters)

 18
2. BACKGROUND AND DATA
 Our analyses use a standard DID framework and exploit differences in our two
 key measures of labor market outcomes between 2020 (the treatment group) and
 2019 (the control group).
 Jan.23 Feb.24 May 9

 60 days 32 days 76 days 144 days

 The Event Date
 Our analyses compare changes in labor market outcomes before and after the
 event date in 2020 with changes in labor market measures before and after the
 exact event date in 2019.

 19
3. EMPIRICAL FRAMEWORK
The standard difference-in-differences (DID) approach

 i denotes the treatment group t denotes the event-day (t = 0 stands for
(year 2020) or the control group January 23 in 2020 and February 3 in 2019)
 (year 2019)
 24

y = � � d � ∈ ∗ 10 + 1, + 1 ∗ 10 + + + + + (1)
 =−5
 (·) is an indicator
 c denotes a are event-study coefficients, variable for each 10-
 neighborhood (a capturing differences between the day interval of the
 cell-tower area) treatment group and the control group sample.

 20
3. EMPIRICAL FRAMEWORK
The standard difference-in-differences (DID) approach

 The holiday
 Neighborhood fixed effect
 fixed effects

y = ∑24
 =−5 � d � ∈ ∗ 10 + 1, + 1 ∗ 10 + + + + + (1)

 Group fixed
 effects 312 event-day
 fixed effects

 21
3. EMPIRICAL FRAMEWORK
 We also extend the model (1) to account for various heterogeneities

 = � ∈ 0, 252 � ′ + � ′ + ∈ 0, 252 � ′
 + � � ∈ 0, 252 + + + + + (2)

 Where is a vector of city attributes in 2019 and , , are corresponding
 coefficients.

 For example, could be a city’s labor share in each of the 13 major industries,
 dummies for the 21 cities, or a city’s export-over-GDP ratio.

 22
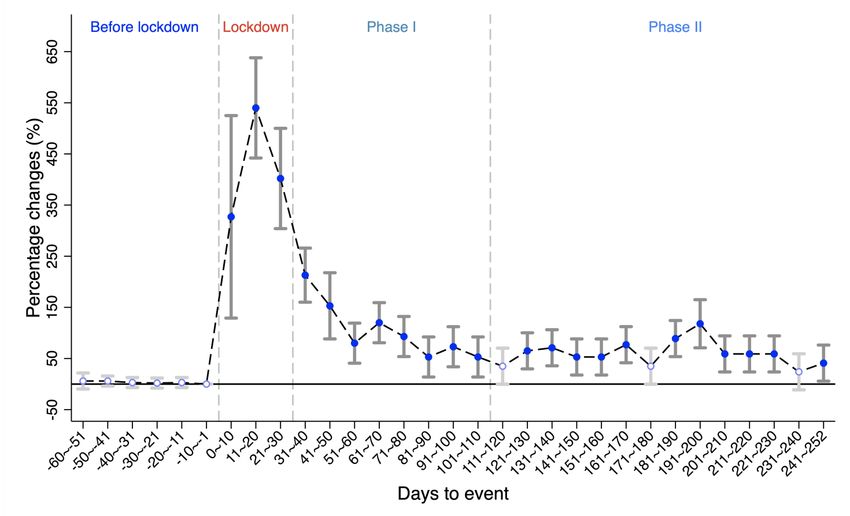
4. MAIN RESULTS
 1st Measure:Commuting
 Figure 3(a). Changes in the number of non-
 commuters between 2019 and 2020

 The increase gradually came
 down to about 50% by the
 end of Phase I reopening and
 the change remained stable
 even four months after Phase
 II.

 23
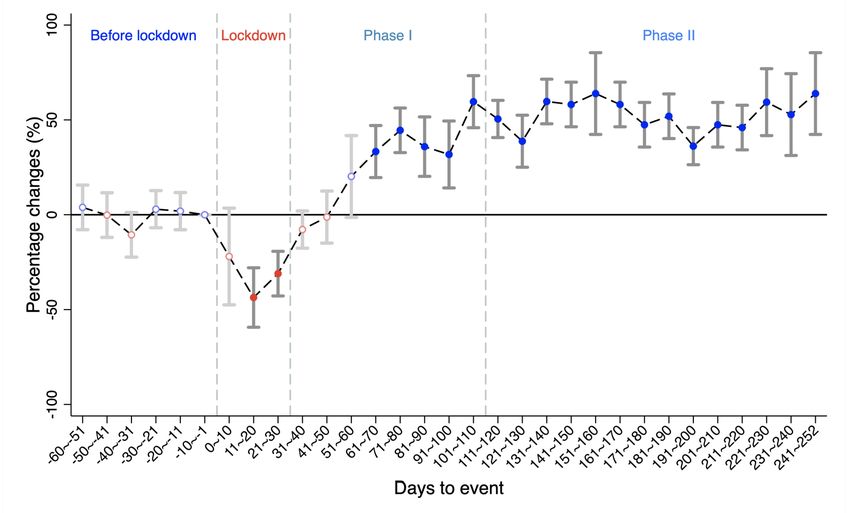
4. MAIN RESULTS
 Unemployed or working from home?

 Figure (b). Non-commuters who did not use
 emails/virtual meeting apps

 While the increase is slightly
 smaller but the pattern stays
 the same.

 24
4. MAIN RESULTS Effect on non-commuters Commuting

 Column 1 examines the
 percentage change in the number
 of non-commuters and working
 hours as a result of the pandemic
 following equation (1), except that
 the ten-day intervals are grouped
 into four periods: before
 lockdown, during the lockdown,
 Phase I reopening, and Phase II
 full reopening.

 25
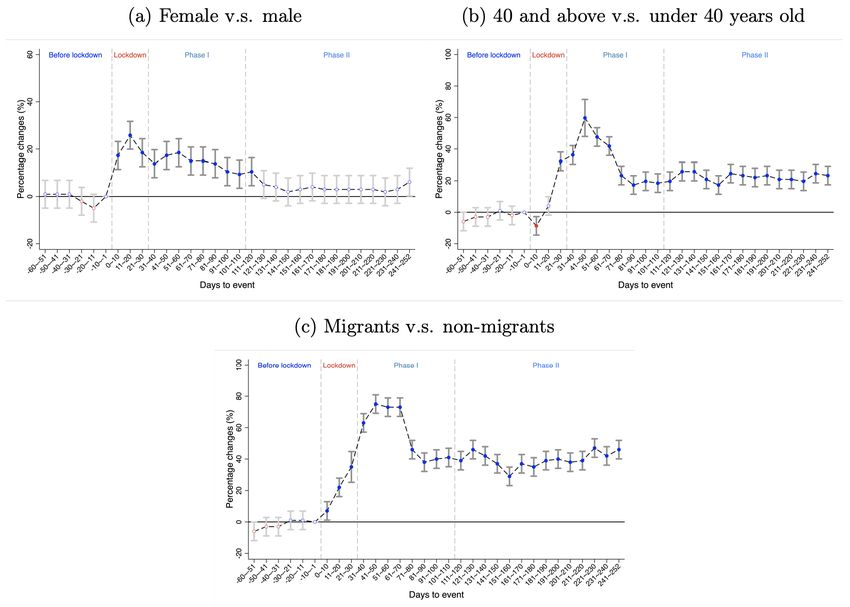
4. MAIN RESULTS Heterogeneity Analysis Commuting

 1. Females are more affected by
 the pandemic.

 2. Older workers fared worse
 than younger cohorts.

 3. Migrants are most severely
 affected by the pandemic.

 26
4. MAIN RESULTS Heterogeneity Analysis Commuting

 Table A.2. Cities in Guangdong Province

 There is considerable variation
 across cities in Guangdong in terms
 of population and GDP (Appendix
 Table A.2).

 27
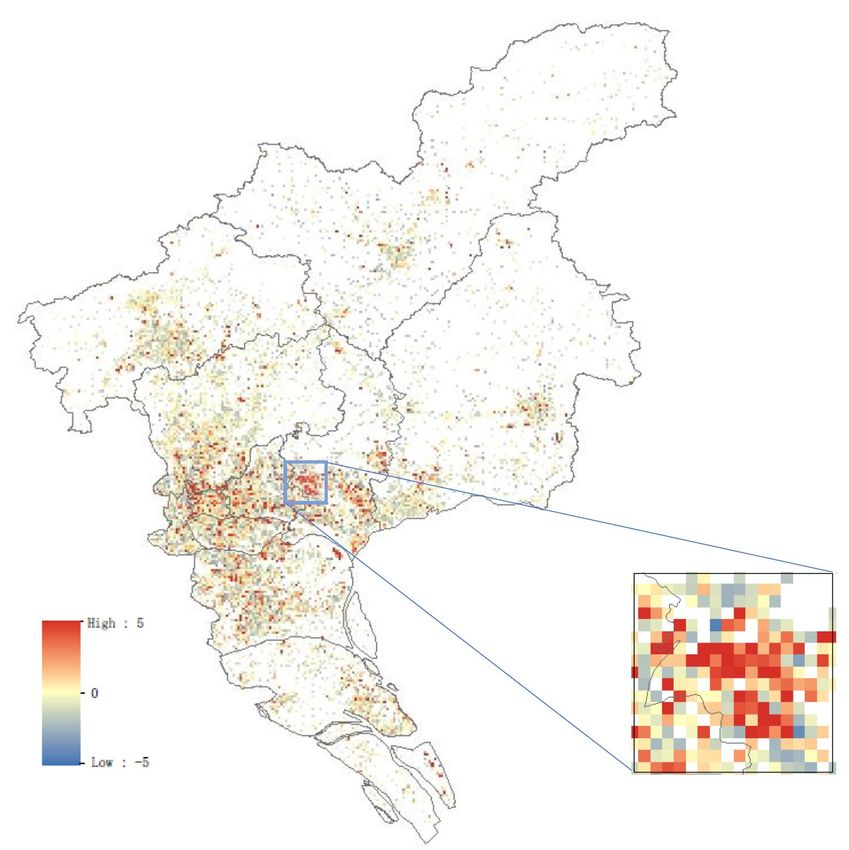
4. MAIN RESULTS Heterogeneity Analysis Commuting

 Figure 6(a). Heterogeneity across cities

 The figure reports coefficients on the
 interactions of the pandemic treatment
 dummy (Jan 23 - Sept 30, 2020) and city
 dummy.
 Heterogeneity across cities is sizeable

 28
4. MAIN RESULTS Heterogeneity Analysis Commuting

 Figure 6(b). Heterogeneity across industries

 The hotel and catering, real estate, and
 transportation sectors witnessed the largest
 increase in non-commuters.
 The finance, health care, and education sectors
 experienced reductions in non-commuters after
 the lockdown in January.

 29
4. MAIN RESULTS Heterogeneity Analysis Commuting

Table 2. Heterogeneity by export-to-GDP ratio

 Table 2 interact the pandemic
 treatment variable with a city’s
 export-to-GDP share.
 A one percentage point increase in
 2019’s export-to-GDP ratio is
 associated with a 0.37% increase in the
 number of non-commuters and a 0.02%
 decrease in working hours.

 30
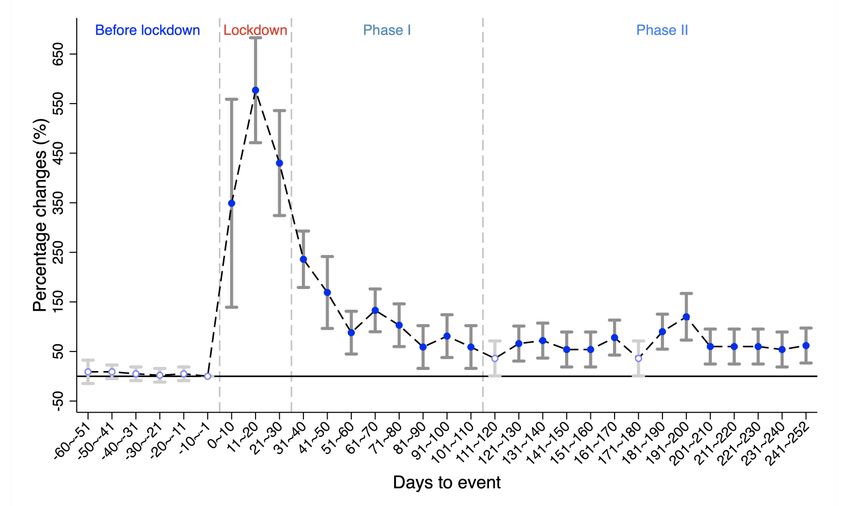
4. MAIN RESULTS
 2nd Measure:
 The number of individuals
 calling the unemployment
 hotline 12333
 Figure 4. Differences in unemployment calls
 between 2019 and 2020

 The increase in the number
 of calls to 12333 stabilized at
 about 50% by the end of the
 Phase I reopening and
 remained till the end of our
 data period.

 31
4. MAIN RESULTS Heterogeneity Analysis Unemployment
 hotline calls

 1. Females are more affected
 by the pandemic.

 2. Older workers fared worse
 than younger cohorts.

 3. Migrants are most
 severely affected by the
 pandemic.

 32
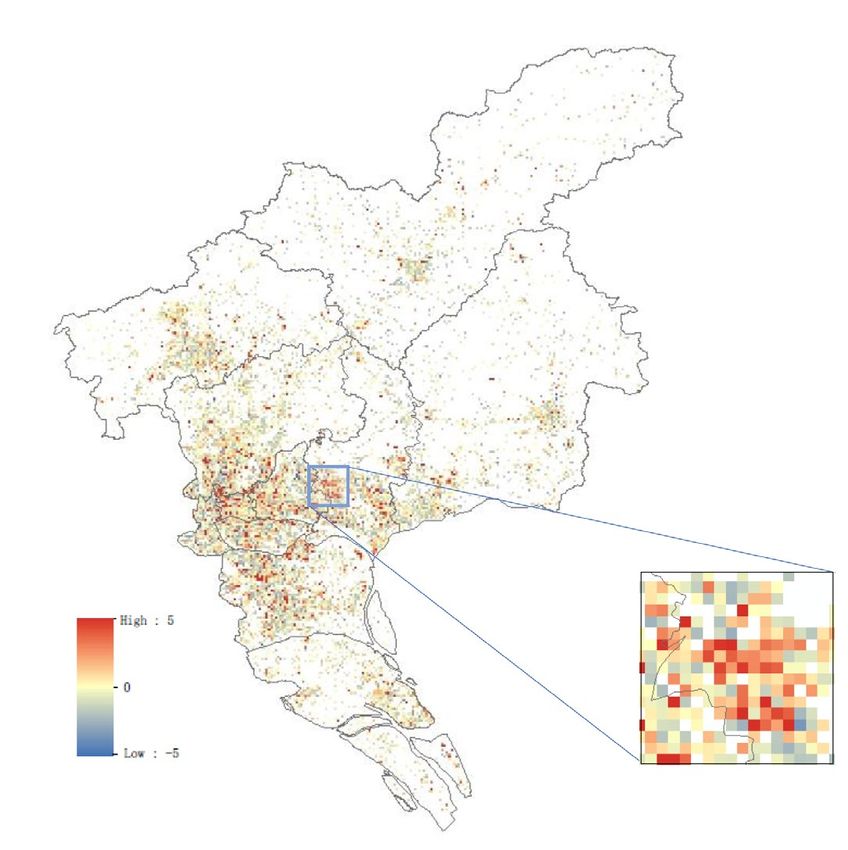
4. MAIN RESULTS Heterogeneity Analysis Unemployment
 hotline calls

 Sizable heterogeneity by city.
 The hotel and catering, real estate,
 and transportation sectors
 witnessed the largest increase in
 unemployment benefit claims.
 The finance, health care, and
 education sectors experienced
 reductions in benefit claims after the
 lockdown in January.

 33
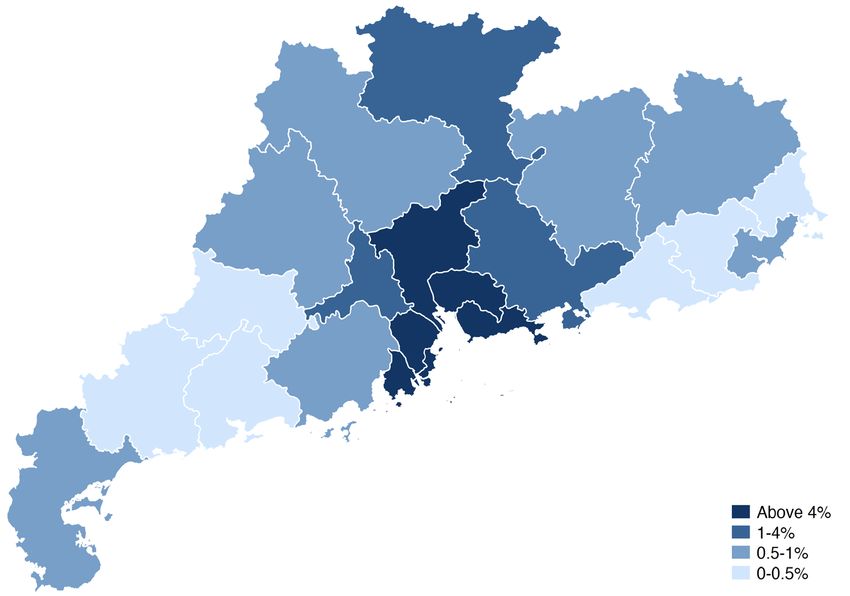
Unemployment
4. MAIN RESULTS Measure benefit claims
 hotline calls
 Figure 10. Changes in unemployment claims by income and migrant
 share in Guangzhou

 • This graph plots the predicted percentage
 changes in the individuals calling 12333
 between 2019 and 2020 against the average
 housing price and the migrant share.
 • It shows that the impact on unemployment
 is stronger in neighborhoods with a lower
 housing price and a higher share of
 migrants.
 * The housing prices (from Soufang.com) and migrant
 shares are based on 2018 data in each neighborhood (i.e.,
 cell-tower-area).

 34
4. MAIN RESULTS Heterogeneity Analysis Unemployment
 hotline calls

 Table 4 shows cities with a
 larger export-to-GDP ratio
 experience a larger increase in
 the number of unemployment
 benefit claims during the
 pandemic. This is consistent
 with the commuting results.

 35
4. MAIN RESULTS Unemployment hotline callers stop commuting

 More than 80% users have
 stopped commuting for at
 least a month during the two
 months after the call.

 36
4. MAIN RESULTS Unemployment hotline calls before and after the pandemic

 Figure A.5 compares the
 commuting patterns after
 calling 12333 in pre- and post-
 COVID period. Reassuringly,
 the commuting patterns after
 the call look very much similar
 in pre- (blue diamonds) and
 post-COVID (red dots) period.

 37
4. MAIN RESULTS Unemployment calls and stopping commuting The unemployment rate can be computed from the estimated coefficient, such that var ( β ) = exp β − Unemp − 1 ×100 2 Therefore, the unemployment rate during the entire pandemic period (Lockdown + Phase I + Phase II) is 0.03 = exp 0.24 − Unemp = − 1 27% 2 38
5. CONCLUSION
• The pandemic led to a 72% increase in unemployment and a 57% increase in
 unemployment benefit claims in Sept 2020 (nearly five months after the full
 reopening) relative to the pre-pandemic level in Sept 2019, based on the two strategies.
• The unemployment rate during the entire pandemic period (Lockdown + Phase I +
 Phase II) has increased by 27% relative to the same period in 2019.
• Females, workers over 40, and migrant workers experienced a more pronounced
 reduction in employment.
• The pandemic’s impact is larger in cities with a high labor share of hospitality, real
 estate, or transportation industries but less severe in cities where jobs are
 concentrated in finance, health care, or education industries.
• Cities with a higher export intensity have been more affected, reflecting the global
 nature of the pandemic and the interconnectedness of the world economy.

 39
Thanks!

 40
You can also read