THE STRUCTURAL CONNECTIVITY OF SUBTHALAMIC DEEP BRAIN STIMULATION CORRELATES WITH IMPULSIVITY IN PARKINSON'S DISEASE - MPG.PURE
←
→
Page content transcription
If your browser does not render page correctly, please read the page content below
doi:10.1093/brain/awaa148                                                                                                 BRAIN 2020: 143; 2235–2254   | 2235

                                                                                                                                                                Downloaded from https://academic.oup.com/brain/article-abstract/143/7/2235/5859844 by Max Planck Institute for Human Development user on 23 July 2020
The structural connectivity of subthalamic
deep brain stimulation correlates with
impulsivity in Parkinson’s disease
 Philip E. Mosley,1,2,3,4 Saee Paliwal,5 Katherine Robinson,1 Terry Coyne,3,6
Peter Silburn,2,3 Marc Tittgemeyer,7 Klaas E. Stephan,5,7,8 Alistair Perry,1,9,10,* and
Michael Breakspear1,11,*

*These authors contributed equally to this work.
See Dagher (doi:10.1093/brain/awaa187) for a scientific commentary on this article.

Subthalamic deep brain stimulation (STN-DBS) for Parkinson’s disease treats motor symptoms and improves quality of life, but
can be complicated by adverse neuropsychiatric side-effects, including impulsivity. Several clinically important questions remain un-
clear: can ‘at-risk’ patients be identified prior to DBS; do neuropsychiatric symptoms relate to the distribution of the stimulation
field; and which brain networks are responsible for the evolution of these symptoms? Using a comprehensive neuropsychiatric bat-
tery and a virtual casino to assess impulsive behaviour in a naturalistic fashion, 55 patients with Parkinson’s disease (19 females,
mean age 62, mean Hoehn and Yahr stage 2.6) were assessed prior to STN-DBS and 3 months postoperatively. Reward evaluation
and response inhibition networks were reconstructed with probabilistic tractography using the participant-specific subthalamic vol-
ume of activated tissue as a seed. We found that greater connectivity of the stimulation site with these frontostriatal networks was
related to greater postoperative impulsiveness and disinhibition as assessed by the neuropsychiatric instruments. Larger bet sizes in
the virtual casino postoperatively were associated with greater connectivity of the stimulation site with right and left orbitofrontal
cortex, right ventromedial prefrontal cortex and left ventral striatum. For all assessments, the baseline connectivity of reward evalu-
ation and response inhibition networks prior to STN-DBS was not associated with postoperative impulsivity; rather, these relation-
ships were only observed when the stimulation field was incorporated. This suggests that the site and distribution of stimulation is
a more important determinant of postoperative neuropsychiatric outcomes than preoperative brain structure and that stimulation
acts to mediate impulsivity through differential recruitment of frontostriatal networks. Notably, a distinction could be made
amongst participants with clinically-significant, harmful changes in mood and behaviour attributable to DBS, based upon an ana-
lysis of connectivity and its relationship with gambling behaviour. Additional analyses suggested that this distinction may be medi-
ated by the differential involvement of fibres connecting ventromedial subthalamic nucleus and orbitofrontal cortex. These findings
identify a mechanistic substrate of neuropsychiatric impairment after STN-DBS and suggest that tractography could be used to pre-
dict the incidence of adverse neuropsychiatric effects. Clinically, these results highlight the importance of accurate electrode place-
ment and careful stimulation titration in the prevention of neuropsychiatric side-effects after STN-DBS.

 1 Systems Neuroscience Group, QIMR Berghofer Medical Research Institute, Herston, Queensland, Australia
 2 Neurosciences Queensland, St Andrew’s War Memorial Hospital, Spring Hill, Queensland, Australia
 3 Queensland Brain Institute, University of Queensland, St Lucia, Queensland, Australia
 4 Faculty of Medicine, University of Queensland, Herston, Queensland, Australia
 5 Translational Neuromodeling Unit (TNU), Institute for Biomedical Engineering, University of Zürich and Swiss Federal Institute of
   Technology (ETH Zürich), Zürich, Switzerland
 6 Brizbrain and Spine, The Wesley Hospital, Auchenflower, Queensland, Australia

Received November 18, 2019. Revised March 19, 2020. Accepted March 20, 2020. Advance access publication June 22, 2020
C The Author(s) (2020). Published by Oxford University Press on behalf of the Guarantors of Brain. All rights reserved.
V
For permissions, please email: journals.permissions@oup.com
2236    | BRAIN 2020: 143; 2235–2254                                                                                 P. E. Mosley et al.

 7   Max Planck Institute for Metabolism Research, Cologne, Germany
 8   Wellcome Centre for Human Neuroimaging, University College London, London, UK
 9   Max Planck UCL Centre for Computational Psychiatry and Ageing Research, Berlin, Germany
10   Centre for Lifespan Psychology, Max Planck Institute for Human Development, Berlin, Germany
11   Brain and Mind Priority Research Centre, Hunter Medical Research Institute, University of Newcastle, NSW, Australia

                                                                                                                                           Downloaded from https://academic.oup.com/brain/article-abstract/143/7/2235/5859844 by Max Planck Institute for Human Development user on 23 July 2020
Correspondence to: Dr Philip E. Mosley
Neurosciences Queensland, Level 1, St Andrew’s Place, 33 North Street, Spring Hill
Queensland, 4000, Australia
E-mail: philip.mosley@qimrberghofer.edu.au

Keywords: deep brain stimulation; subthalamic nucleus; impulsivity; Parkinson’s disease; gambling
Abbreviations: DBS = deep brain stimulation; ICB = impulse control behaviour; IFG = inferior frontal gyrus; OFC = orbitofron-
tal cortex; SMA = supplementary motor area; STN = subthalamic nucleus; VAT = volume of activated tissue; vmPFC = ventro-
medial prefrontal cortex; VTA = ventral tegmental area

                                                                     Akram et al., 2017). However, there is evidence to suggest
Introduction                                                         that neuropsychiatric side effects of this therapy may also be
Deep brain stimulation (DBS) of the subthalamic nucleus              determined by modulation of activity in frontostriatal net-
(STN) in Parkinson’s disease is an established advanced ther-        works. The STN has an internal functional topography,
apy that treats motor symptoms (tremor, rigidity, bradykine-         with a motor subregion in the dorsolateral aspect of the nu-
sia), improves quality of life, and permits reduction or             cleus that transitions into cognitive-associative and affective
cessation of dopaminergic therapies (Krack et al., 2003;             subregions in the ventromedial plane (Lambert et al., 2012;
Williams et al., 2010; Schuepbach et al., 2013). However, in         Haynes and Haber, 2013; Accolla et al., 2014; Ewert et al.,
a proportion of those treated with STN-DBS, stimulation              2018). Spread of the stimulation field around a DBS elec-
may induce neuropsychiatric symptoms, most often charac-             trode in the motor region of the STN can also modulate
terized by impulsivity and mood elevation (Romito et al.,            these non-motor circuits. Previously, by localizing the active
2002; Daniele et al., 2003; Hershey et al., 2004, 2010;              DBS contact and modelling a stimulation field based on indi-
Voon et al., 2006; Appleby et al., 2007; Mallet et al., 2007;        vidualized parameters, we reported an association between
Welter et al., 2014; Mosley and Marsh, 2015). Although               stimulation of the cognitive-associative STN subregion and
these symptoms can be ameliorated with stimulation reprog-           postoperative disinhibition, in addition to the emergence of
ramming, they may nonetheless be associated with lasting             clinically-significant neuropsychiatric symptoms such as
harm (Mosley et al., 2018b, 2019b) and caregiver burden              hypomania (Mosley et al., 2018c). The physiological under-
(Mosley et al., 2018a).                                              pinnings of this impairment may result from the STN’s role
   The ability to predict those at risk of a poor non-motor          as a ‘stopping’ node in the indirect pathway of the basal
outcome would be a significant benefit to clinicians deliver-        ganglia. By inhibiting the output of cortico-striatal circuits,
ing this therapy, affecting surgical candidacy and choice of         healthy STN firing delays decision-making, allowing time
target. This is because the internal segment of the globus pal-      for evidence accumulation and the formulation of an appro-
lidus represents an alternative DBS site that has been               priate behavioural policy (Doll and Frank, 2009).
advanced as a neuropsychiatrically ‘safer’ target (Okun and          Accordingly, overriding this function with DBS may unmask
Foote, 2005) but with potentially less favourable motor out-         impulsive and error-prone responding (Frank et al., 2007;
comes (Odekerken et al., 2013). Unfortunately, most pre-             Cavanagh et al., 2011). More generally, dimensional varia-
operative measures show poor sensitivity and specificity for         tions in a range of non-motor symptoms after STN-DBS have
this syndrome. Whilst impulse control behaviours (ICBs)              been found to covary with the spread of electrical stimulation
related to dopaminergic therapy display the greatest phenom-         (Petry-Schmelzer et al., 2019). However, beyond local effects
enological overlap with stimulation-induced neuropsychiatric         of DBS, a mechanistic association between modulation of
symptoms, their presence is not predictive and their absence         frontostriatal networks and the emergence of post-DBS
is not protective: patients with pre-DBS ICBs may remit after        neuropsychiatric symptoms has not been established.
STN-DBS following medication reduction (Lhommee et al.,                 Quantifying the relationship between impulsivity and the
2012; Eusebio et al., 2013), whilst those on medication but          individualized connectivity of the subthalamic stimulation
with no history of ICBs may develop such behaviours after            field can address this issue. Through modelling the distribu-
STN-DBS (Lim et al., 2009; Moum et al., 2012).                       tion of white matter tracts in the brain, diffusion MRI can
   STN-DBS may facilitate movement in Parkinson’s disease            be used to investigate connections of the surgical target site
by disrupting synchronous oscillations between STN and               that mediate network-wide effects of DBS. Additionally, dif-
cortex (Eusebio et al., 2009, 2011; Shimamoto et al., 2013),         fusion MRI can also characterize white matter tracts adja-
particularly in the hyperdirect pathway (Nambu et al., 2002;         cent to the STN, such as the medial forebrain bundle, which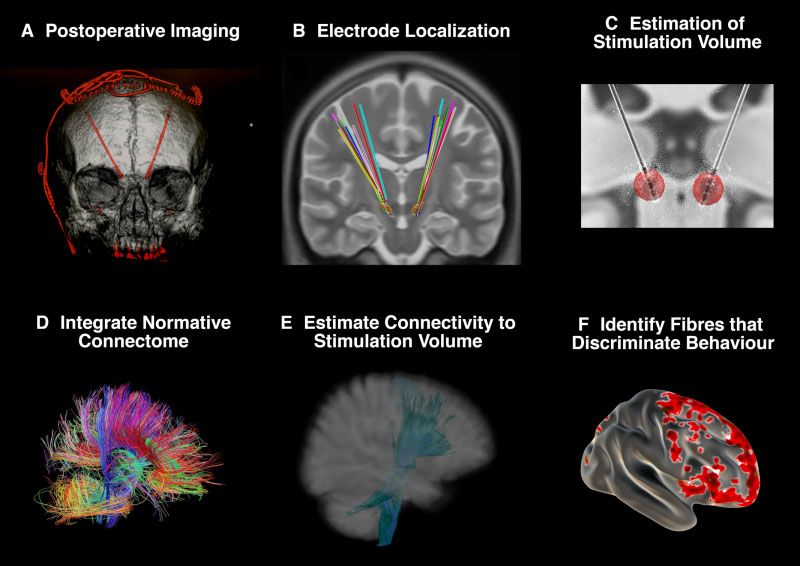
Impulsivity and structural connectivity post-DBS                                                  BRAIN 2020: 143; 2235–2254       | 2237

may also be important mediators of adverse events (Coenen              the Royal Brisbane and Women’s Hospital, the University of
et al., 2009, 2012). Motor networks associated with clinical-          Queensland, the QIMR Berghofer Medical Research Institute
ly-effective STN-DBS have previously been delineated with              and UnitingCare Health. All participants gave written, informed
diffusion MRI (Accolla et al., 2016; Vanegas-Arroyave                  consent to participate in the study.
et al., 2016; Akram et al., 2017; Horn et al., 2017; Chen
                                                                       Image acquisition

                                                                                                                                               Downloaded from https://academic.oup.com/brain/article-abstract/143/7/2235/5859844 by Max Planck Institute for Human Development user on 23 July 2020
et al., 2018) but neuropsychiatric symptoms have not yet
been comprehensively examined.                                         A preoperative T1-weighted MPRAGE, a T2-weighted FLAIR
   Using a high-resolution preoperative diffusion MRI acqui-           sequence and diffusion-weighted imaging (DWI) were obtained
sition, we reconstructed the distribution of subthalamic               at baseline, using a 3 T Siemens Prisma and a 64-channel head
stimulation and its connectivity based on two frontostriatal           coil. The acquisition parameters were as follows: T1, 1 mm3
networks recently shown to underlie dissociable aspects of             voxel resolution, repetition time = 2000 ms, echo time = 2.38
impulsivity and gambling behaviour in patients with                    ms, flip angle = 9 , matrix size = 256  256, field of view =
Parkinson’s disease prior to STN-DBS (Mosley et al.,                   256  256  192; T2, 1  1  2 mm voxel resolution, repeti-
2019a). These networks were chosen because of their in-                tion time = 9500 ms, echo time = 122.0 ms, flip angle = 120 ,
volvement in cognitive mechanisms of central relevance for             matrix size = 256  256, field of view = 256  256  70;
impulsivity: reward evaluation (sensitivity to appetitive              DWI, 90 directions, b-value = 3000 s/mm2, voxel size = 1.7
rewards) and response inhibition (failure to suppress in-              mm3 isotropic. Twelve non-diffusion-weighted images (b0) were
appropriate or premature choices). Multiple lines of evidence          interleaved throughout this main sequence, while an additional
implicate separable anatomical substrates of these ‘choosing’          sequence of 8 b0 images were also acquired with the opposite
and ‘stopping’ behaviours (Aron et al., 2007; Haber and                phase-encoding (posterior-anterior) direction to allow for distor-
Knutson, 2010; van Eimeren et al., 2010; Antonelli et al.,             tion correction. Postoperative CT images for all participants
2014; Rae et al., 2015; Hampton et al., 2017). In our previ-           were acquired on a Siemens Intevo, with a resolution of
ous study of patients with Parkinson’s disease, we demon-              0.5 mm3.
strated brain-behaviour covariation between impulsivity and               The DWI data were preprocessed with MRtrix3 (https://
connectivity of these frontostriatal networks, with the effect         github.com/MRtrix3/mrtrix3), using an in-house preprocess-
                                                                       ing pipeline (https://github.com/breakspear/diffusion-pipe
of connectivity showing a distinction by ICB status. Here,
                                                                       line). Preprocessing steps were identical to (Mosley et al.,
we sought to identify the most important contributors to im-
                                                                       2019a). Full details on DWI acquisition, preprocessing and fibre
pulsivity after STN-DBS, examining the connectivity of fron-
                                                                       reconstruction are provided in the Supplementary material.
tostriatal networks prior to DBS and the connectivity of the
stimulation field within these networks after DBS.
                                                                       Surgery and follow-up
                                                                       After the STN was manually identified on FLAIR imaging, bilat-
Materials and methods                                                  eral implantation of Medtronic 3389, Boston Vercise or Abbott
                                                                       6172 directional electrodes took place in a single-stage proced-
                                                                       ure using a Leksell stereotactic apparatus. Intraoperative micro-
Participants                                                           electrode recordings (MERs) were used to identify the
Participants were consecutively recruited at the Asia-Pacific          boundaries of the STN and intraoperative test stimulation was
Centre for Neuromodulation in Brisbane, Australia between              performed. Postoperative lead placement was confirmed with
2016 and 2018. All participants met the UK Brain Bank criteria         CT imaging. Subthalamic stimulation was commenced immedi-
for Parkinson’s disease (Hughes et al., 1992) and at the time of       ately with the initial choice of contact based upon MER signals.
recruitment were being assessed for subthalamic DBS. All partic-       After discharge, participants returned to the clinic at set intervals
ipants were at Hoehn and Yahr stage 2 or greater (Hoehn and            for further titration of stimulation (including changes in stimu-
Yahr, 1967) with motor fluctuations or other motor complica-           lating contact) against motor symptoms until these were satis-
tions related to dopaminergic therapy. No participants met the         factorily treated without adverse effects. Dopaminergic
Movement Disorder Society criteria for dementia (Emre et al.,          medication was reduced or ceased postoperatively, with remain-
2007). The disease subtype was established based on an analysis        ing treatment converted to a levodopa-equivalent daily dose
of the dominant symptoms elicited during the Unified                   (LEDD) value (Evans et al., 2004).
Parkinson’s Disease Rating Scale (UPDRS) Part III Motor
Examination, as described in Spiegel et al. (2007).
   In the present longitudinal investigation, clinical and phenotyp-
                                                                       Assessment of impulsivity
ic assessments took place at baseline, prior to DBS (ON medica-        All participants were assessed for impulsivity at baseline and at
tion), and 3 months postoperatively (on stimulation). With             follow-up, 3 months after DBS surgery. Participants were phe-
presurgical results already reported (Mosley et al., 2019a) the        notyped on both occasions using a combination of neuropsychi-
present report focuses on postoperative behaviours. However,           atric instruments and engagement in a naturalistic gambling
preoperative findings are necessarily referenced when correlations     paradigm (the ‘virtual casino’).
between pre- and postoperative behaviours are analysed.
                                                                       Neuropsychiatric instruments
Ethics approval                                                        Impulsivity was assessed with a range of neuropsychiatric
Prior to the commencement of data collection, the full protocol        instruments, to account for the multidimensional nature of this
was approved by the Human Research Ethics Committees of                construct (Mosley et al., 2019a). These included: trait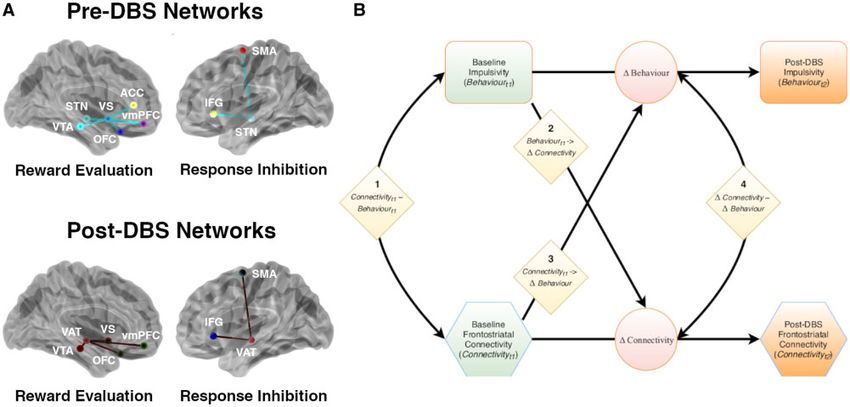
2238   | BRAIN 2020: 143; 2235–2254                                                                                    P. E. Mosley et al.

impulsiveness: the Barratt Impulsiveness Scale 11 (BIS) (Patton       advanced normalization tools (ANTs) (Avants et al., 2008).
et al., 1995); impulsive and compulsive behaviours (ICBs): the        Electrode trajectories were reconstructed after correcting for
Questionnaire for Impulsive-Compulsive Disorders in                   brainshift in postoperative acquisitions by applying a refined af-
Parkinson’s Disease-Rating Scale (QUIP-RS) (Weintraub et al.,         fine transform in a subcortical area of interest calculated pre-
2012); impatience: the Delay Discounting Task (Kirby et al.,          and postoperatively. Rotation of directional electrodes was
1999); disinhibition: the Excluded Letter Fluency task (ELF)          determined based on visualization of the artefact created by the

                                                                                                                                             Downloaded from https://academic.oup.com/brain/article-abstract/143/7/2235/5859844 by Max Planck Institute for Human Development user on 23 July 2020
(Shores et al., 2006) and the Hayling test (Burgess and Shallice,     orientation marker and directional electrode segments
1997). In addition, depressive symptoms were assessed with the        (Hellerbach et al., 2018). For each electrode, a volume of acti-
Beck Depression Inventory (Beck et al., 1961) and apathetic           vated tissue (VAT) was estimated using a volume conductor
symptoms with the Apathy Scale (Starkstein et al., 1992). To as-      model of the DBS electrode and surrounding tissue, based on
sess basic cognitive status, the Mini-Mental State Examination        each participant’s individualized stimulation settings and a finite
(MMSE) (Folstein et al., 1975) and the Montreal Cognitive             element method to derive the gradient of the potential distribu-
Assessment (MoCA) (Nasreddine et al., 2005) were also admin-          tion (Horn et al., 2019a). An electric field (E-field) distribution
istered. For further information, see the Supplementary material.     was also modelled (Vorwerk et al., 2018).
Statistical analyses of differences in impulsivity between pre-
and post-DBS assessments were corrected for multiple compari-
sons using the Benjamini and Hochberg method (1995), with             Tractography and apparent fibre
a = 0.05.                                                             density
Gambling paradigm                                                     Using the preoperative DWI data, constrained spherical deconvo-
                                                                      lution (CSD) (Tournier et al., 2004, 2007; Jeurissen et al., 2014)
Participants gambled on slot machines within a virtual casino
                                                                      was performed in each participant after group-average intensity
(Supplementary Fig. 1) that has previously been used to study
                                                                      normalization (Raffelt et al., 2012), generating voxel-wise esti-
impulsive decision-making in healthy controls and patients with
                                                                      mates of fibre orientation distribution functions (fODF). Fibre
Parkinson’s disease (Paliwal et al., 2014, 2019). This naturalistic
                                                                      tracts from seed (subcortical) to target (cortical) regions were
gambling task allowed for impulsive behaviour to be expressed
                                                                      reconstructed with the probabilistic streamline algorithm iFOD2
as bet increases, exploratory slot machine switches and ‘double
                                                                      (Tournier et al., 2010). Estimates of structural connectivity be-
or nothing’ gambles. Full details of this task are given in Mosley
                                                                      tween each seed and target region were derived from the appar-
et al. (2019a), Paliwal et al. (2019) and the Supplementary
                                                                      ent fibre density representing the underlying intra-axonal volume
material.
                                                                      averaged along tracts (Raffelt et al., 2012) (Supplementary Fig. 2
                                                                      and Supplementary material).
Caseness
Following DBS surgery, in addition to the dimensional assess-
ment of impulsivity and gambling behaviour, participants were         Networks
also assigned to the category ‘case’ or ‘non-case’ depending on
                                                                      The influence of the site and distribution of stimulation on
whether they developed clinically-significant (i.e. impairment or
                                                                      postoperative impulsivity and gambling was evaluated using two
distress) neuropsychiatric symptoms attributable to DBS, neces-
                                                                      discrete brain networks supporting reward evaluation and re-
sitating device manipulation (hereafter referred to as ‘caseness’).
                                                                      sponse inhibition (Fig. 1A). These networks incorporate anatom-
Identification of these patients used the same process as prior
                                                                      ical priors, as below. We chose to employ the same networks
work (Mosley et al., 2018a, c, 2019b). This category was opera-
                                                                      used in Mosley et al. (2019a), which were found to explain a
tionalized as follows: participants were evaluated at baseline
                                                                      substantial fraction of the variance in impulsivity prior to DBS.
and postoperatively by a neuropsychiatrist (P.M.). A semi-struc-
                                                                      We defined these networks at baseline, prior to STN-DBS, and
tured diagnostic interview and mental state examination were
                                                                      adjust their anatomical features postoperatively to incorporate
undertaken with attention to euphoria, irritability, disinhibition,
                                                                      the subthalamic VAT as the seed for probabilistic tractography.
impulsivity and compulsivity. The contribution of neurostimula-
tion to the presentation was confirmed if symptoms responded             The preoperative reward evaluation network comprised
promptly to a reduction in the amplitude or change in the locus       streamlines connecting ventral striatum with anterior cingulate
of stimulation, as assessed by serial mental state examinations       cortex, orbitofrontal cortex (OFC), ventromedial prefrontal cor-
and feedback from close family members. Clinically-significant        tex (vmPFC) and the ventral tegmental area (VTA), as well as
neuropsychiatric symptoms had remitted in all participants by         the STN with vmPFC. The preoperative response inhibition net-
the time of the postoperative reassessment of impulsivity and         work connected the STN with the inferior frontal gyrus (IFG)
gambling.                                                             and pre-supplementary motor area (SMA). Although other cor-
                                                                      tical areas (such as the anterior cingulate cortex) are implicated
                                                                      in cognitive control, we focused on the IFG and SMA because of
Electrode localization and volume                                     the strong empirical support for this network in prior work on
                                                                      behavioural inhibition (Rae et al., 2015; Hughes et al., 2018).
of tissue activation                                                  These baseline networks were used to evaluate the influence of
DBS electrodes were localized using the Lead-DBS toolbox ver-         structural connectivity prior to DBS on postoperative impulsivity
sion 2.2 (Horn and Kuhn, 2015; Horn et al., 2019a) (https://          and gambling. Postoperatively, these networks were extended to
github.com/netstim/leaddbs/tree/develop). Preoperative structural     incorporate the subthalamic VAT, with a focus on connections
acquisitions were co-registered with postoperative CT imaging         of the VAT within the network. The reward evaluation network
and then normalized into common ICBM 2009b non-linear                 now included streamlines connecting the site of stimulation with
asymmetric space using the SyN approach implemented in                OFC, vmPFC, ventral striatum and VTA. To capture tegmental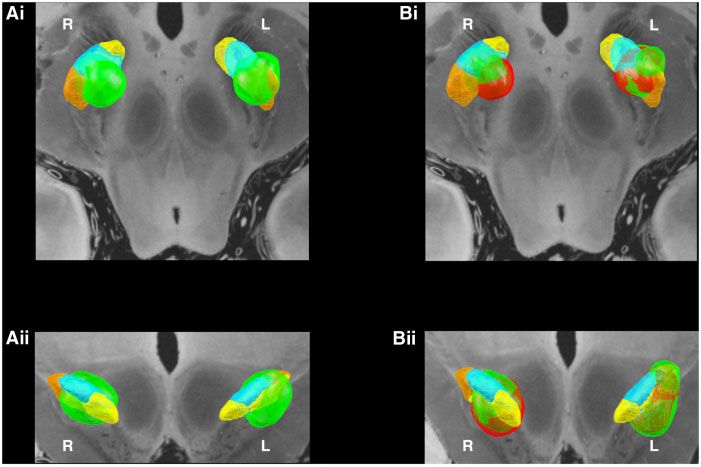
Impulsivity and structural connectivity post-DBS                                                         BRAIN 2020: 143; 2235–2254       | 2239

                                                                                                                                                     Downloaded from https://academic.oup.com/brain/article-abstract/143/7/2235/5859844 by Max Planck Institute for Human Development user on 23 July 2020
 Figure 1 Modelling brain-behaviour covariation. (A) Two discrete networks subserving reward evaluation and response inhibition were
 specified based on Mosley et al. (2019a). The pre-DBS reward evaluation network was defined to include tracts connecting ventral striatum (VS)
 with vmPFC, OFC, anterior cingulate cortex (ACC) and VTA. It also included a tract connecting the STN with vmPFC. The response inhibition
 network included tracts connecting the STN with the IFG and the SMA. Postoperatively, these networks were extended to incorporate the sub-
 thalamic VAT, with a focus on connections of the VAT within the network. Network models were visualized with the BrainNet Viewer (Xia et al.,
 2013). (B) Cross lagged (latent change score) model which allows quantification of the relationship between preoperative structural network
 connectivity (Connectivityt1) and baseline measures of impulsivity (Behaviourt1) to post-DBS structural network connectivity (Connectivityt2)
 and postoperative measures of impulsivity (Behaviourt2). Coefficients are modelled as follows: 1, connectivity-behaviour covariance at baseline
 (Connectivityt1  Behaviourt1); 2, behaviour to connectivity coupling (Behaviourt1 ! DConnectivity); 3, connectivity to behaviour coupling
 (Connectivityt1 ! DBehaviour); and 4, an estimate of correlated change in connectivity and behaviour (DConnectivity  DBehaviour). In the con-
 text of the present investigation, we were mainly interested in connectivity to behaviour coupling (3). Diamonds = coefficients; circles = change
 scores; rectangles = measured indices of impulsivity; hexagons = structural connectivity profiles. For these latter two variables, green shading
 indicates preoperative data and orange shading indicates postoperative data. See the main text and Supplementary material for further elabor-
 ation of these relationships. LEDD = levodopa equivalent daily dose; PCA = principal components analysis.

fibres for this latter midbrain region, the VTA served as the seed          structural network under investigation. The individual contribu-
and the subthalamic VAT as the target. The response inhibition              tion of each tract to the connectivity variable was quantified by
network included tracts connecting the VAT with IFG and SMA.                a ‘weight’ (linear coefficient) and the connectivity variable was
   Further details of these parcellations are provided in the               formed as a linear mixture of the corresponding apparent fibre
Supplementary material.                                                     density values that most strongly covaried with the behavioural
                                                                            variable under investigation. The relationship between the con-
                                                                            nectivity and behavioural variables was quantified in the path
Data analysis                                                               model by a path coefficient and tested for statistical significance
Partial least squares path modelling                                        using bootstrapping. Relevant demographic and disease-related
                                                                            covariates were also represented and path coefficients were
Partial least squares path modelling (PLS-PM) was used to iden-
                                                                            determined for these relationships. Bootstrapping of the model
tify specific patterns of structural connectivity explaining inter-
                                                                            yielded 95% confidence intervals for the coefficients of interest.
individual variability in impulsivity and gambling behaviour
after STN-DBS (McIntosh and Lobaugh, 2004; Shaw et al.,                        All models were constrained to be of equivalent complexity:
2016), controlling for relevant demographic and disease-related             each model used either the reward evaluation or the response in-
factors (Supplementary Fig. 3). PLS-PM is a method for examin-              hibition network, plus LEDD, age and years since diagnosis of
ing a system of linear relationships between multiple blocks of             Parkinson’s disease. One interaction term (e.g. the interaction of
variables. In this investigation, we were interested in how brain           LEDD with the reward evaluation network) was permitted per
structure (connectivity) affected impulsivity (behaviour) and               model and reported if significant. The winning model from all
whether this was also influenced by age, gender, duration of dis-           possible permutations (network, interaction effect if significant)
ease, subtype of disease and dopaminergic medication. The con-              was selected based on the maximum R2 value prior to boot-
nectivity variable in the path model was constructed from the               strapping, which was used as the summary metric to compare
apparent fibre density of each white matter tract in the                    models. The influence of gender, disease-subtype, pre-DBS ICB
2240 | BRAIN 2020: 143; 2235–2254 P. E. Mosley et al.
status and post-DBS caseness on the association between con- participant’s VAT in each hemisphere was integrated with a
nectivity and behaviour was examined with a permutation test normative structural connectome derived from 90 patients with
in the PLS path model, performed upon the winning model for Parkinson’s disease (mean age 61.4 ± 10.4, 28 females) enrolled
each behavioural variable of interest. For further details, see the in the Parkinson’s Progression Markers Initiative (PPMI, www.
Supplementary material. ppmi-info.org), in which 20 000 fibres were sampled per subject
using a generalized q-sampling approach implemented in DSI-
Downloaded from https://academic.oup.com/brain/article-abstract/143/7/2235/5859844 by Max Planck Institute for Human Development user on 23 July 2020
Longitudinal modelling Studio (Yeh et al., 2010), as described in more detail in Ewert
et al. (2018) and Horn et al. (2017). Fibres traversing each par-
Using the weighted network scores derived from PLS-PM, with
ticipant’s VAT were selected from the group connectome based
pre- and post-DBS behavioural evaluations, a cross-lagged panel
on the E-field gradient strength (i.e. fibres in peripheral VAT
model was used to evaluate whether structural connectivity at
regions with a low E-field were down-weighted) and projected
baseline (Connectivityt1) influenced impulsivity and gambling
to the volumetric surface of the ICBM 2009b non-linear asym-
postoperatively (Behaviourt2) (Fig. 1B). These latent change
metric brain in 1 mm isotropic resolution. A connectivity profile
score models assess longitudinal associations between two or
for each participant was expressed as the weighted number of
more repeatedly sampled measures of brain and behaviour
fibre tracts between the stimulation site and each brain voxel.
(Kievit et al., 2018; Muetzel et al., 2018; Lin et al., 2019). They
Subsequently, to visualize subcortical streamlines predictive of
quantify cross-domain coupling, capturing the extent to which
outcome, all fibres traversing VATs across the cohort were iso-
change (D) in one domain (impulsivity) reflects the baseline level
lated from the normative connectome.
in the other (connectivity) and vice versa. Here, a bivariate
Discriminating by caseness, fibres associated with bet size in
cross-lagged model described four brain-behaviour relations of
the virtual casino were identified. Each fibre was tested across
interest. These comprised connectivity-behaviour covariance at
the cohort between participants with a stimulation volume that
baseline (Connectivityt1 Behaviourt1), connectivity to behav-
encompassed the fibre (connected) and those where the fibre did
iour coupling (Connectivityt1 ! DBehaviour), behaviour to con-
not traverse the volume (unconnected). If there was a significant
nectivity coupling (Behaviourt1 ! DConnectivity) and an
difference between betting behaviour in participants with con-
estimate of correlated change in connectivity and behaviour
nected and unconnected VATs (using a two-sided, two-sample
(DConnectivity DBehaviour) after taking into account the
t-test), then this fibre was identified as discriminative of out-
coupling pathways. Change in connectivity (DConnectivity) was
come. This process yielded a ‘fibre t-score’, with high-values
defined as the change in network connectivity after the subthala-
indicating that this fibre was strongly discriminative of clinical
mic VAT was added as a seed for probabilistic tractography. In
outcome (Baldermann et al., 2019). Only the top 20% of fibres
the context of the present investigation, we were mainly inter-
positively correlated with the behavioural variable were selected
ested in the ability of pre-DBS network connectivity to predict
for analysis to mitigate the risk of false positive associations.
cognitive change from pre- to post-DBS (Connectivityt1 !
DBehaviour). Model fit metrics comprised the Comparative Fit
Index (CFI; the degree to which the proposed model better fits Focal subthalamic stimulation
the data than one that assumes no correlations amongst latent Supplementary analyses were also undertaken to investigate the
variables) and the root mean square error of approximation effects of focal stimulation within the STN on motor and neuro-
(RMSEA; a measure of the deviation between observed covari- psychiatric outcomes. The spatial position of each electrode con-
ance and that predicted by the model). Notably, we omitted lon- tact and the distribution of each VAT was evaluated with
gitudinal modelling of demographic and disease-related reference to a multimodal parcellation of the STN into affective,
covariates in these latent change score models and focused only associative and motor subregions (Ewert et al., 2018). For each
on the longitudinal coupling of brain connectivity and behav- hemisphere, the following variables were calculated: (i) the distance
iour. We did this for two reasons: (i) our goal was to test a rela- of the active electrode contact to the centroid of each STN sub-
tively straightforward baseline assay (brain connectivity) of region; and (ii) the extent of each subregion volume occupied by
vulnerability to postoperative impulsivity, which could be imple- each participant’s VAT (i.e. representing the dispersion of charge).
mented in clinical practice without excessively complex statistic- To reduce the dimensionality of this dataset, as with Mosley
al methods; and (ii) building a cross-lagged model that et al. (2018c), a variable selection and regularization algorithm
represents all conceivable covariates is a difficult task, possibly (the Least Absolute Shrinkage and Selection Operator: LASSO)
leading to excessively complex models (Kievit et al., 2018). was used to identify the combination of anatomical variables
Unless a clear role for covariates was identified in the PLS path with the best predictive value for each neuropsychiatric outcome
models, we opted for a more parsimonious representation. (Friedman et al., 2010). A conservative one-standard-deviation
For the gambling outcomes, random-intercept linear mixed- rule was chosen for the regularization parameter (k) to protect
effects models were fit in order to provide an explicit longitudin- against overfitting (Hastie et al., 2009).
al metric of change (e.g. in dollars wagered) by connectivity Subsequently, neuropsychiatric variables and their anatomical
(Supplementary material). predictors as identified from the LASSO were modelled in a gen-
eral linear model. Demographic and disease-related factors,
Caseness including LEDD, were also entered as covariates.
Supplementary analyses were undertaken to explore distinct pat-
terns of connectivity in individuals with clinically-significant, Data and code availability
stimulation-dependent neuropsychiatric symptoms (‘cases’) Data analysis was performed in the R software environment (R
based on their betting behaviour (Fig. 2). This required co-regis- Core Team, 2014), using the packages glmnet for optimization
tration of individual participant data with a common anatomic- (Friedman et al., 2010), plspm for PLS-PM (Sanchez, 2013), pls
al reference. To achieve this, using the Lead-DBS toolbox, each for PLS regression (Mevik, 2007), lavaan for cross-laggedImpulsivity and structural connectivity post-DBS BRAIN 2020: 143; 2235–2254 | 2241
Downloaded from https://academic.oup.com/brain/article-abstract/143/7/2235/5859844 by Max Planck Institute for Human Development user on 23 July 2020
Figure 2 Identifying fibres discriminative of gambling behaviour. A supplementary analysis was undertaken to identify distinct patterns
of connectivity between ‘cases’ and ‘non-cases’. (A) Subthalamic electrodes were identified on postoperative imaging. (B) Electrodes were local-
ized in ICBM 2009b non-linear asymmetric space using the Lead-DBS toolbox. (C) Stimulation volumes were estimated for each participant
based on individual stimulation parameters. (D) A normative connectome from the PPMI was integrated with the cohort. (E) Fibres from this
connectome passing through each stimulation volume were isolated. (F) Measuring the behavioural variable (bet size in the virtual casino), each
fibre was tested across the cohort between participants with a stimulation volume that encompassed the fibre (connected) and those where the
fibre did not traverse the volume (unconnected). If there was a significant difference in bet size between participants with connected and uncon-
nected VATs, then this fibre was identified as associated with betting behaviour. The top 20% of discriminative fibres were compared between
‘case’ and ‘non-case’ groups to identify distinct patterns of connectivity.
models (Rosseel, 2012) and lme4 for linear mixed-effects models past history of an ICB and six participants had more than
(Bates et al., 2015). one ICB. These all developed after the diagnosis of
The gambling paradigm is provided for download from a git Parkinson’s disease and in the setting of dopaminergic ther-
repository at https://github.com/saeepaliwal/breakspear_slot_ma apy (including both levodopa and dopamine agonist treat-
chine and the analysis pipeline at https://github.com/saeepaliwal/ ment). These comprised pathological gambling (n = 10),
dbs_pd_analysis_pipeline. The diffusion MRI processing pipeline
hypersexuality (n = 9), compulsive shopping (n = 3), dopa-
is at https://github.com/breakspear/diffusion-pipeline. Code for
mine dysregulation (n = 2), binge eating (n = 1) and hobby-
the analysis of focal STN stimulation is at https://github.com/
AlistairPerry/DBSVATstats. A de-identified dataset containing ism (n = 1). Participants with ICBs were more likely to be
neuropsychiatric assessment and gambling data can be provided male [v2(1) = 7.20, corrected P = 0.044] and younger
on application to the corresponding author, subject to institution- (t = 2.78, mean difference 8.6 years, corrected P = 0.044).
al review board approval. Implanted devices comprised Medtronic 3389 (n = 21),
Boston Scientific Vercise (n = 18) and Abbott 6172 direction-
al electrodes (n = 16). Directional electrodes were used
Results in five participants to steer current. Across all participants,
subthalamic VATs in each hemisphere were concatenated,
with the highest probability of stimulation occurring in the
Participants dorsolateral aspect of the STN in both hemispheres
Fifty-seven surgical candidates gave informed consent and [Fig. 3A(i and ii)].
completed all baseline assessments. Two participants were Postoperatively, there was a significant decrease in UPDRS
unable to complete the postoperative assessments because of part III motor examination score (t = 3.80, mean difference
fatigue. Fifty-five participants thus proceeded to analysis 6.6 points, corrected P = 0.0020) and levodopa equivalent
(Table 1). Prior to surgery, 17 participants had a current or daily dose (t = 9.68, mean difference 746 mg, corrected2242 | BRAIN 2020: 143; 2235–2254 P. E. Mosley et al.
P = 2.1 10–13). At a group level, there was also a signifi- the time of postoperative assessment (device manipulations
cant decrease in disinhibition as assessed by the Hayling AB used to remit symptoms are detailed in Supplementary Table
Error Score (t = 2.60, mean difference 4.2 points, corrected 2). Subthalamic VATs were compared amongst cases before
P = 0.044). There were no other significant pre-post group and after remission of symptoms [Fig. 3B(i and ii)]. There
differences amongst the neuropsychiatric instruments assess- was a qualitative trend for stimulation associated with acute
Downloaded from https://academic.oup.com/brain/article-abstract/143/7/2235/5859844 by Max Planck Institute for Human Development user on 23 July 2020
ing impulsivity or gambling behaviours (Table 1). Only 17 symptoms to be located in more ventromedial aspects of the
participants used the machine switch option in the virtual nucleus, with remission of symptoms associated with more
casino and this measure was hence not analysed further. dorsolateral stimulation (cf. red and green concatenated
There were no significant changes in cognition, depressive or fields of overlapping voxels). Between case-positive and case-
apathetic symptoms across the cohort. One participant negative participants, there were no significant differences in
developed clinically-significant depressive symptoms and dimensional variability amongst neuropsychiatric indices of
these were treated with an antidepressant. Seventeen partici- impulsivity derived from the clinical assessments or
pants developed a postoperative elevation in mood and clin- gambling behaviours derived from the virtual casino
ically-significant impulsive behaviour attributable to (Supplementary Table 3). A history of current or past ICBs
stimulation (‘cases’; specific neuropsychiatric symptoms are was not predictive of developing a neuropsychiatric syn-
detailed in Supplementary Table 1). Clinically significant drome post-DBS [v2(1) = 0.62, P = 0.43]. Participants with
psychiatric symptoms had remitted in these individuals at a history of ICBs prior to surgery also did not differ in
Table 1 Demographic and clinical characteristics of the Parkinson’s disease cohort (n = 55)
Demographic and disease-related variables
Categorical variable Total (n = 55) Percentage total
Gender n % total
Male 36 65.5
Female 19 34.5
Clinical subtype n % total
Akinetic-rigid 17 30.9
Mixed 27 49.1
Tremor 11 20.0
ICB status n % total
Yes 17 30.9
No 38 69.1
Continuous variable Mean (SD), median [range]
Age, years 62.0 (±9.8), 65 [35–77]
Hoehn and Yahr stage 2.6 (±0.5), 2.5 [1.5–4]
Years since diagnosis 8.2 (±4.2), 7 [2–21]
Variables assessed pre- and post-DBS, mean (SD), median [range]
Assessment instrument Pre-DBS Post-DBS Pre- versus post-DBSa
LEDD 1126 (±629.9), 1015 [0–3450] 380 (±231.4), 375 [0–825] t = 9.68; corr. P = 2.1 x 10⁻¹³***
BIS Attentional 16.0 (±3.4), 16 [10–26] 15.5 (±4.3), 15 [8–31] t = 1.40; corr. P = 0.25
BIS Non-Planning 22.6 (±4.1), 23 [14–32] 22.7 (±5.3), 22 [14–37] t = –0.14; corr. P = 0.92
BIS Motor 21.5 (±3.7), 21 [14–30] 20.7 (±3.8), 21 [13–34] t = 1.99; corr. P = 0.11
QUIP-RS Total 20.0 (±15.3), 18 [0–63] 18.6 (±16.6), 15 [0–66] t = 0.80; corr. P = 0.53
Delay discount, k 0.038 (±0.064), 0.016 [0.00016–0.25] 0.028 (±0.031), 0.016 [0.00016–0.1] t = 1.59; corr. P = 0.19
Hayling AB Error Score 14.2 (±13.1), 9 [0–44] 10.0 (±10.6), 5 [0–39] t = 2.60; corr. P = 0.044*
ELF Rule Violations 8.6 (±5.4), 8 [0–24] 7.1 (±4.7), 6 [1–22] t = 2.29; corr. P = 0.072
Beck Depression Inventory 11.0 (±5.1), 10 [2–24] 9.3 (±8.3), 8 [0–44] t = 1.84; corr. P = 0.14
Apathy Scale 12.0 (±4.8), 11 [2–26] 12.3 (±5.4), 11 [3–29] t = –0.50; corr. P = 0.83
MMSE 28.3 (±1.5), 28 [25–30] 28.3 (±2.5), 29 [27–30] t = 0.20; corr. P = 0.84
MoCA 26.0 (±2.3), 26 [21–30] 26.6 (±3.0), 28 [15–30] t = –1.95; corr. P = 0.14
UPDRS Part III Motor 39.4 (±15.1), 39 [10–70] 32.9 (±13.0), 32 [8–60] t = 3.80; corr. P = 0.0020**
Virtual casino
Average bet size (AUD) 42.2 (±45.2), 27.2 [5–191.8] 61.4 (±78.0), 25.7 [5–339.8] t = –1.87; corr. P = 0.12
Double or nothing gamble, % 17.1 (±20.7), 15 [0–100] 17.4 (±20.1), 19 [0–100] t = –0.097; corr. P = 0.92
a
FDR-corrected with Benjamini and Hochberg method (1995), with a = 0.05.
Significance: *P 5 0.05; **P 5 0.01; ***P 5 0.001.
BIS = Barratt Impulsiveness Scale; ELF = Excluded Letter Fluency Task; LEDD = levodopa equivalent daily dose; MMSE = Mini Mental State Examination; MoCA = Montreal
Cognitive Assessment; QUIP-RS = Questionnaire for Impulsive-Compulsive disorders in Parkinson’s Disease-Rating Scale; UPDRS = Unified Parkinson’s Disease Rating Scale Part
III Motor Examination.Impulsivity and structural connectivity post-DBS BRAIN 2020: 143; 2235–2254 | 2243
Downloaded from https://academic.oup.com/brain/article-abstract/143/7/2235/5859844 by Max Planck Institute for Human Development user on 23 July 2020
Figure 3 Subthalamic stimulation. VATs for each participant in each hemisphere were concatenated and thresholded to identify the highest
frequency of overlapping voxels (the top 25% are shown here). The VATs overlapped most substantially with the dorsolateral aspects of the STN
in both hemispheres. The subthalamic atlas (Ewert et al., 2018) is overlaid on a 7 T MRI ex vivo brain image (Edlow et al., 2019). Within each STN,
affective = yellow, associative = blue, and motor = maroon subregions. [A(i and ii)] Axial and coronal visualizations of stimulation across the
whole cohort (green). [B(i and ii)] For those participants who developed clinically-significant neuropsychiatric symptoms (cases), the VATs are
visualized at the time of symptom onset (red) and after stimulation manipulation (reduction in amplitude, change of contact etc.) when acute
symptoms had resolved (green). A qualitative trend away from ventromedial regions can be seen after stimulation adjustment associated with re-
mission of neuropsychiatric symptoms.
postoperative neuropsychiatric measures or gambling behav- incorporating the participant-specific stimulation field at
iours (Supplementary Table 3). each DBS electrode. The connectivity of the response inhib-
ition network best explained variations in this construct.
The greater the connectivity of the VAT with the response
Path modelling of connectivity and inhibition network, the greater the impulsiveness (coefficient
impulsivity = 0.36, P = 0.010; Table 2). The tracts weighted most heav-
ily in the response inhibition network linked the VAT with
Overview
left SMA and right IFG (Fig. 4A and Supplementary Table
Impulsivity was assessed using either neuropsychiatric instru- 4). There was no significant difference by preoperative ICB
ments or gambling behaviours in a virtual casino. The vari- status (P = 0.57) or postoperative caseness (P = 0.33) on this
ance in impulsivity explained by the structural connectivity effect. The connectivity of the VAT with the response inhib-
of the subthalamic VAT was estimated using PLS path mod- ition network explained 15.4% of the total postoperative
els. The variance explained by frontostriatal connectivity was variance in impulsiveness.
higher for betting behaviour in the virtual casino, than for We next used a cross-lagged model to assess the contri-
the neuropsychiatric instruments. Employing a cross-lagged bution of structural connectivity at baseline to postopera-
model, postoperative changes in impulsivity and gambling tive changes in impulsiveness. This postoperative change
were not significantly related to the structural connectivity of was not significantly influenced by the structural connect-
frontostriatal networks at baseline, prior to DBS. Finally, the ivity of the response inhibition network prior to DBS
effect of connectivity on bet size in the virtual casino differed (P = 0.071; Table 3). However, there was a significant
amongst participants who developed postoperative, stimula- cross-sectional association prior to DBS between impul-
tion-dependent neuropsychiatric symptoms characterized by siveness and connectivity (coefficient = –2.38, P = 0.017),
mood elevation, irritability, disinhibition and impulsivity with greater connectivity of this network linked to
reaching the threshold of clinical-significance (cases). reduced impulsivity in this domain, the opposite of the
post-DBS effect (compare the sign of the coefficient in the
Barratt Impulsiveness Scale PLS path model above). There was also a significant cor-
We first examined how self-reported impulsiveness after related change in connectivity and impulsivity from the
DBS was related to the structural connectivity of networks pre- to the postoperative interval (coefficient 1.74,2244 | BRAIN 2020: 143; 2235–2254 P. E. Mosley et al.
P = 0.023), suggesting a co-occurrence of connectivity and reward evaluation) did not associate with variation in
and behavioural changes (Supplementary Fig. 4). disinhibition (as expressed by Hayling A or B errors).
Questionnaire for Impulsive-Compulsive Disorders Delay Discount k
in Parkinson’s Disease-Rating Scale Last amongst the neuropsychiatric instruments, we consid-
Downloaded from https://academic.oup.com/brain/article-abstract/143/7/2235/5859844 by Max Planck Institute for Human Development user on 23 July 2020
There were no significant associations between dimensional ered delay discounting: the tendency to prefer sooner,
ratings of behavioural addictions (such as gambling, sex, smaller rewards over those that are larger but temporally
shopping and eating) and structural connectivity with the more distant. Postoperatively, behaviour on this task was
site of stimulation, either within the response inhibition or best explained by the connectivity of the site of stimulation
reward evaluation network. within the reward evaluation network. The greater the con-
nectivity of the VAT with the reward evaluation network,
Excluded Letter Fluency rule violations the lower the impatience and the greater the ability to defer
We then evaluated how structural connectivity with the site reward (coefficient = –0.31, P = 0.042; Table 2). The tracts
of stimulation was related to postoperative disinhibition (as weighted most strongly in the reward evaluation network
expressed by ELF rule violations). The connectivity of the re- were bi-hemispheric connections between the VTA and the
ward evaluation network best explained variability in this site of stimulation (Fig. 4C and Supplementary Table 6).
facet of impulsivity. The greater the connectivity of the VAT There was no significant difference by preoperative ICB sta-
with the reward evaluation network, the more inhibitory tus (P = 0.15) or postoperative caseness (P = 0.14) on the ef-
errors (coefficient = 0.41, P = 0.0017; Table 2). The tract fect of connectivity. The connectivity of the VAT with the
weighted most heavily in the reward evaluation network reward evaluation network explained 3.3% of the total post-
linked the VAT with right vmPFC (Fig. 4B and operative variance in impatience.
Supplementary Table 5). There was no significant difference Using the cross-lagged model, postoperative change in im-
by preoperative ICB status (P = 0.62) or postoperative case- patience was not influenced by the structural connectivity of
ness (P = 0.78) on the effect of connectivity. The connectivity the reward evaluation network prior to DBS (P = 0.67;
of the VAT with the reward evaluation network explained Table 3). At baseline, there was significant connectivity-
16.9% of the total postoperative variance in disinhibition. behaviour covariance (coefficient = –0.46, P = 0.020) with
In the cross-lagged model, there was no significant effect greater connectivity of the reward evaluation network also
of baseline structural connectivity on postoperative changes associated with a greater ability to defer reward.
in disinhibition (P = 0.12; Table 3). Again, prior to DBS Connectivity and behavioural changes pre- to post-DBS were
there was a cross-sectional association between connectivity not significantly correlated (P = 0.85) (Supplementary Fig. 6).
and disinhibition (coefficient = –0.51, P = 0.018), with
greater connectivity in the reward evaluation network associ- Bet size
ated with fewer inhibitory errors, again the opposite of the Inter-individual variation in bet size post-DBS in the virtual
post-DBS effect. There was also a significant co-occurrence casino was best explained by the connectivity of the VAT
of connectivity and behavioural changes after DBS (coeffi- with the reward evaluation network. The greater the con-
cient = 0.34, P = 0.0050) (Supplementary Fig. 5). nectivity of the VAT with the reward evaluation network,
the higher the bets in the casino (coefficient = 0.43,
Hayling AB Error Score P = 0.0029; Table 2). Tracts weighted most heavily were
The structural connectivity of networks incorporating the those linking the stimulation field with right and left OFC,
participant-specific stimulation field (both response inhibition right vmPFC and left ventral striatum (Fig. 4D and
Table 2 Detailed output of models from PLS-PM analysis of postoperative behaviour
PLS-PM analysis of post-DBS impulsivity and gambling
Variable Network R2 Path coefficient Significance 95% CI Other significant
P-value covariates
Post-DBS neuropsychiatric instruments
BIS Response inhibition 0.19 0.36 0.010* 0.062 to 0.58 Nil
ELF rule violations Reward evaluation 0.27 0.41 0.0017** 0.15 to 0.62 Nil
Delay Discount k Reward evaluation 0.14 –0.31 0.042* –1.00 to –0.049 Years since diagnosis:
coeff = –0.33
95% CI = –0.55 to –0.092
P = 0.030
Post-DBS gambling behaviours
Bet size Reward evaluation 0.30 0.43 0.0029** 0.044 to 0.64 Nil
Significance: *P 5 0.05; **P 5 0.01; ***P 5 0.001.Impulsivity and structural connectivity post-DBS BRAIN 2020: 143; 2235–2254 | 2245
Downloaded from https://academic.oup.com/brain/article-abstract/143/7/2235/5859844 by Max Planck Institute for Human Development user on 23 July 2020
Figure 4 Fibre tracts weighted most strongly in the association of connectivity with impulsivity and gambling. The anatomical
network with the greatest capacity to explain variance in each aspect of postoperative impulsivity and gambling. Left column: In each PLS path
model, the anatomical variable representing structural connectivity was composed of a weighted mixture of all tracts in the network. Right col-
umn: The most heavily weighted tracts. (A) Barratt Impulsiveness Scale; (B) ELF rule violations; (C) Delay Discount constant k; (D) Bet size. VS
= ventral striatum.2246 | BRAIN 2020: 143; 2235–2254 P. E. Mosley et al.
Table 3 Cross-lagged model results
Cross-lagged coefficients Cross-sectional coefficients Model fit indices
Variable Connectivityt1 fi Behaviourt1 fi Connectivityt1 ~ DConnectivity ~ CFI RMSEA
DBehaviour DConnectivity Behaviourt1 DBehaviour
Downloaded from https://academic.oup.com/brain/article-abstract/143/7/2235/5859844 by Max Planck Institute for Human Development user on 23 July 2020
Post-DBS neuropsychiatric instruments
BIS coeff = 1.55 coeff = 0.031 coeff = –2.38 coeff = 1.74 1.0 0.001
P = 0.071 P = 0.026 * P = 0.017 * P = 0.023*
ELF rule violations coeff = 0.25 coeff = 0.24 coeff = –0.51 coeff = 0.34 1.0 0.001
P = 0.12 P = 0.10 P = 0.018 * P = 0.0050**
Delay Discount k coeff = 0.033 coeff = –0.11 coeff = –0.46 coeff = –0.013 1.0 0.001
P = 0.67 P = 0.33 P = 0.020* P = 0.85
Post-DBS gambling behaviours
Bet size coeff = 0.045 coeff = 0.35 coeff = 0.53 coeff = 0.37 1.0 0.001
P = 0.78 P = 0.056 P = 0.0050** P = 0.059
Significance: *P 5 0.05; **P 5 0.01; ***P 5 0.001.
In the cross-lagged model:
(i) Connectivityt1 ! DBehaviour represents connectivity to behaviour coupling: the extent to which structural connectivity at baseline associates with change in impulsivity and
gambling at follow-up.
(ii) Behaviourt1 ! DConnectivity represents behaviour to connectivity coupling: the degree of change in structural connectivity dependent on impulsivity at baseline.
(iii) Connectivityt1 Behaviourt1 is connectivity-behaviour covariance at baseline
(iv) DConnectivity DBehaviour is an estimate of correlated change: reflecting the degree to which connectivity and behaviour changes co-occur.
BIS = Barratt Impulsiveness Scale; CFI = Comparative Fit Index; RMSEA = root mean square error of approximation.
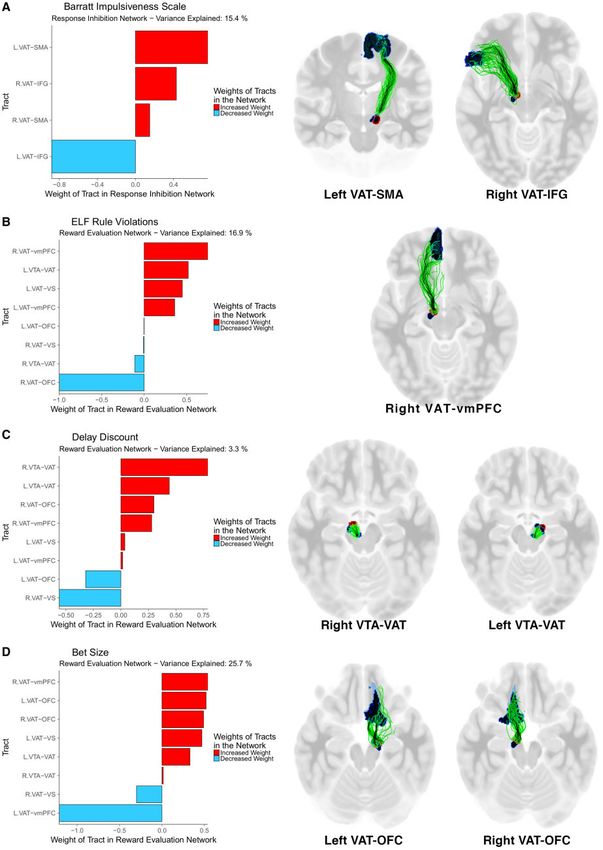
Supplementary Table 7). There was no significant difference matter fibres connected to the stimulation field. We selected
by preoperative ICB status (P = 0.27) but there was a signifi- fibres predictive of bet size and compared these between
cant difference in postoperative caseness on the effect of con- case-positive and case-negative participants. This allows
nectivity (coefficient case-positive = –0.90, case-negative = identification of fibres associated with gambling behaviour
0.56, P = 0.020). The connectivity of the VAT with the re- that are also associated with pathological behaviour of a
ward evaluation network explained 25.7% of the total post- clinically-relevant nature. In case-negative participants,
operative variance in bet size. In a linear mixed effects streamlines predictive of increased bet size passed from the
model, an increase in connectivity of 1 standard error (SE) diencephalon lateral to the STN and to the right vmPFC and
increased bet size by AUD 31.1 [±5.49, v2(1) = 26.6, OFC, consistent with findings from the PLS-PM analysis. In
P = 2.5 10–7] with no significant covariates. the right hemisphere, a portion of these streamlines traversed
Baseline connectivity of the reward evaluation circuit did the VTA. However, in case-positive participants, right-hemi-
not predict postoperative changes in bet size (P = 0.78; spheric fibres predominantly involved the OFC rather than
Table 3). However, prior to DBS there was a significant rela- vmPFC. Moreover, these fibres were situated medial to the
tionship between pre-DBS bet size and baseline connectivity right STN and appeared to terminate/originate in the STN
(coefficient = 0.53, P = 0.0050), with greater connectivity rather than passing into the midbrain (Fig. 5).
also associated with higher bets. There was no significant
correlation in change between gambling and structural
connectivity pre- to post-DBS (P = 0.059) (Supplementary Relationship between motor and neuropsychiatric
Fig. 7). symptoms
We also investigated whether neuropsychiatric symptoms,
including impulsivity, could be dissociated from postopera-
Double or nothing gambles
tive improvement in UPDRS part III motor examination
The likelihood of a gambler taking on a double or nothing
scores, given that treatment of motor symptoms is the core
gamble was not associated with the structural connectivity
clinical objective of STN-DBS for Parkinson’s disease.
of the site of stimulation, when the reward evaluation and
Measures of postoperative impulsivity including the BIS
response inhibition networks were entered into the PLS path
(r = 0.41, corrected P = 0.0048), the Hayling AB Error Score
models.
(r = 0.42, corrected P = 0.0048) and Double or Nothing
Gambles in the virtual casino (r = 0.42, corrected
Fibre tracts discriminative of bet size in case- P = 0.0048) were positively correlated with UPDRS Part III
positive and case-negative participants score, suggesting that the greater the impulsivity, the worse
Subsequently, we used a normative connectome derived were postoperative motor symptoms after STN-DBS
from individuals with Parkinson’s disease to visualize white (Supplementary Table 8). Moreover, participants whoYou can also read