Time-Domain Electromagnetic Soundings and Passive-Seismic Measurements for Delineation of Saline Groundwater in the Genesee Valley-Fill Aquifer ...
←
→
Page content transcription
If your browser does not render page correctly, please read the page content below
Prepared in cooperation with the New York State Department of Environmental Conservation

Time-Domain Electromagnetic Soundings and
Passive-Seismic Measurements for Delineation of Saline
Groundwater in the Genesee Valley-Fill Aquifer System,
Western New York, 2016–17

Scientific Investigations Report 2021–5008

U.S. Department of the Interior
U.S. Geological Survey
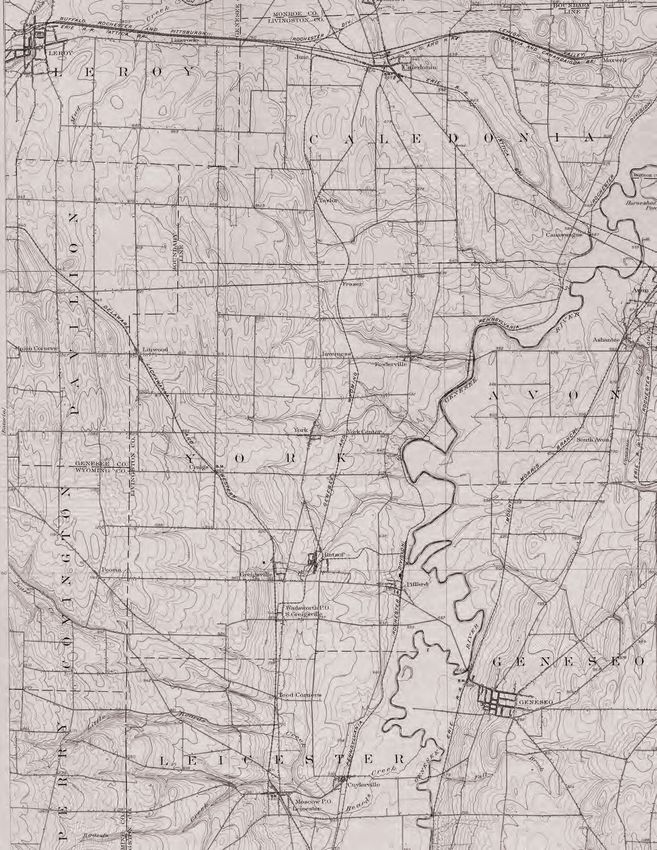
Front cover. Topographic map of Genesee Valley, New York, with an antique logo taken from a table
salt sales brochure of the Genesee Salt Company, originally located in Piffard, New York.
Back cover. From the same brochure, the company pitches seven benefits of its product.
Time-Domain Electromagnetic Soundings
and Passive-Seismic Measurements for
Delineation of Saline Groundwater in
the Genesee Valley-Fill Aquifer System,
Western New York, 2016–17

By John H. Williams, William M. Kappel, Carole D. Johnson, Eric A. White,
Paul M. Heisig, and John W. Lane, Jr.

Prepared in cooperation with the
New York State Department of Environmental Conservation

Scientific Investigations Report 2021–5008

U.S. Department of the Interior
U.S. Geological Survey
U.S. Geological Survey, Reston, Virginia: 2021

For more information on the USGS—the Federal source for science about the Earth, its natural and living resources,
natural hazards, and the environment—visit https://www.usgs.gov or call 1–888–ASK–USGS.
For an overview of USGS information products, including maps, imagery, and publications, visit
https://store.usgs.gov/.

Any use of trade, firm, or product names is for descriptive purposes only and does not imply endorsement by the
U.S. Government.
Although this information product, for the most part, is in the public domain, it also may contain copyrighted material
and images protected by publicity rights. Use of photographs or images may require permission to reproduce
copyrighted items or the likeness of a person. Permission must be secured from the copyright owner or person whose
likeness is being used. For more information, visit https://usgs.gov/copyright.

Suggested citation:
Williams, J.H., Kappel, W.M., Johnson, C.D., White, E.A., Heisig, P.M., and Lane, J.W., Jr., 2021, Time-domain
electromagnetic soundings and passive-seismic measurements for delineation of saline groundwater in the
Genesee valley-fill aquifer system, western New York, 2016–17: U.S. Geological Survey Scientific Investigations
Report 2021–5008, 25 p., https://doi.org/10.3133/sir20215008.

Associated data for this publication:
Heisig, P.M., Williams, J.H., Johnson, C.D., White, E.A., and Kappel, W.M., 2021, Horizontal-to-vertical spectral
ratio and depth-to-bedrock data for saline-groundwater investigation in the Genesee valley, New York, October–
November 2016 and 2017: U.S. Geological Survey data release, https://doi.org/10.5066/P9LI7CCR.

Kappel, W.M., and Williams, J.H., 2021, Chloride concentrations from wells in the Genesee River Valley, Livingston
County, New York: U.S. Geological Survey data release, https://doi.org/10.5066/P9J354SU.

White, E.A., Johnson, C.D., Williams, J.H., and Kappel, W.M., 2021, Time-domain electromagnetic soundings to
delineate saline groundwater in the Genesee valley-fill aquifer system, New York (2016–2017): U.S. Geological
Survey data release, https://doi.org/10.5066/P9VQOCRZ.

ISSN 2328-0328 (online)
iii

Acknowledgments
The authors thank the farmers and landowners of the Genesee River Valley for graciously
granting access to their fields and property to collect the geophysical soundings that support
this project. Without their cooperation, this study would not have been possible. The authors
also thank Robert Stryker of the Livingston County Soil and Water Conservation District who
helped coordinate land access with the farming community. The able support of Alton Anderson,
Adam Baldwin, Mike Izdebski, Katt Pappas, and Katherine Swager of the U.S. Geological Survey
during field-data collection are greatly appreciated.
v

Contents
Acknowledgments����������������������������������������������������������������������������������������������������������������������������������������iii
Abstract�����������������������������������������������������������������������������������������������������������������������������������������������������������1
Introduction����������������������������������������������������������������������������������������������������������������������������������������������������1
Time-Domain Electromagnetic Soundings������������������������������������������������������������������������������������������������3
Passive-Seismic Measurements����������������������������������������������������������������������������������������������������������������4
Well Logs���������������������������������������������������������������������������������������������������������������������������������������������������������6
Groundwater Samples for Salinity��������������������������������������������������������������������������������������������������������������6
Geologic Setting���������������������������������������������������������������������������������������������������������������������������������������������7
     Bedrock Geology����������������������������������������������������������������������������������������������������������������������������������7
     Glacial and Postglacial Geology��������������������������������������������������������������������������������������������������������7
Hydrologic Setting�����������������������������������������������������������������������������������������������������������������������������������������7
     Aquifer and Confining Units����������������������������������������������������������������������������������������������������������������7
     Groundwater Flow��������������������������������������������������������������������������������������������������������������������������������7
     Distribution of Fresh and Saline Groundwater������������������������������������������������������������������������������10
           Valley-Fill Aquifer System���������������������������������������������������������������������������������������������������������10
           Onondaga and Bertie Limestones�������������������������������������������������������������������������������������������12
           Salt-Solution Wells��������������������������������������������������������������������������������������������������������������������12
           Syracuse D Salt and Brine Pools��������������������������������������������������������������������������������������������13
           Devonian Shales������������������������������������������������������������������������������������������������������������������������13
Hydrologic Effects of Mine Collapse��������������������������������������������������������������������������������������������������������13
     Mine Collapse, Rubble Chimneys, and Flooding����������������������������������������������������������������������������13
     Groundwater-Level Decline and Salinity Increase�����������������������������������������������������������������������16
     Groundwater-Level Recovery�����������������������������������������������������������������������������������������������������������16
     Upward Flow of Saline Water Through Rubble Chimneys�����������������������������������������������������������16
     Remedial Pumping to Mitigate Saline-Water Migration��������������������������������������������������������������16
Delineation of Saline Groundwater in the Valley-Fill Aquifer System�������������������������������������������������20
     Transects South of the Collapse Area���������������������������������������������������������������������������������������������20
     Transects North of Collapse Area����������������������������������������������������������������������������������������������������20
     Transects East of Piffard��������������������������������������������������������������������������������������������������������������������22
     Fowlerville Moraine Transects���������������������������������������������������������������������������������������������������������23
Summary�������������������������������������������������������������������������������������������������������������������������������������������������������23
References Cited�����������������������������������������������������������������������������������������������������������������������������������������24

Figures
         1. Surficial geology of the study area, location of the former Retsof salt mine, and
            associated features in the Genesee River Valley in western New York�����������������������������2
         2. Schematic of the time-domain electromagnetic equipment and the
            transmission and reception of electromagnetic signals��������������������������������������������������������4
         3. Graph of peak-resonance frequencies from passive-seismic measurements
            with reported depths to bedrock at wells in the Genesee River Valley in
            western New York������������������������������������������������������������������������������������������������������������������������6
vi
4. Generalized geologic section across the Genesee River Valley in western
New York����������������������������������������������������������������������������������������������������������������������������������������8
5. Generalized geologic section along the axis of the Genesee River Valley in
western New York; modified from Yager and others (2001)���������������������������������������������������9
6. Generalized hydrogeologic section across the Genesee River Valley in western
New York; modified from Yager and others (2001)����������������������������������������������������������������10
7. Map of distribution of the Syracuse D salt and brine pools in the Genesee River
Valley in western New York������������������������������������������������������������������������������������������������������11
8. Logs of lithostratigraphy, chloride concentration, electrical conductivity,
and the results of a time-domain electromagnetic sounding from sites in the
Genesee River Valley in western New York���������������������������������������������������������������������������12
9. Generalized hydrogeologic section across the Genesee River Valley in western
New York, following the development of a rubble chimney, surface sinkhole,
and flooding into the mine���������������������������������������������������������������������������������������������������������14
10. Map of land subsidence, water-level drawdowns, and wells in which water
levels declined, became saline, or produced gas after the mine collapse����������������������15
11. Generalized hydrogeologic section along the axis of the Genesee River Valley
in western New York during mine flooding, with southward movement of saline
groundwater from the Bertie Limestone during mine flooding�������������������������������������������17
12. Generalized hydrogeologic section across the Genesee River Valley in western
New York, showing upward flow of saline water through the rubble chimneys
and into the lower confined aquifer after complete mine flooding and aquifer
recovery���������������������������������������������������������������������������������������������������������������������������������������18
13. Graphs of chloride concentrations in groundwater sampled from wells in the
Genesee River Valley in western New York from 2006 to 2014�������������������������������������������19
14. Logs of lithostratigraphy, natural gamma, electromagnetic-conductivity, and
chloride concentrations, and time-domain electromagnetic soundings from
sites in the Genesee River Valley in western New York�������������������������������������������������������21
15. Lithostratigraphy and gamma and electromagnetic-conductivity logs from 1994
from borehole Lv345 in the Genesee River Valley in western New York���������������������������22
Table
1. Site identification and well logs, chloride samples, and passive-seismic
measurements available for selected wells in the Genesee River Valley in
western New York������������������������������������������������������������������������������������������������������������������������5
Plate
1. Electrical-conductivity transects from time-domain electromagnetic
soundings, top of bedrock estimated from passive-seismic measurements, and
lithostratigraphic logs of selected boreholes along 13 transects in the Genesee
River Valley, western New York, 2016–17vii
Conversion Factors
U.S. customary units to International System of Units
Multiply By To obtain
inch (in.) 25.4 millimeter (mm)
foot (ft) 0.3048 meter (m)
mile (mi) 1.609 kilometer (km)
gallon per minute (gal/min) 3.785 liter per minute (L/min)
Datum
Vertical coordinate information is referenced to the North American Vertical Datum of 1988
(NAVD 88).
Horizontal coordinate information is referenced to the North American Datum of 1983 (NAD 83).
Altitude, as used in this report, refers to distance above the vertical datum.
Supplemental Information
Specific conductance is given in microsiemens per centimeter at 25 degrees Celsius (µS/cm
at 25 °C).
Concentrations of chemical constituents in water are given in milligrams per liter (mg/L).
Abbreviations
Akzo Akzo Nobel Salt Inc. (former owner of the Retsof mine)
bls below land surface
TDEM time-domain electromagnetic
USGS U.S. Geological SurveyTime-Domain Electromagnetic Soundings and
Passive-Seismic Measurements for Delineation of Saline
Groundwater in the Genesee Valley-Fill Aquifer System,
Western New York, 2016–17
By John H. Williams, William M. Kappel, Carole D. Johnson, Eric A. White, Paul M. Heisig, and
John W. Lane, Jr.
associated with saline water in the confined lower part of the
Abstract valley-fill aquifer system. This high-salinity zone delineated
in the lower confined aquifer extends from the mine-collapse
The U.S. Geological Survey, in cooperation with the area northward for more than 2.5 miles (4.0 kilometers).
New York State Department of Environmental Conservation, The chloride concentration in groundwater within this high-
used noninvasive surface geophysics in the investigation of conductivity zone may be about 20,000 milligrams per liter.
the distribution of saline groundwater in the valley-fill aquifer Saline water flowing upward through the bedrock-rubble
system of the Genesee River Valley near the former Retsof chimneys and mixing with northward groundwater flow in the
salt mine in western New York. In 1994, the Retsof salt mine, lower confined aquifer likely is a major source of chlorides for
the largest of its kind in the western hemisphere, underwent a this high-conductivity zone. The northern extent of the zone is
catastrophic roof collapse that resulted in groundwater inflow unclear because of the presence of highly saline water zones
from the valley-fill aquifer system and bedrock fracture zones that were delineated by time-domain electromagnetic sound-
into the mine through two bedrock-rubble chimneys and the ings in the lower confined aquifer and uppermost bedrock and
subsequent dissolution and filling of the mine with saturated are probably associated with historic salt-solution wells in
brine. Since the early 2000s, except for a period of remedial Piffard or possibly sourced from natural brine pools.
pumping in 2006 to 2013, high-salinity water has migrated
upward through the rubble chimneys into the basal part the
aquifer system. The extent of saline-water migration within
the aquifer system had not been evaluated since the end of Introduction
remedial pumping when all the monitoring wells were grouted
shut and abandoned. Installation of a monitoring-well net- The U.S. Geological Survey (USGS), in cooperation
work would be expensive and difficult given the thickness and with the New York State Department of Environmental
heterogeneous character of valley fill. An investigation of the Conservation, used time-domain electromagnetic (TDEM) and
current extent of saline water in the aquifer system was war- passive-seismic methods in the investigation of the distribu-
ranted because the basal part of the aquifer is shallow to the tion of saline water in the valley-fill aquifer system of the
north and it is used for water supply. Genesee River Valley near the former Retsof salt mine in
In fall 2016 and fall 2017, the U.S. Geological Survey western New York (formerly owned by Akzo Nobel Salt Inc.
collected time-domain electromagnetic soundings at 105 sites [Akzo]; fig. 1). In 1994, the Retsof salt mine, the largest of its
along 13 cross-valley transects north and south of the mine- kind in the western hemisphere, underwent a catastrophic roof
collapse area, east of Piffard, and on the Fowlerville Moraine. collapse that resulted in groundwater inflow from the aquifer
The time-domain electromagnetic soundings were colocated system into the mine through two bedrock-rubble chimneys.
with passive-seismic measurements to estimate the bedrock- Since the early 2000s, except for a period of remedial pump-
surface elevation through use of a regression equation devel- ing from 2006 to 2013, high-salinity water has migrated
oped from measurements at well sites with reported bedrock upward through the rock-rubble chimneys and into the basal
depths in the study area. An integrated analysis of the time- part of the aquifer system. The extent of saline-water migra-
domain electromagnetic soundings with the depth-to-bedrock tion in the aquifer system had not been evaluated since the
estimates, well logs, and past chloride-monitoring data sug- end of remedial pumping when all the monitoring wells were
gests the presence of a zone of high electrical conductivity plugged and abandoned. An investigation of the current extent2 TDEM and Passive-Seismic Measurements, Genesee Valley-Fill Aquifer System, New York, 2016–17
77°52’30” 77°45’
5 B
EXPLANATION
20 Avon 20 Alluvial deposit—Fans
consisting of sand and gravel.
Flood-plain deposits consisting
r
e
of fine sand and silt
Riv
15
Fowlerville
Outwash gravel
42°52’30” Moraine
Fowlerville Moraine—Clayey
36 us
Cones silt matrix with embedded
Area shown stones
39
Cree
Genesee
in figure 7
390 Delta—Pebbly sand and silt
k
Lacustrine fine sand, silt,
63
256 and clay
Piffard 20 A
Kame deposit—Silty sand
20 A
and gravel
Geneseo Till moraine—Clayey, sandy
Lake
silt matrix with embedded
stones
Cuylerville
k
ee Till overlying bedrock
Cr 15
Beard Conesus
20 A
s Bedrock
Mount
36
A' Collapse
42°45’ Morris area
Delta Retsof salt mine
39
A 408 Line of geologic section
Mount A A'
Morris Direction of flow
er
Riv
Study
Creek
area
e
se
ne
Sonyea
Ge
NEW YORK
255
ua
eq
256
sh
LOCATION MAP
Ke
Ca
na
ser
ag
390
a
408
258
42°37’30‘’
Cree
k
36 63
Valley
Heads
256
Moraine
Dansville
0 2 4 MILES
436
B' 0 2 4 KILOMETERS
Base from U.S. Geological Survey digital data, 1:100,000, 1983 Geology modified by T.S. Miller (1998) from
E.H. Muller and D.H. Cadwell (1986 and 1988)
Figure 1. Surficial geology of the study area, location of the former Retsof salt mine, and associated features in the Genesee River
Valley in western New York; modified from Yager and others (2001).Time-Domain Electromagnetic Soundings 3
of saline water in the aquifer system was warranted because the resolution of shallow layers. In addition to the equipment’s
the depth to bedrock and the thickness of the basal valley fill ability to monitor the early and late times of the transient sig-
decrease to the north where the water is used for public supply. nal, the factors that control the depth of investigation include
This report describes the application of the time-domain the initial magnitude of the magnetic moment (proportional
electromagnetic and passive-seismic methods and presents to the size of the loop and the current), the attenuation of
an integrated analysis of results from those methods with the signal by the resistivity of the subsurface, and the back-
data from well log and chloride-concentration monitoring ground noise.
to delineate zones of high electrical conductivity associated TDEM sounding data were collected at 105 sites along
with saline water in the valley-fill aquifer during 2016–17. 13 transects in the Genesee River Valley north and south of
The electrical conductivity of the valley fill and underlying the mine-collapse area (pl. 1). In fall 2016, TDEM data were
bedrock were measured along cross-valley transects from collected at 40 sites along 7 transects. In fall 2017, TDEM
1.5 miles (mi; 2.4 kilometers [km]) south to 8 mi (13 km) data were collected at an additional 65 sites to complete
north of the collapsed mine (fig. 1). measurements along 6 of the 2016 transects, and to establish
6 new transects; also, TDEM data collection was repeated at
10 of the 2016 sites. The TDEM data were collected by using
ABEM WalkTEM units with a 40-by 40- or 100- by 100-meter
Time-Domain Electromagnetic (m)-square transmitter loop and 0.5- by 0.5-m and 10- by
Soundings 10-m-square center-loop receivers. The 100- by 100-m-square
loop configuration was used for the 2016 soundings, and the
TDEM soundings and passive-seismic measurements 40- by 40-m-square loop configuration was used for the 2017
were analyzed by using well logs and groundwater-sample soundings. The dual-moment surveys use a low moment (and
data from previous investigations to delineate subsurface a low current of about 2 amperes) for early-time shallow mea-
zones of high electrical conductivity associated with saline surements and a high moment (about 15-A current) for late-
groundwater in the lower part of the valley fill and the time deep measurements. The voltage decay of the induced
underlying bedrock. The TDEM sounding method uses a field was measured with two receivers, resulting in four sets
transmitter to drive an electrical current through a square loop of measurement data at the same site (high moment from both
of insulated cable on the ground and a receiver to measure receivers, low moment from both receivers). TDEM data col-
the current induced in the subsurface (fig. 2). The current lection at several 2016 sites was repeated in 2017 with differ-
has equal on-and-off time periods and base frequencies that ent WalkTEM units and loop configurations to ensure that the
generally range from 30 to 300 hertz (Hz). Termination of the two datasets provided consistent results for the investigation
current flow is not instantaneous but occurs over a very brief target and could be combined into a single group of data for
period (a few microseconds) known as the ramp time, during the purposes of the study.
which the magnetic field varies. The time-variant nature of the The relation between the TDEM voltage-decay curve
primary electromagnetic field creates a secondary electromag- recorded at the receivers and the subsurface conductiv-
netic field in the ground beneath the loop that, in accordance ity was determined by the use of Aarhus HydroGeophysics
with Faraday’s law, generally mirrors the transmitter loop Group SPIA software and methods described by Auken and
(Christiansen and others, 2006). This secondary field immedi- others (2015). The data at each site were filtered to identify
ately begins to decay, generating additional eddy currents that and remove background noise caused by the measurement
propagate downward and outward into the subsurface like a electronics or environmental sources. For all TDEM surveys,
series of smoke rings. the following steps were taken to mitigate noise: (1) removal
Measurements of the secondary currents are made dur- of early-time noise; (2) application of a standard-deviation
ing the time-off period by one or more receivers located in threshold to data at each time gate and removal of data
the center of the transmitter loop. The signal strength of the points that exceed that threshold; and (3) identification of the
decaying currents at specific times and depths is controlled background noise and removal of all late-time decay before
by the bulk conductivity of the subsurface, which includes encountering the noise floor. For each sounding, data from
the conductivity of subsurface rock and sediment units and both magnetic moments (caused by low current and high cur-
their contained fluids (Stewart and Gay, 1986; McNeill, 1994; rent) and both receivers were combined and inverted together.
Auken and others, 2008). The subsurface conductivity is esti- The TDEM decay data were inverted without constraint
mated from the voltage-decay curve collected at the receiver by using both smooth- and layered-model approaches to gen-
through an inversion process described below. The depth of erate resistivity models of the subsurface. The smooth models
investigation depends on the time interval after shutoff of the have multiple (approximately 20) layers with fixed thicknesses
current and the signal strength of the late-time signal; at later that change gradually, whereas the layered models have fewer
times, the receiver is sensing eddy currents at progressively layers with blocky or stepped transitions between the layers.
greater depths. At early times, the receiver senses shallow Resistivity units were converted to conductivity units by use
depths; hence, shorter reception-time periods are required for of the equation:4 TDEM and Passive-Seismic Measurements, Genesee Valley-Fill Aquifer System, New York, 2016–17
Controller Receiver Passive-Seismic Measurements
and Batteries loop
Transmitter The horizontal-to-vertical spectral ratio ambient-noise
loop seismic technique (commonly referred to as the passive-
seismic method) is used to estimate the thickness of uncon-
solidated sediments and the depth to bedrock (Nakamura,
1989). The passive-seismic method uses a single, broad-band
three-component (two horizontal and one vertical) seismom-
eter to record ambient seismic noise. In areas that have a
strong acoustic contrast between the bedrock and overlying
sediments, the seismic noise induces resonance at frequencies
that range from about 0.3 to 40 Hz. The ratio of the average
horizontal-to-vertical spectrums produces a spectral-ratio
curve with peaks at fundamental and higher-order resonance
frequencies. The spectral-ratio curve (the ratio of the aver-
aged horizontal-to-vertical component spectrums) is used to
Time-domain signal
determine the fundamental resonance frequency that can be
gets larger at depth
used with an average shear-wave velocity or a power-law
Figure 2. Features of the time-domain electromagnetic
regression equation to estimate sediment thickness and depth
equipment and characterization of the transmission and reception
to bedrock (Lane and others, 2008; Brown and others, 2013;
of electromagnetic signals; modified from Payne and Teeple
Chandler and Lively, 2014; Johnson and Lane, 2016).
(2011). Time domain signals are sent down and received back from
The passive-seismic measurements were colocated with
various depths.
the 105 TDEM sounding sites (pl. 1). Passive-seismic mea-
surements were collected at or near 13 well sites with reported
depths to bedrock (table 1). The horizontal-to-vertical spectral
1
_ ratio data were collected for 30 minutes at each site by using
σ =
ρ × 1, 000, (1)
Tromino Model TEP–3C three-component seismometers.
The horizontal-to-vertical spectral ratio data were processed
where with Tromino Grilla software to remove anthropogenic noise,
σ is conductivity, in millisiemens per meter; and convert the time-domain data to frequency domain, compute
ρ is resistivity, in ohm-meters. and plot the spectral-ratio curve, and determine the resonance
frequency.
The conductivity of a sand-and-water mixture as measured by
The resonance-frequency peaks for the passive-seismic
the TDEM method is related to the conductivity of the water
measurements collected near well sites with reported depths
by the empirical relation described by Archie (1942) and pre-
to bedrock were used to develop a regression equation to
sented by McNeill (1980) as follows:
estimate the depth to bedrock at the other measurement
σ χ sites. A power-law regression equation was derived for the
_
σ = n ,
m (2) study area by using measurements at 12 well locations with
ω
known depths to bedrock (fig. 3; table 1). The passive-seismic
where measurement at well Lv340, which penetrated more than
σχ is the conductivity of the sand-and-water 80 feet (ft; 24 meters [m]) of very dense till (presumably with
mixture, in millisiemens per meter; a greater shear-wave velocity than that in the more typical
σω is the conductivity of water, in millisiemens valley-fill sediments), was not used in the regression. The
per meter; regression, which has a coefficient of determination (R2) of
n is the porosity of the sand-and-water 0.9379, relates the resonance frequency (fr) to the depth to
mixture; and bedrock (Z), in feet, as follows:
m is a constant (typically 1.4 to 1.6 for
natural sands).
Z = 367.42
f r−1.084. (3)
The depth of investigation of the TDEM soundings were The local regression equation was used to estimate depth
determined by using methods described by Christiansen and to bedrock at all other sites where the resonance frequency
Auken (2012). The TDEM-soundings results were visualized had been determined. Estimated depths to bedrock deter-
in two-dimensional profiles created by use of the Aarhaus mined from the equation generally were within 10 percent
Workbench software. The TDEM-sounding locational infor- of the reported depths to bedrock at the 12 control locations.
mation, raw data, and inversions are available from White and The passive-seismic-measurement location information,
others (2021).Passive-Seismic Measurements 5
Table 1. Site identification and well logs, chloride samples, and passive-seismic measurements available for selected wells in the
Genesee River Valley in western New York.
[Well locations shown on plate 1. Lv302 indicates Livingston County well number assigned by the U.S. Geological Survey (USGS). Akzo, Akzo Nobel Salt Inc.
(Retsof) mine; no., number; ID, identification number; X, available data; —, data not available; T, time-series samples available from 2004 to 2015; M, miscel-
laneous chloride samples available on various dates]
Akzo
USGS local Resistivity/ Chloride Passive
well USGS site ID Geologist1 Gamma2
well no. conductivty2 sample3 seismic4
no.
Lv302 9402 424658077505301 X X5 — — —
Lv309 9409 424629077513701 X X6 X6 T —
Lv322 9422 424637077513501 X X7 — T —
Lv334 9901 425202077490301 X — — M X
Lv335 9902 425030077494601 X — — M X
Lv336 9903 425112077491801 X — — M X
Lv340 9440 424907077510501 X X8 X9 M X
Lv345 9445 424719077512801 X X10 X11 — —
Lv346 9446 424626077515102 X X12 — T X
Lv349 9449 424528077510201 X X13 — M —
Lv350 9450 424528077510202 — — — M X
Lv351 9451 424528077510203 — — — M —
Lv360 9460 424521077521401 X — — M X
Lv368 9568 424626077515103 X — — T —
Lv397 7901 424743077505102 — — X14 M X
Lv421 21 425000077505001 — — — M —
Lv530 0405 424623077512501 X — — T X
Lv531 0501 424624077512501 X — — T —
Lv532 0502 424655077512501 X — — T X
Lv533 0503 424643077513001 X — — T X
Lv535 0505 424558077513802 X — — T X
Lv536 0506 424626077521401 X — — — X
1Logs available from Empire State Organized Geologic Information System (New York State Department of Environmental Conservation, 2019) by searching
on Akzo well number.
2Logs downloaded in log ASCII standard format from USGS GeoLog Locator (U.S. Geological Survey, 2019).
3Chloride sample data available from Kappel and Williams (2021).
4Passive-seismic measurement at or near well site available from Heisig and others (2021).
5Log available at https://txdata.usgs.gov/GeoLogArchiver/odata/Logs(26833)/LogFile.
6Log available at https://txdata.usgs.gov/GeoLogArchiver/odata/Logs(18643)/LogFile.
7Log available at https://txdata.usgs.gov/GeoLogArchiver/odata/Logs(18655)/LogFile.
8Log available at https://txdata.usgs.gov/GeoLogArchiver/odata/Logs(18654)/LogFile.
9Log available at https://txdata.usgs.gov/GeoLogArchiver/odata/Logs(18653)/LogFile.
10Log available at https://txdata.usgs.gov/GeoLogArchiver/odata/Logs(26835)/LogFile.
11Log available at https://txdata.usgs.gov/GeoLogArchiver/odata/Logs(26836)/LogFile.
12Log available at https://txdata.usgs.gov/GeoLogArchiver/odata/Logs(26834)/LogFile.
13Log available at https://txdata.usgs.gov/GeoLogArchiver/odata/Logs(18651)/LogFile.
14Log available at https://txdata.usgs.gov/GeoLogArchiver/odata/Logs(18646)/LogFile.6 TDEM and Passive-Seismic Measurements, Genesee Valley-Fill Aquifer System, New York, 2016–17
600
Lv360 Lv535
Reported depth to bedrock, in feet below land surface Lv530
500 Lv532
Lv533 Lv346
Lv397
400
Lv350
Lv340
300
Lv335
Lv336 Lv334
200
Lv536
100
0.5 0.75 1.0 1.25 1.5 1.75 2.0
Resonance frequency, in hertz
Figure 3. Regression of peak-resonance frequencies from passive-seismic measurements with reported depths to bedrock at wells in
the Genesee River Valley in western New York. Blue dots indicate reported depth to bedrock from each well used in the regression; the
orange dot identifies data for well Lv340, which was not used in the development of the regression equation.
spectral-ratio curves, fundamental resonance-frequency peaks,
and reported and estimated depths to bedrock are available
Groundwater Samples for Salinity
from Heisig and others (2021). Groundwater-sample analyses were compiled to provide
information on the historic distribution of salinity in the val-
ley fill and bedrock to aid in the interpretation of the TDEM
Well Logs soundings (table 1). Salinity and chloride data have been
collected in the Genesee valley-fill aquifer system as part of
Geologic logs from drilling samples from 18 wells were salt-extraction activities since the start of solution mining in
analyzed to characterize the lithostratigraphy of the val- the early 1890s. Multiple monitoring wells were installed after
ley fill and upper bedrock along and between the 13 TDEM the mine collapse and were used for monthly chloride sam-
and passive seismic transects in the Genesee River Valley pling from 1994 through 1996. Monthly samples for chlorides
(table 1). Gamma logs from seven of the wells were used in were collected from 2004 through 2014 from a groundwater-
the lithostratigraphic analysis. Resistivity and electromagnetic sampling network that was established in the Genesee
logs from four wells provided some limited information on the River Valley as part of a brine-mitigation activity (Alpha
electrical conductivity of the valley fill and shallow bedrock. Geoscience, 2000; Akzo Nobel Salt Inc., written commun.,
The well logs had been collected as part of previous salt- 2014). The network included wells that were actively pumped
extraction and related activities and mine-collapse investiga- for brine mitigation and monitoring wells in and near the col-
tions in the river valley. The geologic logs are available from lapse area. Of the nine wells monitored for chloride concentra-
the Empire State Organized Geologic Information System tion, some monitored only one zone, and others monitored up
(New York State Department of Environmental Conservation, to eight zones. The lower confined aquifer was monitored by
2019), and the geophysical logs are available from the USGS six wells, and other wells monitored the underlying bedrock
well-log database (U.S. Geological Survey, 2019). at various depths. Semiannual samples for chlorides were
collected from 1997 to 2014 from monitoring wells north and
south of the collapse area and from domestic water-supply
wells north of the collapse area near Fowlerville, New York
(Akzo Nobel Salt Inc., written commun., 2014). The compiled
chloride and salinity data, including data sources, are available
from Kappel and Williams (2021).Hydrologic Setting 7
Geologic Setting Hydrologic Setting
The Genesee River Valley was formed by tectonic uplift The valley-fill aquifer system in the Genesee River Valley
and subsequent fluvial downcutting of Paleozoic sedimentary is underlain and bounded by bedrock and consists of three
rocks, glacial erosion of the bedrock, and deposition of a thick aquifers separated by two confining units (fig. 6; Yager and
complex sequence of glacial sediments, which were then mod- others, 2001). The hydrologic setting of the aquifer system in
ified by postglacial streams. The bedrock, glacial, and postgla- the Genesee River Valley was described by Yager and others
cial geology of the Genesee River Valley described by Yager (2001) and is summarized in the following sections.
and others (2001) is summarized in the following sections.
Aquifer and Confining Units
Bedrock Geology
The valley-fill aquifer system consists of an unconfined
The salt-bearing and overlying rocks in the Genesee aquifer, upper confining unit, middle confined aquifer, lower
River Valley are sedimentary units of Silurian and Devonian confining unit, and lower confined aquifer (fig. 6). The degree
age that include the following formations, in ascending order: of hydraulic connection among these three aquifers in areas
the Vernon Shale, Syracuse Formation, Camillus Shale, Bertie along the edges of the valley, where the confining units may
Limestone, Onondaga Limestone, and the Marcellus and be thin or absent, is not well characterized. The upper aquifer
younger Devonian shales (figs. 4 and 5). The regional dip of consists of saturated fluvial and alluvial sediments below the
the bedrock strata is less than 1 degree to the south. A regional water table and above the upper confining unit. The con-
unconformity separates the Late Silurian Bertie Limestone tact between the upper aquifer and the upper confining unit
from the Middle Devonian Onondaga Limestone. The is nearly flat. The upper confining unit separates the upper
Onondaga Limestone subcrop forms the shallowest part of the aquifer from the middle aquifer and consists of lacustrine
buried bedrock surface along the central part of the Genesee fine-grained sediments and till. The confining unit is bounded
River Valley in the study area. The Devonian shales underlie locally by coarser deposits near the valley walls (for example,
the eastern and western edges and walls of the valley and the through deltaic deposits near Mount Morris) that provide some
uplands. hydraulic connection between the upper and middle aquifers
(fig. 1). The confined middle aquifer consists of sand and
gravel and has an undulating upper surface. The lower confin-
Glacial and Postglacial Geology ing unit that separates the middle and lower aquifers consists
of lacustrine and till deposits. Glaciofluvial deposits, if locally
Glacial erosion deepened the preglacial Genesee River
present, would provide hydraulic connection between the
Valley by as much as 600 ft (180 m) and widened it, creating
middle and lower aquifers. The lower confined aquifer over-
a concave, north-south bedrock profile. The eroded bedrock
lies the bedrock valley floor and consists of glaciofluvial sand
surface of the resistant Onondaga Limestone slopes southward
and gravel.
from Fowlerville near the north end of the study area, where
The fractured and solutioned upper part of the underly-
it subcrops at an altitude of approximately 400 ft (120 m), to
ing Onondaga Limestone in the bedrock valley bottom is
the south end of study area, where it subcrops near Sonyea at
considered part of the lower confined aquifer, effectively
an altitude of approximately 50 ft (15 m; fig. 4). The uncon-
increasing its transmissivity and lateral continuity. Fractures in
solidated sediments that partly fill the Genesee River Valley
the shales that form the bedrock valley walls provide limited
were deposited during glacial advances and retreats and, to a
connections between the lower confined aquifer and bedrock
lesser extent, during postglacial time (fig. 4). Subglacial melt-
aquifers in the bordering uplands. Water-bearing zones in the
water deposits of sand and gravel overlie the bedrock valley
bedrock underlying the Genesee valley-fill aquifer system are
floor. The basal deposits are overlain by a thick sequence of
aligned along nearly horizontal bedding-plane fractures near
englacial and lacustrine deposits including variably silty sand,
stratigraphic contacts. The principal bedrock water-bearing
gravel, till, and fine sand, silt, and clay. A relatively thin layer
zone underlying the valley is a fracture zone near the contact
of supraglacial meltwater deposits of sand and gravel overlie
between the Onondaga and Bertie Limestones (fig. 5).
the englacial and lacustrine deposits. Above the supraglacial
sand and gravel, thick deposits of lacustrine and deltaic sand,
silt, and clay are present. An apparent till layer consisting Groundwater Flow
of reworked and compacted lacustrine sediments with some
stones marks a possible ice readvance (figs. 4 and 5). The Groundwater within the valley originates as precipita-
Fowlerville Moraine fills the valley in the northernmost part tion onto the valley floor and the surrounding uplands and
of the study area (figs. 1 and 5). Overlying the glacial deposits discharges to the Genesee River and Canaseraga Creek and
are fluvial and alluvial sediments, including sand and gravel their tributaries (fig. 1) or as underflow to downgradient areas.
deposited as fans and in stream channels, and overbank fine Groundwater flow is generally northward through the aqui-
sand, silt, and clay. fer system, and discharge is to the major streams. The upper8 TDEM and Passive-Seismic Measurements, Genesee Valley-Fill Aquifer System, New York, 2016–17
WEST EAST
A A'
FEET FEET
800 Genesee River Valley flood plain 800
Genesee River
700 channel 700
600 Lv360 Lv349 600
500 500
400 400
Devonian Devonian
shales shales
300 300
(undifferentiated) (undifferentiated)
200 200
100 100
SEA LEVEL SEA LEVEL
NAVD 88 Onondaga Limestone Unconformity NAVD 88
−100 Bertie Limestone −100
Camillus Shale
−200 −200
−300 Syracuse Formation −300
−400 −400
Vernon Shale
−500 Retsof salt mine in the Vernon B6 salt −500
−600 −600
VERTICAL EXAGGERATION ×10 0 2,000 4,000 FEET
0 500 1,000 METERS
EXPLANATION
Unconsolidated deposit
Alluvial-fan and flood-plain deposit—Silt, sand, and gravel
Lacustrine sand, silt, and clay
Deltaic deposit—Pebbly sand
Till—Dense silt and clay embedded with pebbles
Supraglacial debris—Silty sand and gravel
Englacial meltout material and subaqueous
deposit—Mix of clay, silt, sand, and gravel
Subglacial meltwater deposit—Sand and gravel
Lv349 Well and U.S. Geological Survey (USGS)
well number—Number and Lv prefix
(Livingston County) assigned by the USGS
Extent of the Vernon B6 salt
Figure 4. Generalized geologic section across the Genesee River Valley in western New York; modified from Yager and others (2001).
Location of section shown on figure 1. NAVD 88, North American Vertical Datum of 1988.NORTH SOUTH
Fowlerville
B Moraine B'
SECTION
BEND IN
FEET Collapse Sonyea FEET
SECTION
BEND IN
SECTION
SECTION
BEND IN
800 800
SECTION
BEND IN
Avon Geneseo Dansville
SECTION
area
BEND IN
B–B'
SECTION
BEND IN
SECTION
SECTION
BEND IN
Lv13
A–A'
Lv21
Lv442 Lv29
Gas well Gas well Lv369 (projected) Lv46
600 16108 17445 Lv422 Lv346 Lv360 Lv399 Lv365 600
400 400
200 200
Onon
SEA LEVEL daga SEA LEVEL
Bert Lim
NAVD 88 ie Lim estone NAVD 88
Cam e ston Devonian shales
illus e
Shal (undifferentiated)
−200 e, Sy −200
racu
Rets se F
of sa orma
lt mi tion,
ne in and
−400 the V Vern −400
erno on S
Ol n B6 hale Unc
onfo
silts der Silu salt rmity
tone r
s, an ian sha
−600 d sa le −600
nds s,
tone
s
−800 −800
VERTICAL SCALE GREATLY EXAGGERATED 0 5 10 MILES
SEA LEVEL IS NORTH AMERICAN VERTICAL DATUM OF 1988
0 5 10 KILOMETERS
EXPLANATION
Unconsolidated deposit
Alluvial-fan and flood-plain deposit—Silt, sand, Englacial meltout material and subaqueous-fan
and gravel deposit—Mix of clay, silt, and sand and gravel
Lacustrine sand, silt, and clay
Subglacial meltwater deposit—Sand and gravel
Deltaic deposit—Pebbly sand Lv349
Well and U.S. Geological Survey (USGS) well number—
Dashed where projected. Numbers with Lv prefix
Till—Silt and clay embedded with pebbles
(Livingston County) were assigned by the USGS. Numbers
for gas wells were assigned by the New York State Department
Hydrologic Setting 9
Supraglacial debris—Silty sand and gravel
of Environmental Conservation
Extent of the Vernon B6 salt
Figure 5. Generalized geologic section along the axis of the Genesee River Valley in western New York; modified from Yager and others (2001). Location of section shown on
figure 1. NAVD 88, North American Vertical Datum of 1988.10 TDEM and Passive-Seismic Measurements, Genesee Valley-Fill Aquifer System, New York, 2016–17
WEST EAST
A Recharge from precipitation A'
FEET Ru FEET
800 upl noff 800
and from from
are Genesee River off eas
700 as Run nd ar 700
channel a
upl
600 600
Discharge
500 to river 500
fra
ce
ctu
Lea d be
ck gh
rfa
dro ou
re
su
kag droc
400 400
be thr
et ks
red age
hro urf
300 300
ctu ak
ug ace
fra Le
h
200 Devonian shales 200
(undifferentiated)
100 100
SEA LEVEL Onondaga Limestone SEA LEVEL
NAVD 88 NAVD 88
VERTICAL EXAGGERATION ×10 0 2,000 4,000 FEET
EXPLANATION 0 500 1,000 METERS
Unconsolidated deposit
Alluvial-fan and flood-plain deposit—Silt, sand, Englacial meltout material and subaqueous-fan
and gravel deposit—Mix of clay, silt, and sand and gravel
Lacustrine sand, silt, and clay Subglacial meltwater deposit—Sand and gravel
Deltaic deposit—Pebbly sand Lv349
Well and U.S. Geological Survey (USGS) well number—
Dashed where projected. Numbers with Lv prefix
Till—Silt and clay embedded with pebbles
(Livingston County) were assigned by the USGS. Numbers
Supraglacial debris—Silty sand and gravel for gas wells were assigned by the New York State Department
of Environmental Conservation
Water table in upper aquifer
Direction of water flow
Figure 6. Generalized hydrogeologic section across the Genesee River Valley in western New York; modified from Yager and others
(2001). Location of section shown on figure 1. NAVD 88, North American Vertical Datum of 1988.
aquifer is recharged by infiltration of precipitation on the val- Distribution of Fresh and Saline Groundwater
ley floor and runoff from the uplands. The middle and lower
confined aquifers are recharged through the Valley Heads Valley-Fill Aquifer System
Moraine southeast of Dansville and locally along the sides of
the valley wall. Groundwater discharges from the aquifers as Groundwater in the upper aquifer in the Genesee valley-
underflow to the north of the study area. Hydraulic heads in fill aquifer system is fresh. Groundwater in the middle aquifer
the confined aquifers beneath the valley floor under natural is relatively fresh with specific-conductance values of 400 to
conditions are believed to be higher than in the aquifers, but 1,400 microsiemens per centimeter at 25 degrees Celsius
any upward leakage is severely limited by the overlying con- (μS/cm) and chloride concentrations of 25 to 140 milli-
fining units. grams per liter (mg/L; Yager and others, 2001; Kappel and
Williams, 2021). The salinity of groundwater in the lower
aquifer is higher and more variable than that in the middle
aquifer. Groundwater from the lower confined aquifer in the
collapse area, whose salinity was assumed to represent the
salinity before the collapse, had specific-conductance values
of 1,000 to 2,500 μS/cm and chloride concentrations of about
500 mg/L (Williams, 1996; Kappel and Williams, 2021).Hydrologic Setting 11
Groundwater samples from wells in the lower aquifer In the lower aquifer, the most saline groundwater, which
in the Fowlerville area had specific-conductance values that had a specific conductance of 39,300 μS/cm and a chloride
ranged from 1,450 to 12,400 μS/cm and chloride concen- concentration of 14,300 mg/L, was sampled in 1995 from
trations that ranged from 300 to 4,300 mg/L (Kappel and borehole Lv397 (figs. 7 and 8; Kappel and Williams, 2021).
Williams, 2021). The ratio of chloride to bromide concentra- Geophysical and drilling logs at this well site indicated the
tions in the high salinity samples might be the result of water presence of fresh water in the middle aquifer and saline water
mixing with the saline waters in the Bertie Limestone unit. in the lower aquifer in 1979 (fig. 8). The 1979 logs and the
77°54’ W 77°51’ W
42°51’ N
Livingston
salt well EXPLANATION
Retsof salt mine boundary
Genesee
salt wells Syracuse D salt—Halite present
(5)
Syracuse D salt—Brine present
Syracuse D salt—Neither halite
nor brine present
Lv340 Stream, dashed where intermittent
Direction of water flow
er
Beards Creek
ee Riv
Lv360 Monitoring well—Number
assigned by the U.S. Geological Survey
Genes
19413 Natural gas well—Number
assigned by the New York
Department of Environmental
Conservation
Former salt-solution well
42°48’ N
Lv397
Lv396
02206
Lv345
Lv302
Lv301
Lv311
Lv326
Pioneer
salt well Lv327
Genesee River
Beards Creek
Lv341
19413
Lv360
42°45’ N
0 2,000 4,000 FEET
0 500 1,000 METERS
Figure 7. Distribution of the Syracuse D salt and brine pools in the Genesee River Valley in western New York; modified from Gowan
and Trader (2000, p. 68, fig. 14).12 TDEM and Passive-Seismic Measurements, Genesee Valley-Fill Aquifer System, New York, 2016–17
Well Lv397
Lithostratigraphy Chloride concentration Electrical conductivity
0 mg/L 40,000 0 mS/m 400
Depth, Depth,
TDEM counductivity sounding
in ft bls in ft bls
0 mS/m 400
0 0
EXPLANATION
50 50 Unconsolidated deposit
Alluvial-fluvial
100 100
Glaciolacustrine
150 150 Mixed glacial
Glaciofluvial
200 200
Bedrock
250 250
Onondaga Limestone
300 300 Bertie Limestone
350 350 TDEM sounding conductivity,
in mS/m—Measured at
site 27 in 2016
400 400
Electrical conductivity,
in mS/m—Measured in 1979
450 450
500 500 Chloride concentration,
in mg/L—Line shows range of depth
from which groundwater sample
550 550 was collected. Measured in 1995
Top of bedrock
600 600
Figure 8. Log of lithostratigraphy, chloride concentration in groundwater sampled from retrofitted borehole Lv397 in 1995, log of
electrical conductivity measured in 1979, and the results of the 2016 time-domain electromagnetic (TDEM) sounding at nearby site 27
in the Genesee River Valley in western New York. Locations of borehole and sounding site shown on plate 1. ft, foot; bls, below land
surface; mS/m, millisiemens per meter; mg/L, milligram per liter.
ratio of chloride to bromide concentrations in a water sample bromide concentrations of water in the Onondaga and Bertie
from the well in 1995 indicate that the salinity of groundwater Limestones were close to those reported for nearby oil-field
in the lower aquifer in this area might have been affected by brines pumped from carbonates in western New York.
salt-mining- or salt-solution-related activities before the mine
collapse (Yager and others, 2001).
Salt-Solution Wells
Onondaga and Bertie Limestones Salt from the Salina evaporite beds was also extracted by
solution through multiple wells along the western valley wall
Groundwater in the fracture zones of the Onondaga of the Genesee River Valley during the late 1800s (pl. 1). The
and Bertie Limestones is saline. The specific conductance salt-solution sites included the Phoenix, Genesee, Livingston,
measured in groundwater samples collected in 1994 from and York wells. Leakage during these salt-extraction opera-
several wells near the collapse area in the Onondaga and tions or from the abandoned and unplugged solutioning wells
Bertie Limestone zones increased with depth and ranged could have contaminated groundwater in bedrock-fracture
from 10,000 to 50,000 μS/cm (Williams, 1996). Yager zones and one or more aquifers in some areas.
and others (2001) noted that the ratios of the chloride toHydrologic Effects of Mine Collapse 13
Syracuse D Salt and Brine Pools Hydrologic Effects of Mine Collapse
The initial water flow that resulted from the mine collapse
and entered the 2 Yard South and 11 Yard West panel rooms Mine Collapse, Rubble Chimneys, and Flooding
(rooms mined in the Vernon B6 salt unit) was a combination
of brine and natural gas followed by less saline water from The roofs in two yielding-pillar mining panels or rooms
bedrock-fracture zones and the lower confined aquifer (Gowan in the southern part of the Retsof mine collapsed during the
and Trader, 2000, fig. 7). Geologic and geophysical data were spring of 1994. Yielding-pillar technology was being used in
assessed from waters in the well network along the floor of the mine to mitigate the increased occurrence of mine floor
the Genesee Valley as well as from former solution-mining heaves and mine roof collapses, in one case resulting in the
operations that had taken place in the late 1800s (fig. 7). The deaths of two miners. The mine collapse, rubble-chimney
data from the solution-mining wells were used to identify development, and flooding were described by Yager (2013)
several locations along the western side of the Genesee River and are summarized below.
Valley, where natural brine and pressurized natural-gas pools On March 12, 1994, the roof over the mine panel 2 Yard
were in the Syracuse D salt unit. Just west of the southern end South collapsed, and saline water began to flow into the mine.
of the mine near the hamlet of Cuylerville (fig. 1), the former Over the next several weeks, as Akzo attempted to save the
Pioneer Salt Company (later named Phoenix Dairy Company) mine by pumping water out and drilling around the collapse
solution-mining well penetrated a pressurized brine pool area to inject cement grout into the collapsed room and thus
where the Syracuse D salt unit was presumed to have been. prevent further inflow of water, unstable shale and evapo-
The pressurized brine and natural gas were used to lift brine rite layers overlying the panel sagged and collapsed to form
developed in the lower Vernon B salt to the land surface. In a roughly circular zone of rock rubble (collapse chimney)
a similar fashion, near the hamlet of Piffard, which is north that propagated upward. The propagating collapse chimney
of the Retsof mine, two solution-mining operations (Genesee eventually reached the Onondaga Limestone, which was
Salt Co. and Livingston Salt Co.) were active, and a similar strong enough to temporarily halt further collapse and upward
Syracuse D pressurized brine pool was present instead of salt. progression of the rock-rubble chimney. At this time, the flow
Gowan and Trader (2000, p. 68) summarized the distribution of water into the previously dry (unflooded) mine was about
of the Syracuse D salt and brine pools in the Genesee River 5,500 gallons per minute (gal/min; 21,000 liters per minute
Valley (fig. 7). The Syracuse D salt, as halite, is generally [L/min]). Much of the inflow probably was from the fracture
present south and east of the collapse area but absent north and zone near the Onondaga-Bertie contact (labeled “unconfor-
west of the collapse area—however, there are some locations mity” on fig. 9).
where the salt bed is present only as a brine. The brine pools On April 6, 1994, the Onondaga Limestone at the floor of
presumably were developed by fresh groundwater that dis- the valley collapsed into the void created below this resistant
solved the Syracuse D salt. During glaciation, highly pressured bedrock strata by the previous collapse in the mine and the
subglacial waters may have been forced downward through void’s propagation upwards through the intervening shale
fractures and dissolved the salt bed in these areas. bedrock. The overlying valley-fill sediments quickly slumped
downward into the resulting cavity creating a subsidence
zone in the unconsolidated materials and forming a sinkhole
Devonian Shales at the land surface. Water from the lower confined aquifer
drained downwards through the rock-rubble chimney into the
In several locations along the flanks of the Genesee River mine (fig. 9). In mid-April, a second collapse in an adjacent
Valley, natural gas and pockets of saline water have been mining panel (11 Yard West) resulted in the development of
reported in some shallow domestic wells that tap the Devonian a second rock-rubble chimney, unconsolidated subsidence
shales. A 160-ft deep domestic well drilled in 2003 along the zone, and eventually a sinkhole at land surface. Inflow to
eastern valley wall reportedly yielded saline water from the the mine through the two rubble chimneys was about
fractured top of bedrock (S.W. Gowan, Alpha Geoscience, 18,000 gal/min (68,000 L/min), and all attempts to save the
oral commun., 2017). Saline water with elevated chloride mine were abandoned.
concentrations has been reported for other domestic wells Water filled the southern end of the mine and then spread
completed in Devonian shales of western and central New steadily northward, dissolving the bases of the salt pillars that
York. This saline water is believed to be a remnant of salty supported the mine roof. As the pillars gave way, the southern
water that had not been flushed out of the shale by active part of the mine began to collapse, causing the land surface
groundwater circulation. above it to subside (fig. 10). The greatest subsidence was
beneath the two sinkholes, which altered the channel of Beards
Creek and forced the closure of the bridge over Beards Creek.
More widespread subsidence north and south of the collapse
area altered patterns of sediment scour and deposition in the
Genesee River and widened its flood plain.You can also read