Transcription activation is enhanced by multivalent interactions independent of phase separation
←
→
Page content transcription
If your browser does not render page correctly, please read the page content below
Transcription activation is enhanced by multivalent
 interactions independent of phase separation

 Jorge Trojanowski1,§, Lukas Frank1,§, Anne Rademacher1,
 Pranas Grigaitis1,2 and Karsten Rippe1,*

1
 Division of Chromatin Networks, German Cancer Research Center (DKFZ) and Bioquant,
Heidelberg, Germany
2
 present address: Systems Biology Lab, Amsterdam Institute of Molecular and Life Sciences
(AIMMS), Amsterdam, The Netherlands

§
 These authors contributed equally to this work

* Address correspondence to Karsten Rippe (karsten.rippe@dkfz.de)

Keywords: gene regulation; phase-separation; transcription factor; transcription dynamics;
residence time; CRISPR; dCas9; optogenetics; BRD4; acetylation; kinetic proofreading;
multivalent interactions

 1
Summary
Transcription factors (TFs) consist of a DNA binding and an activation domain (AD) that are
considered to be independent and exchangeable modules. However, recent studies conclude
that also the physico-chemical properties of the AD can control TF assembly at chromatin by
driving a phase separation into transcriptional condensates. Here, we dissected transcription
activation by comparing different synthetic TFs at a reporter gene array with real-time single-
cell fluorescence microscopy readouts. In these experiments, binding site occupancy,
residence time and co-activator recruitment in relation to multivalent TF interactions were
compared. While phase separation propensity and activation strength of the AD were
correlated, the actual formation of liquid-like TF droplets had a neutral or inhibitory effect on
transcription activation. Rather, we conclude that multivalent AD mediated interactions
increase the transcription activation capacity of a TF by stabilizing chromatin binding and
mediating the recruitment of co-activators independent of phase separation.

Introduction
The induction of gene expression in eukaryotes involves the binding of transcription factors
(TFs) and co-activators at the promoter to induce the assembly of the active RNA polymerase
II (Pol II) transcription machinery (Andersson and Sandelin, 2020; Haberle and Stark, 2018;
Osman and Cramer, 2020). The vast majority of TFs contain a structurally well-defined DNA-
binding domain (DBD) and a separate activation domain (AD) (Frankel and Kim, 1991). The
ADs typically comprise intrinsically disordered regions (IDRs) with acidic residues that keep
aromatic residues exposed to the solvent (Staller et al., 2018). Synthetic TFs have been
successfully constructed by combining DBDs and ADs in a modular manner (Brent and
Ptashne, 1985; Chavez et al., 2015; Sadowski et al., 1988). Frequently employed ADs with a
particularly high transcription activation capacity are VP16 from a herpes simplex virus
protein (Sadowski et al., 1988) and VPR (VP64-p65-Rta), a tripartite synthetic construct that
consists of VP64 (4 copies of VP16) fused to the p65 and Rta ADs (Chavez et al., 2015). In
addition, it is well established that the TF promoter binding site occupancy θ is a key factor
that regulates the strength of transcription activation (Bintu et al., 2005). The value of θ is
determined by the free TF concentration [TF] and the ratio of the kinetic on- and off-rates for
binding: = [ ]⁄([ ] + !"" ⁄ !# ,. Thus, the target sites become fully saturated if TF
concentrations are sufficiently high. In addition, not only binding site occupancy but also TF
residence time as given by $%& = 1⁄ !"" could determine the transcriptional activation
capacity (Brouwer and Lenstra, 2019; Callegari et al., 2019; Clauss et al., 2017; Gurdon et al.,
2020; Loffreda et al., 2017; Shelansky and Boeger, 2020). The value of tres can become rate
limiting for a multi-step activation process if a TF binding event with a certain duration is

 2

required to drive a subsequent reaction that induces transcription. The TF chromatin
interactions that determine both the binding site occupancy and the TF residence time are
thought to be mostly determined by the DBD. However, a number of recent studies showed
that TF assembly at chromatin is not limited to direct interactions of the DBD with DNA. The
intrinsically disorder region (IDRs) found in TFs like SP1, TAF15, OCT4, b-catenin, STAT3 and
SMAD3 as well as transcriptional co-activators like MED1/19, GCN4 and BRD4 and the
unstructured C-terminal domain (CTD) of Pol II can drive the formation of so-called
transcriptional condensates at enhancers and promoters (Hnisz et al., 2017; Sabari et al.,
2020; Shrinivas et al., 2019). One mechanism frequently invoked for this process is liquid-
liquid phase separation (LLPS). Above a critical concentration, multivalent interactions of
proteins and RNAs that frequently involve IDRs drive the formation of phase separated liquid-
like droplets that sequester their constituting components from the surrounding nucleoplasm
(Banani et al., 2017; Choi et al., 2020; Shin and Brangwynne, 2017; Uversky, 2021). The
assembly of TFs into liquid-like protein droplets at their target sites could enhance transcription
(Schneider et al., 2021; Wei et al., 2020) by (i) increasing the local TF concentration at the
promoter, (ii) mediating the recruitment of co-activators and/or additional Pol II complexes (27),
and (iii) making the TF target search process more efficient (Brodsky et al., 2020; Kent et al.,
2020). However, the assembly of transcriptionally active or silenced compartments at
chromatin could be also governed by alternative mechanisms including classical (cooperative)
chromatin binding, formation of well-defined multi-subunit protein complexes and bridging
interactions between distant binding sites (Erdel et al., 2020; Erdel and Rippe, 2018; Frank
and Rippe, 2020; McSwiggen et al., 2019a; McSwiggen et al., 2019b; Rippe, 2021). In current
studies a comparison of TFs in the droplet state to the same TFs bound to chromatin but
without droplet formation is missing, which is crucial to demonstrate a functional role of
transcriptional condensates for gene activation.

Here, we have studied a panel of constitutive and light-inducible synthetic TF constructs with
dead-Cas9 (dCas9), reverse tet repressor (rTetR) and lac repressor (LacI) as DBDs and
different ADs. We evaluated these synthetic TFs with respect to their activator residence times
and their activation capacity with real-time single-cell fluorescence microscopy readouts and
assessed the contribution of liquid droplet formation. Striking differences in chromatin bound
residence time, RNA production, histone H3 acetylation at lysine 27 (H3K27ac) and BRD4
recruitment between different TF constructs were observed. Furthermore, we link the phase
separation propensity of the AD to TF DNA binding properties and activation capacity. Based
on our results we conclude that the ability of a TF to engage in multivalent interactions
enhances its activation strength. However, we find no evidence that the formation of liquid
droplets per se would enhance transcription.

 3

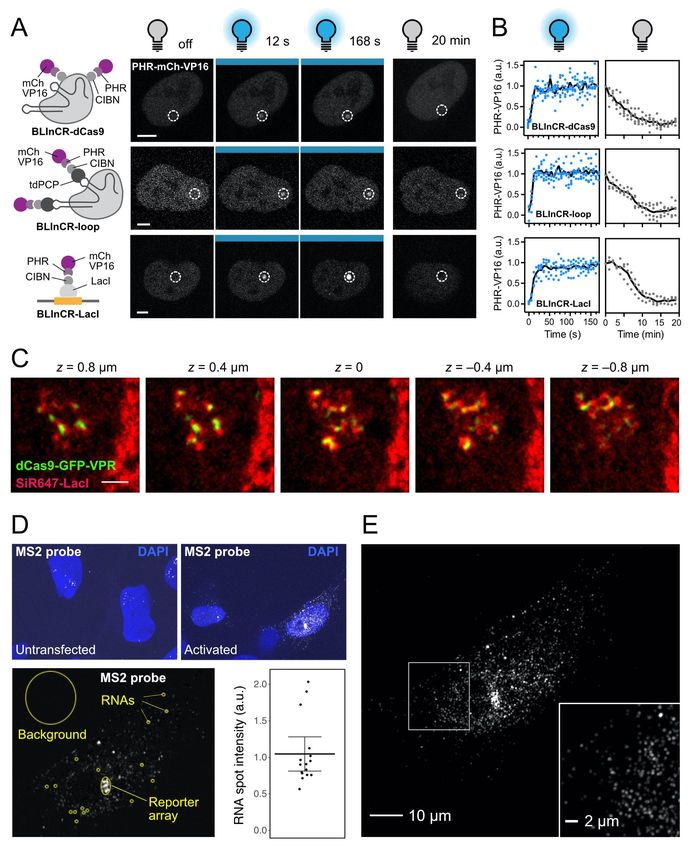
Results

TF properties affecting transcription initiation are dissected with modular constructs
We studied a range of TF architectures by creating a toolbox of single- and multi-component
transcriptional activation complexes (Fig. 1A, left). The three DBDs employed were reverse
tet repressor (rTetR, DNA binding in the presence of doxycycline), lac repressor (LacI) and
dead-Cas9 (dCas9) with single guide RNAs (sgRNA) binding to lacO or tetO operator sites.
The ADs comprised VP16, p65, Rta, STAT2 and VPR and were associated with these DBD
modules via four different approaches: protein fusion constructs (“fusion”), binding of PP7 coat
protein (PCP) AD fusions to PP7 RNA loops (Zalatan et al., 2015) engineered into the sgRNA
(“loop”), light-induced heterodimer formation between PHR-AD and DBD-CIBN fusion proteins
referred to as BLInCR for blue light induced chromatin recruitment (Kennedy et al., 2010;
Rademacher et al., 2017) as well as complexes formed by a PP7-sgRNA, tdPCP-CIBN and
PHR-AD constructs (“BLInCR-loop”). The CIBN-dCas9-CIBN localizer of the BLInCR-dCas9
system has previously also been used in the LACE system (Polstein and Gersbach, 2015).
Our modular toolbox comprised 12 dCas9-based and 14 bacterial repressor-based TF
construct combinations. It allowed us to vary DNA binding, self-interaction and activation
domain properties for studying how these features affect transcription or other readouts
(Fig. 1A, Fig. S1, Table S1, S2). As a model system for transcription activation, we used the
human U2OS 2-6-3 reporter cell line (Janicki et al., 2004), which carries multiple copies of a
reporter gene integrated in tandem at a single locus. Each reporter gene unit contains lacO
and tetO repeats followed by a CMV core promoter and a reporter gene including 24 copies of
the MS2 sequence (Fig. 1A, right). This cell line model enables time-resolved measurements
to follow TF binding and co-factor recruitment in single living cells. In addition, RNA production
can be visualized by binding of fluorescently tagged MS2 coat protein (tdMCP) to the MS2
RNA (Fig. 1A) (Pankert et al., 2017).

All four types of TF constructs were robustly enriched at the reporter array when using dCas9
with the fluorescently tagged VP16 AD and a sgRNA targeting the lacO sites (Fig. 1C, 1D).
Only a few reporter transcripts were present in untransfected cells and their number increased
to thousands of RNA molecules in cells as shown by RNA-FISH for the strong activator VPR
(Fig. S1 D-E). Separated lacO and tetO site clusters were visible in super-resolution radial
fluctuations (SRRF) microscopy (Gustafsson et al., 2016) images at the activated reporter
(Fig. 1B, top; Fig. S1C). The use of light-controllable PHR/CIBN modules in our BLInCR type
TFs with dCas9 or LacI/rTetR as DBDs enabled fast and reversible binding to dissect
transcription initiation at high temporal resolution (Fig. S1A, B) (Rademacher et al., 2017).
Moreover, PHR constructs can self-associate to form so-called optodroplets under appropriate
conditions (Shin et al., 2017) as visualized for PHR-VPR recruited via BLInCR-dCas9 (Fig. 1B

 4

bottom). These optodroplets were detectable as nuclear punctae outside the reporter array.
The granular signal at the reporter indicated that the reporter cluster itself was not immersed
in a single homogenous compartment under these conditions. PHR optodroplet formation can
be exploited to evaluate the phase separation propensity of TF ADs in living cells (Erdel et al.,
2020; Shin et al., 2017). BLInCR-mediated recruitment of different AD fusions to the tetO sites
of the reporter revealed that optodroplets formed to a very different extent (Fig. 1E). Rta, p65
and VPR readily assembled into optodroplets whereas they were rare or absent for VP16 and
STAT2. We quantified optodroplet formation propensity of the constructs depicted in Fig. 1E
by manually determining the fraction of cells with visible optodroplets, which ranged from 1.5 (STAT2) (Table S3). Thus, the propensity to form droplets of the ADs
used in our toolbox covered a broad range, enabling us to link this feature to other readouts of
the reporter system.

Activation strength correlates with phase separation propensity
Phase separation has been used to explain the assembly of TFs into transcriptionally active
compartments and was suggested to play a role in amplifying transcription (Hnisz et al., 2017;
Sabari et al., 2018; Schneider et al., 2021; Shrinivas et al., 2019; Wei et al., 2020). To
challenge this model, we used BLInCR TF constructs to directly correlate the phase separation
propensity of our ADs with their potential to induce transcription of the reporter array by
monitoring nascent RNA production with tdMCP-tdTomato (Fig. 2A). The ectopic AD
assemblies displayed properties indicative of liquid droplets like fusion, higher mobility of
droplets compared to the reporter array (Fig. S2B) and predominantly fast exchange with the
nucleoplasm as determined by fluorescence recovery after photobleaching (FRAP) (Fig. S2C).
To link phase separation propensity to transcriptional activation the ADs were recruited to the
reporter and single cell RNA production trajectories were recorded (Fig. 2A). All ADs were
able to elicit a transcriptional response and the activator strength was positively correlated with
their propensity to form optodroplets (Fig. 2B-D, Table S3, S4): (i) In the first 90 minutes of
transcription activation, p65, Rta and VPR displayed higher maximum transcription levels of
1.7-2.9 a. u. compared to 1.3-1.6 a. u. for VP16 and STAT2 (p < 0.001, two-way ANOVA) (Fig.
2B, S2D). (ii) The fraction of responding cells after 90 minutes was larger with 67-92% (p65,
Rta, VPR) vs. 42-67% (VP16, STAT2) (Fig. 2C). (iii) The time to reach half-maximal activation

 5
was shorter with 26-28 min (p65, Rta, VPR) compared to 38-42 min (VP16, STAT2) (Table
S4, Fig. S2E) and increased with the critical concentration for droplet formation (Fig. 2D).
Thus, the strong transcriptional activators VPR, p65 and Rta showed a high phase separation
propensity while VP16 and STAT2 were weaker activators with a low tendency to form liquid
droplets.

Phase-separated TF compartments are not required for efficient transcription
The nascent RNA time course data were split into cells with and without visible optodroplets
to elucidate the relation between droplet formation and transcriptional activation. The presence
of PHR-GFP-AD optodroplets in a given cell indicated that the conditions in this cell were
above the critical threshold for phase separation, implying that also the reporter gene cluster
was in a phase-separated environment. The comparison of transcription activation kinetics
between the two groups showed no enhanced activation rate for time courses that displayed
optodroplet formation (Fig. 2E). There was no significant difference in the maximum value of
RNA production for cells with and without droplet formation (p > 0.05 in pairwise t-test and in
two-way ANOVA) (Fig. 2F, Table S4). If droplets were present, the time to half activation was
unchanged for p65 (26 ± 8 min) and even moderately increased for VPR (from 25 ± 6 min to
30 ± 9 min) and Rta (from 25 ± 4 min to 31 ± 5 min) (0.05 ≤ p ≤ 0.10, two-way ANOVA
accounting for AD type and presence/absence of droplets) (Fig. 2G, Fig. S2F). We conclude
that droplet formation does not enhance transcription activation but rather displayed a trend to
a moderate inhibition.

Next, we tested if enhancing the intrinsically low droplet formation propensity of VP16 (Fig. 1E,
S2A) affects transcription activation by applying three different approaches for BLinCR rTetR-
mediated recruitment of VP16 (Fig. 3A): (i) Co-transfection with CIBN-LacI, which can act as
a bridging factor between PHR-AD molecules via interactions between LacI dimers (Lewis et
al., 1996). (ii) Increasing the droplet formation propensity by binding of a second PHR domain
to the AD via a GFP binding protein (GBP) construct fused to PHR, which will generate VP16
complexes with two PHR domains via the high affinity GFP-GBP interaction. (iii) Fusion of
VP16 to the N-terminal IDR of the FUS (fused in sarcoma) protein (FUSN), which has a high
propensity to form liquid droplets in vitro and in vivo (Patel et al., 2015). In the first approach,
the addition of CIBN-LacI enhanced droplet formation and increased the VP16 concentration
around the promoter (Fig. 3B, top row, Fig. S3A, B). This was in line with our observation
that recruiting PHR-GFP-VP16 to CIBN-LacI instead of CIBN-TetR already lowered the critical
concentration for droplet formation (Fig. S2A, Table S3). Surprisingly, nascent RNAs levels at
the reporter were largely reduced by addition of CIBN-LacI (Fig. 3C-E, Fig. S3C-D). The
fraction of responding cells decreased from 70 to 24% and a more than 2-fold reduction of bulk
RNA levels was measured by quantitative real-time PCR (qPCR). Co-transfection of the non-

 6

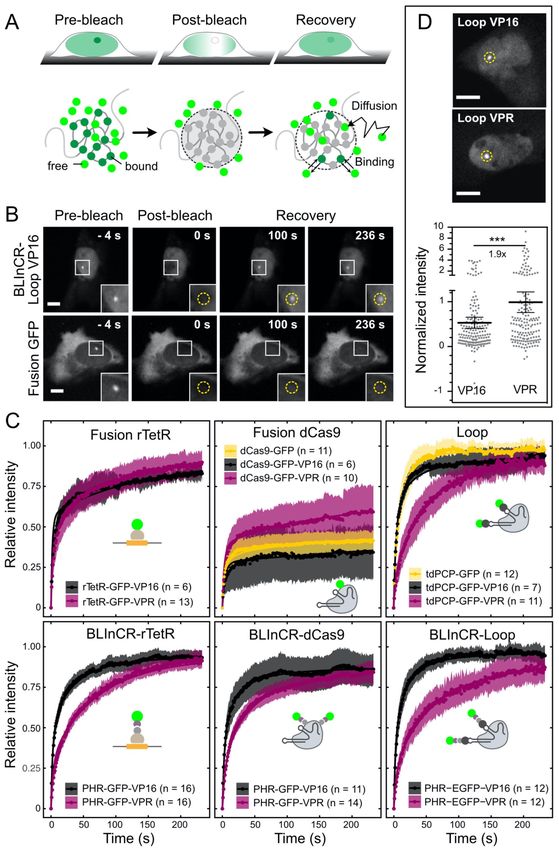
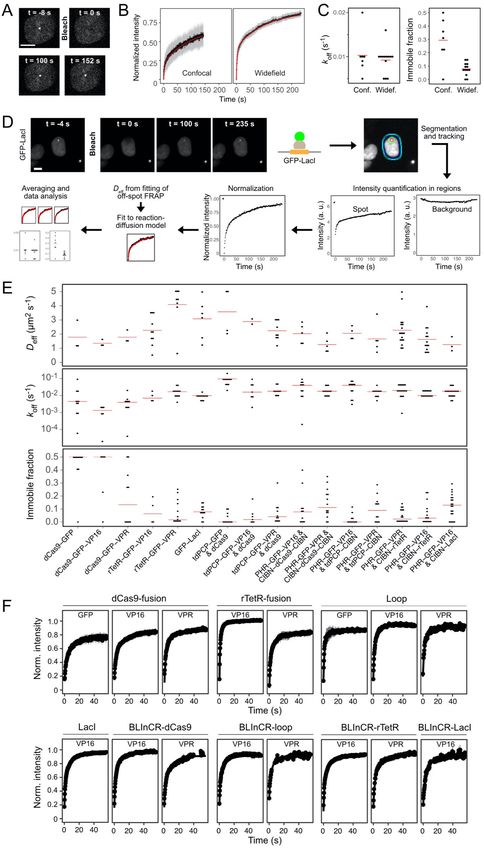
bridging GFP-LacI control instead of CIBN-LacI revealed some repression by GFP-LacI
binding alone, but this effect was much smaller than the repression observed by CIBN-LacI
induced optodroplets. In a second set of experiments, we increased the valency of PHR-GFP-
VP16 by co-transfection with PHR-GBP that binds to it. This approach was highly effective in
inducing VP16 droplet formation (Fig. 3F, Fig. S3E). However, transcription was almost
complete repressed as apparent from the maximum nascent RNA level and the fraction of
responding cells (Fig. 3G-H, Fig. S3F). Measurements of bulk reporter RNA levels by qPCR
confirmed this conclusion (Fig. 3I). The third approach induced VP16 droplets by fusion to
FUSN (Fig. S3A, E). This PHR-GFP-FUSN-VP16 construct displayed a largely increased
activation strength, which was similar to that of VPR in the measurements of transcription
kinetics (Fig. 3G-H, Fig. S3F). In addition, bulk RNA levels were 10-fold higher than those
measured for VP16 without FUSN (Fig. 3I). FUSN alone failed to activate the reporter. Next,
we split up the FUSN-VP16 nascent RNA time course data into cells with and without visible
droplets. Notably, we found that activation capacity of FUSN-VP16 was indistinguishable
between the two groups (Fig. S3H). This is in agreement with the results showing that actual
droplet formation had no effect on the activation capacity of VPR, p65 and Rta (Fig. 2E). We
conclude that multivalent interactions increase activation capacity but that the additional
formation of droplets has no effect on transcriptional activation. Moreover, certain types of
droplets like those containing bivalent bridging factors can efficiently inhibit transcription
activation even though they increase the local TF concentration at the promoter.

TF residence times are determined by both the DBD and the AD
Our experiments with the BLInCR TFs suggest that multivalent interactions of ADs outside the
phase separation concentration regime are crucial for efficient transcription activation. One
possible mechanism could be to stabilize chromatin binding and to increase TF residence time.
Accordingly, we conducted a FRAP analysis of different TF constructs containing either an AD
with high (VPR) or low (VP16) multivalent interaction potential (Fig. 4A-C, S4A-D). The
recovery curves obtained by bleaching the TFs bound at the reporter gene array were fitted by
a reaction-diffusion model for clustered binding sites as described in the Supplementary
Methods (Sprague et al., 2006). This analysis yielded the apparent diffusion coefficient, the
dissociation rate koff and the immobile fraction of stably bound molecules during the
observation period of 240 s (Fig. S4E, Table S5). The computed residence times in the
chromatin bound state ranged from tres = 12 ± 6 s for tdPCP-GFP binding to PP7-loops of the
dCas9-sgRNA to a large immobile fraction with tres >240 s for the dCas9-GFP-VP16 fusion
construct (Table S5, Fig. 4C). Interestingly, the residence times for VPR as compared to VP16
were consistently >14 s higher and the immobile fraction was increased by 2-7% in the highly
dynamic loop and BLInCR complexes (Fig. 4C). This observation points to VPR self-

 7

interactions that stabilize the binding of the tdPCP-GFP-VPR and PHR-GFP-VPR constructs.
For the already very stably chromatin bound dCas9 fusion constructs the VPR-VPR
interactions manifested themselves as an additional faster exchanging contribution to the
recovery that is clearly visible for dCas9-GFP-VPR but absent in dCas9-GFP-VP16 (Fig. 4C,
Table S5). To confirm this additional indirect protein binding at the array, we measured the
intensity of VPR and VP16 assemblies recruited via the loop configuration at the reporter array
(Fig. 4D). We found a 1.9-fold higher signal for tdPCP-GFP-VPR as compared to tdPCP-GFP-
VP16 (p = 0.0006, Welch two-sample t-test), confirming the additional recruitment seen in
FRAP (Fig. 4C, upper row third panel). We conclude that the TF residence time was not only
dependent on the DBD but significantly influenced by the AD properties. VPR promoted the
binding of additional TF molecules to those that were directly bound to DNA and stabilized the
directly bound proteins in the case of weaker interactions. This enrichment of TFs via protein-
protein interactions correlated with the AD's propensity to engage in multivalent interactions.

Transcription activation can occur independent of BRD4 and H3K27ac
TFs initiate transcription via different mechanisms that include the assembly of the transcription
machinery, catalyzing its transition into an active state as well as chromatin state changes that
promote transcription (Lee and Young, 2000). In order to unravel how these mechanistic
aspects are linked to the multivalent interaction and/or the residence time of a TF, we
established an end-point assay to correlate activity of TF constructs studied with marks of
active transcription (Fig. 5). We first measured the activity of the TF constructs by qPCR of
bulk reporter RNA levels 24 hours after induction (Fig. 5A, Table S6). In these experiments,
the BLInCR-dCas9 and BLInCR-loop constructs failed to activate the core CMV promoter of
the gene array. Transcriptional activation by a construct similar to BLInCR-dCas9 has been
reported previously for the endogenous human IL1RN or HBG1/2 promoters and to a lesser
extent for ASCL1 (Polstein and Gersbach, 2015). This apparent discrepancy was further
studied as described in the Supplemental Information (Fig. S5A-C) and is likely to reflect
differences of the promoters studied. All other TF constructs were able to activate transcription.
VPR was a stronger activator than VP16 in most cases, as shown also by the steady-state
nascent RNA profiles determined from the tdMCP signal after 24 hours (Fig. 5D). Additionally,
BRD4 and H3K27ac were measured by fluorescence microscopy (Fig. 5B-C) to yield their
normalized radial profiles across the gene array (Fig. 5D). This analysis revealed that VPR
displayed much stronger BRD4 and H3K27ac enrichment than VP16 except for the loop
construct. As an internal control, we also recruited the histone acetyltransferase p300 core
domain fused to dCas9. The binding in p300 led to H3K27ac and BRD4 accumulation but not
to RNA production. Notably, the transcriptionally inactive BLInCR-dCas9 and BLInCR-loop
complexes were capable to induce enrichment of both BRD4 and H3K27ac (Fig. 5D,

 8

Supplemental Information). We conclude that transcription activation can occur in parallel to
co-activator recruitment and histone acetylation and distinguish three different TF types:
(i) Strong activators like dCas9-VPR and rTetR-VPR fusions that induce both transcription and
strong enrichment of BRD4 and H3K27ac. (ii) Activators represented by the rTetR-VP16 fusion
that displayed moderate but robust activation at very low levels of BRD4 and H3K27ac. (iii) The
dCas9-based BLInCR constructs that efficiently recruited BRD4 and induced H3K27
acetylation but failed to activate transcription.

VPR recruits BRD4 directly and is less dependent on pre-existing histone acetylation
We observed that both activating and non-activating VPR BLInCR complexes sometimes
enriched over-expressed mCherry-BRD4 in ectopic optodroplets while this was hardly
observed for VP16 (Fig. 5E, F). Thus, we hypothesized that transient multivalent interactions
between VPR and BRD4 could contribute to the faster (Fig. 2B) and often stronger (Fig. 5A)
transcription activation by VPR compared to VP16. To test this possibility, we used the
transcription-incompetent BLInCR-loop complex to monitor transcription-independent BRD4
binding after light-induced recruitment of VP16 or VPR (Fig. 5G). BRD4 accumulation was
strong and fast for VPR with an initial steep rise of the BRD4 levels over the first 10 minutes
followed by a phase of slower BRD4 accumulation (Fig. 5H-I). VP16 did not display such
biphasic kinetics. Next, we conducted the same experiment after treating the cells with the
inhibitor JQ1 that disrupts BRD4 interactions with acetylated histones to evaluate the
contribution of BRD4 binding that is independent of acetylation. JQ1 pre-treatment completely
abrogated BRD4 accumulation for VP16. For VPR, the initial steep rise remained unaffected,
but BRD4 binding was reduced in the second phase (Fig. 5I, right). This observation suggests
a direct VPR-BRD4 interaction that is followed by subsequent binding of BRD4 to acetylated
histones via its bromodomain.

Next, we examined the active BLInCR-rTetR complex to study the role of BRD4 for
transcription. With this complex, JQ1 treatment did not reduce nascent RNA production
induced by VP16 or VPR (Fig. S5D, Table S7). Bulk RNA levels were moderately reduced in
the qPCR assay for VPR (1.8-fold reduction) but mostly unaffected for VP16 (1.1-fold
reduction) (Fig. S5E, Table S6). We conclude that BRD4 accumulation accompanies
transcriptional activation but is not essential for reporter gene induction. It may, however,
enhance transcription activation by VPR or stabilize the activated state. Next, we assessed
the contribution of histone acetylation to the activation capacity of both VP16 and VPR. The
dCas9-p300core construct was constitutively recruited to the distal lacO sites. It establishes a
locally hyper-acetylated state without inducing transcription (Fig. 5D). Subsequently, light-
induced transcription by VP16 and VPR BLInCR-rTetR was compared (Fig. 5J). VP16
displayed an enhanced transcriptional response quantified by qPCR in the presence of p300

 9

at the lacO repeats compared to the case without p300 whereas VPR did not (Fig. 5K, Table
S6). When observing nascent RNA at the gene array by microscopy, a more pronounced
increase of the plateau level was observed for VP16 (3.1-fold) than for VPR (2.1-fold) while
activation kinetics were similar (Fig. S5G, Table S7). We conclude that pre-existing histone
acetylation can increase the transcription induction and does so to a higher extent for VP16.
Accordingly, the lower transcription induction of VP16 could be related in part to its inability to
directly interact with histone acetylases like p300 as well as the BRD4 co-activator.

Shortened residence times reduces activation capacity
The preceding comparison of different TF complexes revealed links between phase separation
propensity, TF turnover and transcriptional activation capacity. The impact of TF turnover on
transcription was clearly dominated by the specific TF complex architecture (e.g., loop vs direct
dCas9 fusion). To directly dissect how binding affinity and residence time affect transcriptional
output, we artificially increased the turnover of DNA-bound dCas9 complexes at the promoter
by introducing a C2G mutation into the sgRNA targeting the tetO sequence to yield the sgRNA-
mut (Fig. 6A, Fig. S6A, Table S2). The FRAP analysis showed that the residence time of the
dCas9 VPR fusion construct for sgRNA-mut versus sgRNA-wt was strongly decreased from
tres = 124 s (95% CI: 75-347 s) to tres = 57 s (95% CI: 34-184 s) (Fig. 6B, Table S5). In
addition, the immobile fraction was lowered from 36% to 7% (95% CIs: 25-47% and 0-16%).
Next, we compared transcription activation with sgRNA-mut versus sgRNA-wt. For sgRNA-
mut complexes, occupancy was reduced to 14% (VP16) and 37% (VPR) of the respective
sgRNA-wt value (Fig. 6C, 6D). The fraction of cells with visible dCas9 recruitment decreased
from 90% to 76% (VPR) and from 59% to 17% (VP16) (Fig. S6B, Table S8) and bulk reporter
RNA levels were strongly reduced for both VP16 and VPR (Fig. 6E). For sgRNA-wt, a
continuous increase of occupancy with activator expression was observed, which is likely to
reflect an increase of indirectly recruited molecules via multivalent interactions. As expected,
RNA production increased with occupancy. In order to separate the effect of occupancy and
residence time, we binned cells into groups with equal occupancy and compared their nascent
RNA production. The average RNA production induced by VPR was consistently lower for the
shorter residence times of sgRNA-mut vs. the longer residence times of sgRNA-wt within each
TF occupancy group (Fig. 6F) (VPR: 2 - 6-fold, VP16: 1.3 - 2-fold; VPR: p < 0.001, VP16: p >
0.05, two-way ANOVA of occupancy group and sgRNA). We also measured the radial BRD4
and H3K27ac enrichment profiles and observed a robust enrichment even with reduced VPR
residence times (Fig. 6G). This corroborates our previous findings that BRD4 recruitment and
histone acetylation occur efficiently even at high AD turnover rate. The residence time
dependency of activation shown in Fig. 6F suggests that the TF is involved in an energy-
dependent activation step. It is illustrated in a kinetic model how the residence time of the TF

 10
in the bound state can become a key determinant of transcription output independent of
binding site occupancy (Fig. 6H, Supplemental Information). Furthermore, the higher
sensitivity of VP16 mediated activation to a reduction of its binding affinity and residence time
suggests that the higher multivalency of VPR can at least partly compensate for a reduction of
direct DNA binding affinity.

Discussion
We combined different DBD and AD modules into a panel of synthetic TFs to dissect
contributions of DNA binding properties, multivalent AD interactions, phase separation, co-
activator recruitment and histone acetylation to transcription activation. The main results are
summarized in the scheme depicted in Fig. 7. We show that TF activation strength is reduced
with shorter residence time independent of TF binding site occupancy (Fig. 6F). This finding
corroborates conclusions from previous studies (Brouwer and Lenstra, 2019; Callegari et al.,
2019; Clauss et al., 2017; Gurdon et al., 2020; Loffreda et al., 2017; Shelansky and Boeger,
2020). It suggests that TF binding is coupled to an energy dependent kinetic proofreading step
like nucleosome remodeling (Shelansky and Boeger, 2020), promoter DNA melting (Osman
and Cramer, 2020) or TF post-translational modification (Qian et al., 2020). The activation
strength of the five ADs studied here correlated with their capacity to engage in multivalent
interactions as assessed by their propensity to form optodroplets (Fig. 2A-D). The comparison
of two prototypic ADs with high (VPR) versus low (VP16) multivalency provided insight into the
underlying molecular differences. The analysis of TF chromatin binding by FRAP and the
experiments that employed a mutated sgRNA revealed that multivalent interactions stabilized
chromatin binding and led to the accumulation of additional TF molecules via protein-protein
interactions at the promoter (Fig. 4C, D). Furthermore, recruitment of co-activators like BRD4
and setting the H3K27ac modification was clearly enhanced by VPR as compared to VP16
(Fig. 5D-I). Thus, we conclude that multivalent TF interactions foster interaction both with the
TF itself but also with co-factors such as BRD4 or p300, thereby boosting transcription or
increasing persistence of the activated state. This is in line with previous reports on the ability
of BRD4 to engage in dynamic multivalent interactions (Cho et al., 2018; Han et al., 2020; Ma
et al., 2021; Sabari et al., 2018). It is noted that BRD4 was neither required nor sufficient to
induce transcription in our experiments (Fig. 5D, S5D-E). Furthermore, transcription was not
a prerequisite for BRD4 binding or H3K27 acetylation (Fig. 5D). Interestingly, BRD4
enrichment around the promoter could also be maintained upon weakened DNA binding in the
sgRNA mutation experiment (Fig. 6 G). We conclude that maximum transcription activation
strength requires the stable binding of the AD at the promoter with long residence times for
interactions with the core transcriptional machinery, while co-activators can also be recruited

 11
to the promoter by TFs at high turnover rate.

Recent studies investigated the functional consequences of TF phase separation and reported
that droplets formed by light induction of PHR/CRY2-TAF15 (Wei et al., 2020) or IDR-VP16
constructs (Schneider et al., 2021) amplify gene expression or increase transcription
activation. Furthermore, it has been proposed that phase separated transcriptional
condensates that include super-enhancers drive transcription of highly active genes (Hnisz et
al., 2017; Sabari et al., 2018; Shrinivas et al., 2019). Our results confirm an enhancement of
transcription when fusing the N-terminal IDR of FUS to the activation domain VP16 in our light-
inducible TF setup (Fig. 3G-I). FUSN-VP16 also behaved differently from the VP16 droplet
state enforced by bridging factors, suggesting that the intrinsically disordered FUSN domain
provides interactions that favor efficient transcription initiation. Previous studies attributed this
effect to the local TF enrichment by LLPS from the comparison to control constructs without
IDRs and/or in the absence of a light trigger. However, experiments that assess transcription
activity of the same chromatin bound activator in the presence/absence of droplet formation
under identical conditions were lacking. Here, we demonstrate that it is not justified to generally
assume that liquid TF droplets at the promoter would enhance transcription as we see a neutral
effect when comparing activation both below and above the critical droplet forming
concentration for the same activator (Fig. 2E-G). Based on these findings, we argue that
assemblies formed by weak multivalent interactions as established by the VPR or FUSN
domain are sufficient to enhance transcription without phase separation. Instead, we propose
that phase separation of TFs at artificially high protein concentration simply reflects a physico-
chemical property of IDRs in line with previous finding (Chong et al., 2018). As shown here,
stabilization of TF binding at the promoter and TF dependent co-factor recruitment are two
possible mechanisms by which multivalent interactions could enhance transcription in the
absence of phase separation. In the experiments that induced TF droplets via the addition of
bridging factor we observed an inhibitory effect on transcription (Fig. 3). Interestingly, a
conceptionally related mechanism of transcription suppression has been observed for the
sequestering of RNA polymerase I into a phase-separated nucleolar cap subcompartment (Ide
et al., 2020). Whether inhibitory phase-separated states are involved in regulating Pol II activity
in an endogenous cellular environment, for example to establish refractory promoter states
(Rodriguez and Larson, 2020), remains to be demonstrated.

In summary, our study reveals how DBD and AD activities are linked and jointly affect TF
binding and activation properties. It provides novel insight into how transitions between active
and inactive promoter states can be regulated. Furthermore, we anticipate that our findings
are helpful for the design of CRISPR/dCas9-based synthetic TFs for control of gene expression
programs (Pandelakis et al., 2020), and will stimulate further experiments that dissect how
phase-separation processes affect Pol II transcription.

 12
Author contributions
Study design: JT, LF, KR. Acquisition of data: JT, LF, AR, PG. Analysis of data: all authors;
Drafting of manuscript: JT, LF, KR. Manuscript reviewing: all authors. Supervision and
coordination: KR

Acknowledgements
We thank Robin Weinmann and Fabian Erdel for discussion and the DKFZ light microscopy
core facility for technical support. This work was funded by Priority Program 2191 "Molecular
Mechanisms of Functional Phase Separation" of the Deutsche Forschungsgemeinschaft
(DFG) by DFG grant RI1283/16-1 to KR. Data storage at SDS@hd was supported by the
Ministry of Science, Research and the Arts Baden-Württemberg (MWK) and the DFG through
grants INST 35/1314-1 FUGG and INST 35/1503-1 FUGG.

References
Andersson, R., and Sandelin, A. (2020). Determinants of enhancer and promoter activities of
regulatory elements. Nat Rev Genet 21, 71-87.

Banani, S.F., Lee, H.O., Hyman, A.A., and Rosen, M.K. (2017). Biomolecular condensates:
organizers of cellular biochemistry. Nat Rev Mol Cell Biol 18, 285-298.

Bintu, L., Buchler, N.E., Garcia, H.G., Gerland, U., Hwa, T., Kondev, J., and Phillips, R. (2005).
Transcriptional regulation by the numbers: models. Curr Opin Genet Dev 15, 116-124.

Brent, R., and Ptashne, M. (1985). A eukaryotic transcriptional activator bearing the DNA
specificity of a prokaryotic repressor. Cell 43, 729-736.

Brodsky, S., Jana, T., Mittelman, K., Chapal, M., Kumar, D.K., Carmi, M., and Barkai, N.
(2020). Intrinsically Disordered Regions Direct Transcription Factor In Vivo Binding Specificity.
Mol Cell 79, 459-471 e454.

Brouwer, I., and Lenstra, T.L. (2019). Visualizing transcription: key to understanding gene
expression dynamics. Curr Opin Chem Biol 51, 122-129.

Callegari, A., Sieben, C., Benke, A., Suter, D.M., Fierz, B., Mazza, D., and Manley, S. (2019).
Single-molecule dynamics and genome-wide transcriptomics reveal that NF-kB (p65)-DNA
binding times can be decoupled from transcriptional activation. PLoS Genet 15, e1007891.

Chavez, A., Scheiman, J., Vora, S., Pruitt, B.W., Tuttle, M., E, P.R.I., Lin, S., Kiani, S., Guzman,
C.D., Wiegand, D.J., et al. (2015). Highly efficient Cas9-mediated transcriptional programming.
Nat Methods 12, 326-328.

Cho, W.K., Spille, J.H., Hecht, M., Lee, C., Li, C., Grube, V., and Cisse, II (2018). Mediator
and RNA polymerase II clusters associate in transcription-dependent condensates. Science
361, 412-415.

 13
Choi, J.M., Holehouse, A.S., and Pappu, R.V. (2020). Physical Principles Underlying the
Complex Biology of Intracellular Phase Transitions. Annu Rev Biophys 49, 107-133.

Chong, S., Dugast-Darzacq, C., Liu, Z., Dong, P., Dailey, G.M., Cattoglio, C., Heckert, A.,
Banala, S., Lavis, L., Darzacq, X., et al. (2018). Imaging dynamic and selective low-complexity
domain interactions that control gene transcription. Science 361, eaar2555-2517.

Clauss, K., Popp, A.P., Schulze, L., Hettich, J., Reisser, M., Escoter Torres, L., Uhlenhaut,
N.H., and Gebhardt, J.C.M. (2017). DNA residence time is a regulatory factor of transcription
repression. Nucleic Acids Res 45, 11121-11130.

Erdel, F., Rademacher, A., Vlijm, R., Tunnermann, J., Frank, L., Weinmann, R., Schweigert,
E., Yserentant, K., Hummert, J., Bauer, C., et al. (2020). Mouse Heterochromatin Adopts
Digital Compaction States without Showing Hallmarks of HP1-Driven Liquid-Liquid Phase
Separation. Mol Cell 78, 236-249 e237.

Erdel, F., and Rippe, K. (2018). Formation of chromatin subcompartments by phase
separation. Biophys J 114, 2262-2270.

Frahm, T., Hauser, H., and Koster, M. (2006). IFN-type-I-mediated signaling is regulated by
modulation of STAT2 nuclear export. J Cell Sci 119, 1092-1104.

Frank, L., and Rippe, K. (2020). Repetitive RNAs as Regulators of Chromatin-Associated
Subcompartment Formation by Phase Separation. J Mol Biol 432, 4270-4286.

Frankel, A.D., and Kim, P.S. (1991). Modular structure of transcription factors: implications for
gene regulation. Cell 65, 717-719.

Gunther, K., Rust, M., Leers, J., Boettger, T., Scharfe, M., Jarek, M., Bartkuhn, M., and
Renkawitz, R. (2013). Differential roles for MBD2 and MBD3 at methylated CpG islands, active
promoters and binding to exon sequences. Nucleic Acids Res 41, 3010-3021.

Gurdon, J.B., Javed, K., Vodnala, M., and Garrett, N. (2020). Long-term association of a
transcription factor with its chromatin binding site can stabilize gene expression and cell fate
commitment. Proc Natl Acad Sci U S A 117, 15075-15084.

Gustafsson, N., Culley, S., Ashdown, G., Owen, D.M., Pereira, P.M., and Henriques, R. (2016).
Fast live-cell conventional fluorophore nanoscopy with ImageJ through super-resolution radial
fluctuations. Nat Commun 7, 12471.

Haberle, V., and Stark, A. (2018). Eukaryotic core promoters and the functional basis of
transcription initiation. Nat Rev Mol Cell Biol 19, 621-637.

Han, X., Yu, D., Gu, R., Jia, Y., Wang, Q., Jaganathan, A., Yang, X., Yu, M., Babault, N., Zhao,
C., et al. (2020). Roles of the BRD4 short isoform in phase separation and active gene
transcription. Nat Struct Mol Biol 27, 333-341.

Hnisz, D., Shrinivas, K., Young, R.A., Chakraborty, A.K., and Sharp, P.A. (2017). A Phase
Separation Model for Transcriptional Control. Cell 169, 13-23.

Ide, S., Imai, R., Ochi, H., and Maeshima, K. (2020). Transcriptional suppression of ribosomal
DNA with phase separation. Sci Adv 6, eabb5953.

Janicki, S.M., Tsukamoto, T., Salghetti, S.E., Tansey, W.P., Sachidanandam, R., Prasanth,

 14
K.V., Ried, T., Shav-Tal, Y., Bertrand, E., Singer, R.H., et al. (2004). From silencing to gene
expression: real-time analysis in single cells. Cell 116, 683-698.

Kennedy, M.J., Hughes, R.M., Peteya, L.A., Schwartz, J.W., Ehlers, M.D., and Tucker, C.L.
(2010). Rapid blue-light-mediated induction of protein interactions in living cells. Nat Methods
7, 973-975.

Kent, S., Brown, K., Yang, C.H., Alsaihati, N., Tian, C., Wang, H., and Ren, X. (2020). Phase-
Separated Transcriptional Condensates Accelerate Target-Search Process Revealed by Live-
Cell Single-Molecule Imaging. Cell Rep 33, 108248.

Lau, I.F., Filipe, S.R., Soballe, B., Okstad, O.A., Barre, F.X., and Sherratt, D.J. (2003). Spatial
and temporal organization of replicating Escherichia coli chromosomes. Mol Microbiol 49, 731-
743.

Lee, T.I., and Young, R.A. (2000). Transcription of eukaryotic protein-coding genes. Annu Rev
Genet 34, 77-137.

Lewis, M., Chang, G., Horton, N.C., Kercher, M.A., Pace, H.C., Schumacher, M.A., Brennan,
R.G., and Lu, P. (1996). Crystal structure of the lactose operon repressor and its complexes
with DNA and inducer. Science 271, 1247-1254.

Loffreda, A., Jacchetti, E., Antunes, S., Rainone, P., Daniele, T., Morisaki, T., Bianchi, M.E.,
Tacchetti, C., and Mazza, D. (2017). Live-cell p53 single-molecule binding is modulated by C-
terminal acetylation and correlates with transcriptional activity. Nat Commun 8, 313.

Ma, L., Gao, Z., Wu, J., Zhong, B., Xie, Y., Huang, W., and Lin, Y. (2021). Co-condensation
between transcription factor and coactivator p300 modulates transcriptional bursting kinetics.
Mol Cell 81, 1682-1697 e1687.

McSwiggen, D.T., Hansen, A.S., Teves, S.S., Marie-Nelly, H., Hao, Y., Heckert, A.B.,
Umemoto, K.K., Dugast-Darzacq, C., Tjian, R., and Darzacq, X. (2019a). Evidence for DNA-
mediated nuclear compartmentalization distinct from phase separation. Elife 8, e47098.

McSwiggen, D.T., Mir, M., Darzacq, X., and Tjian, R. (2019b). Evaluating phase separation in
live cells: diagnosis, caveats, and functional consequences. Genes Dev 33, 1619-1634.

Muller-Ott, K., Erdel, F., Matveeva, A., Mallm, J.P., Rademacher, A., Hahn, M., Bauer, C.,
Zhang, Q., Kaltofen, S., Schotta, G., et al. (2014). Specificity, propagation, and memory of
pericentric heterochromatin. Mol Syst Biol 10, 746.

Osman, S., and Cramer, P. (2020). Structural Biology of RNA Polymerase II Transcription: 20
Years On. Annu Rev Cell Dev Biol 36, 1-34.

Pandelakis, M., Delgado, E., and Ebrahimkhani, M.R. (2020). CRISPR-Based Synthetic
Transcription Factors In Vivo: The Future of Therapeutic Cellular Programming. Cell Syst 10,
1-14.

Pankert, T., Jegou, T., Caudron-Herger, M., and Rippe, K. (2017). Tethering RNA to chromatin
for fluorescence microscopy based analysis of nuclear organization. Methods 123, 89-101.

Patel, A., Lee, H.O., Jawerth, L., Maharana, S., Jahnel, M., Hein, M.Y., Stoynov, S., Mahamid,
J., Saha, S., Franzmann, T.M., et al. (2015). A Liquid-to-Solid Phase Transition of the ALS
Protein FUS Accelerated by Disease Mutation. Cell 162, 1066-1077.

 15
Polstein, L.R., and Gersbach, C.A. (2015). A light-inducible CRISPR-Cas9 system for control
of endogenous gene activation. Nat Chem Biol 11, 198-200.

Qian, M., Yan, F., Yuan, T., Yang, B., He, Q., and Zhu, H. (2020). Targeting post-translational
modification of transcription factors as cancer therapy. Drug Discov Today 25, 1502-1512.

Rademacher, A., Erdel, F., Trojanowski, J., Schumacher, S., and Rippe, K. (2017). Real-time
observation of light-controlled transcription in living cells. J Cell Sci 130, 4213-4224.

Rippe, K. (2021). Liquid-liquid phase separation in chromatin. Cold Spring Harb Perspect Biol,
in press, doi: 10.1101/cshperspect.a040683.

Rodriguez, J., and Larson, D.R. (2020). Transcription in Living Cells: Molecular Mechanisms
of Bursting. Annu Rev Biochem 89, 189-212.

Rothbauer, U., Zolghadr, K., Muyldermans, S., Schepers, A., Cardoso, M.C., and Leonhardt,
H. (2008). A versatile nanotrap for biochemical and functional studies with fluorescent fusion
proteins. Mol Cell Proteomics 7, 282-289.

Sabari, B.R., Dall'Agnese, A., Boija, A., Klein, I.A., Coffey, E.L., Shrinivas, K., Abraham, B.J.,
Hannett, N.M., Zamudio, A.V., Manteiga, J.C., et al. (2018). Coactivator condensation at super-
enhancers links phase separation and gene control. Science 361, eaar3958-3917.

Sabari, B.R., Dall'Agnese, A., and Young, R.A. (2020). Biomolecular Condensates in the
Nucleus. Trends Biochem Sci 45, 961-977.

Sadowski, I., Ma, J., Triezenberg, S., and Ptashne, M. (1988). GAL4-VP16 is an unusually
potent transcriptional activator. Nature 335, 563-564.

Schindelin, J., Arganda-Carreras, I., Frise, E., Kaynig, V., Longair, M., Pietzsch, T., Preibisch,
S., Rueden, C., Saalfeld, S., Schmid, B., et al. (2012). Fiji: an open-source platform for
biological-image analysis. Nat Methods 9, 676-682.

Schneider, N., Wieland, F.G., Kong, D., Fischer, A.A.M., Horner, M., Timmer, J., Ye, H., and
Weber, W. (2021). Liquid-liquid phase separation of light-inducible transcription factors
increases transcription activation in mammalian cells and mice. Sci Adv 7, eabd3568.

Shelansky, R., and Boeger, H. (2020). Nucleosomal proofreading of activator-promoter
interactions. Proc Natl Acad Sci U S A 117, 2456-2461.

Shin, Y., Berry, J., Pannucci, N., Haataja, M.P., Toettcher, J.E., and Brangwynne, C.P. (2017).
Spatiotemporal Control of Intracellular Phase Transitions Using Light-Activated optoDroplets.
Cell 168, 159-171 e114.

Shin, Y., and Brangwynne, C.P. (2017). Liquid phase condensation in cell physiology and
disease. Science 357, eaaf4382.

Shrinivas, K., Sabari, B.R., Coffey, E.L., Klein, I.A., Boija, A., Zamudio, A.V., Schuijers, J.,
Hannett, N.M., Sharp, P.A., Young, R.A., et al. (2019). Enhancer Features that Drive Formation
of Transcriptional Condensates. Mol Cell 75, 549-561 e547.

Sprague, B.L., Muller, F., Pego, R.L., Bungay, P.M., Stavreva, D.A., and McNally, J.G. (2006).
Analysis of binding at a single spatially localized cluster of binding sites by fluorescence
recovery after photobleaching. Biophys J 91, 1169-1191.

 16
Staller, M.V., Holehouse, A.S., Swain-Lenz, D., Das, R.K., Pappu, R.V., and Cohen, B.A.
(2018). A High-Throughput Mutational Scan of an Intrinsically Disordered Acidic
Transcriptional Activation Domain. Cell Syst 6, 444-455 e446.

Trojanowski, J., Rademacher, A., Erdel, F., and Rippe, K. (2019). Light-induced transcription
activation for time-lapse microscopy experiments in living cells. In Imaging Gene Expression:
Methods and Protocols, Methods in Molecular Biology, vol 2028, Y. Shav-Tal, ed. (New York:
Springer Nature), pp. 251-270.

Uversky, V.N. (2021). Recent Developments in the Field of Intrinsically Disordered Proteins:
Intrinsic Disorder-Based Emergence in Cellular Biology in Light of the Physiological and
Pathological Liquid-Liquid Phase Transitions. Annu Rev Biophys 50, 135-156.

Wei, M.T., Chang, Y.C., Shimobayashi, S.F., Shin, Y., Strom, A.R., and Brangwynne, C.P.
(2020). Nucleated transcriptional condensates amplify gene expression. Nat Cell Biol 22,
1187-1196.

Zalatan, J.G., Lee, M.E., Almeida, R., Gilbert, L.A., Whitehead, E.H., La Russa, M., Tsai, J.C.,
Weissman, J.S., Dueber, J.E., Qi, L.S., et al. (2015). Engineering complex synthetic
transcriptional programs with CRISPR RNA scaffolds. Cell 160, 339-350.

Materials and Methods

Plasmids
Plasmids and sgRNA sequences are listed in Supplemental Table S1 and S2. Protein
constructs were expressed under control of a CMV promoter using pEGFP-C1/N1 (Clontech)
(enhanced GFP, referred to here as GFP) or pcDNA3.1 (Invitrogen) vector backbones.
Plasmids expressing lacO/tetO targeting sgRNAs with 2xPP7 loops were designed as gBlocks
(Integrated DNA Technology) and cloned into a U6 promoter-driven sgRNA expression vector
derived from Addgene plasmid #61424, and with the PP7 loop sequence reported previously
(Zalatan et al., 2015). The dCas9 open reading frame used in all dCas9-based constructs
originates from Addgene plasmid #60910. Activation domains were obtained from Addgene
plasmid #63798 (VPR, p65, Rta) (Chavez et al., 2015), Addgene plasmid #103836 (VP16)
(Gunther et al., 2013) and pSTAT2-EGFP (STAT2, amino acids 1-10 and 722-857) (Frahm et
al., 2006). The p300 core histone acetyltransferase domain was derived from Addgene plasmid
#61357. CRY2PHR and CIBN domains were taken from Addgene plasmid #26866 and
#26867, respectively. The CIBN-dCas9-CIBN expression construct corresponds to Addgene
plasmid #60553. Tandem MCP with tandem Tomato (tdMCP-tdTomato) was derived from
Addgene plasmids #40649 and #54642. The TATA-box of the promoter was removed to
reduce expression levels. The tandem PCP (tdPCP) protein was derived from Addgene
plasmid #40650. LacI and TetR constructs are based on the previously described fluorescently
tagged proteins (Lau et al., 2003)(Pankert et al., 2017). The rTetR protein sequence was

 17
subcloned from the Tet-On transactivator used in the commercially available Tet-On 3G
system (Takara Bio). FUSN was derived from Addgene #122148 and GBP was based on a
previously described construct (Rothbauer et al., 2008).

Cell Culture
U2OS 2-6-3 cells containing the stably integrated lacO/tetO reporter gene cluster (Janicki et
al., 2004) were grown in DMEM (1 g/l glucose, Gibco) without phenol-red supplemented with
10 % tetracycline-free fetal calf serum (FCS), penicillin/streptomycin and 2 mM L-glutamine
using standard cell culture methods at 37 °C and 5 % CO2. Cells were seeded onto 8-well
chambered coverglass slides (Nunc Labtek, Thermo Fisher Scientific) at a density of 2·104
cells per well. For qPCR 3·105 cells were seeded in 6-well plates. One day after seeding, the
medium was replaced with imaging medium (FluoroBrite, Gibco, A1896701; 10 % tet-free
FCS; penicillin/streptomycin; 2 mM L-glutamine) and cells were transfected using the Xtreme-
Gene 9 reagent (Roche) according to the manufacturer's guidelines. Briefly, 200-400 ng
plasmid DNA and 0.6 µl transfection reagent in 20 µl OptiMem (Gibco) were used per well for
microscopy experiments. The plasmid DNA mix consisted of 100 ng of guide RNA plasmid and
100 ng of equal amounts of the remaining constructs. For transfections without guide RNA
plasmid the 200 ng were split equally among the plasmids. Transfection reactions were scaled
up to 2 µg plasmid DNA per well for qPCR experiments. Cells were protected from light until
the start of experiments for FRAP and induction time course experiments with light-responsive
constructs. FRAP experiments were conducted 48 hours post-transfection, all the other
experiments 24 hours post-transfection. For the radial profile microscopy experiments or qPCR
of light-inducible activator constructs, cells were illuminated by diffuse white LED light for 24
hours. rTetR activator constructs were allowed to bind in presence of 5 µg/mL doxycycline
(Sigma-Aldrich, D9891) which was added after transfection.

RNA isolation and qPCR
Total RNA was isolated using QIAzol lysis reagent (Qiagen), followed by one round of
chloroform extraction and isopropanol precipitation. The purified RNA was treated for 30 min
at 37°C with RQ1 DNase (Promega) according to the manufacturer’s protocol and then purified
using one round of each phenol/chloroform and chloroform extraction followed by precipitation
using ethanol in presence of 300 mM sodium acetate pH 5.5 and GlycoBlue coprecipitant
(Thermo Fisher Scientific). RNA concentration and purity were determined by absorbance
measurement. Per sample, one microgram of DNase-treated RNA was used as input for cDNA
synthesis using the Superscript IV reverse transcriptase protocol (Thermo Fisher Scientific).
qPCR was carried out in technical triplicates with 2 µl of 1:40-diluted cDNA per 10 µl reaction
using SYBR Green PCR Mastermix (Applied Biosystems) with a final primer concentration of
500 nM. The following PCR primers (Eurofins Genomics) were used. Human beta-actin fwd:

 18
5’-TCC CTG GAG AAG AGC TAC GA-3’, rev: 5’-AGC ACT GTG TTG GCG TAC AG-3’; VPR-
VP16 fwd: 5’- AAGAAGAGGAAGGTTGCCCC-3’, rev: 5’-CCC CAG GCT GAC ATC GGT-3’;
CFP-SKL fwd: 5’-GTCCGGACTCAGATCTCGA-3’, rev: 5’-TTC AAA GCT TGG ACT GCA GG-
3’. The qPCR analysis was carried out using the 2-∆∆CT method. Reporter RNA expression
levels (CFP-SKL) were normalized to beta-actin mRNA levels (∆CT) and then expressed as
fold-change of the mock control.

Microscopy instrumentation
SRRF images and data for radial profiles and occupancy were acquired with an Andor
Dragonfly 505 spinning disc microscope equipped with the Nikon Ti2-E inverted microscope
and a 40x oil immersion objective (CFI Plan-Fluor 40x Oil 1.30/0.20, Nikon). Multicolor images
were acquired using laser lines at 405 nm (tagBFP), 488 nm (GFP), 561 nm (tdTomato and
mCherry) and 637 nm (Alexa 633) for excitation with a quad-band dichroic unit (405, 488, 561,
640 nm) and corresponding emission filters of 450/50 (tagBFP), 525/50 (GFP), 600/50
(tdTomato, mCherry) and 700/75 nm (Alexa 633) and an iXon Ultra 888 EM-CCD camera. Live
cell experiments were conducted in an incubation chamber (Okolab) at 5 % CO2 and 37 °C
temperature. Light-induced time course and FRAP experiments were carried out with an
AxioObserver Z1 widefield microscope (Zeiss) equipped with a 20x air objective (Zeiss Plan-
Apochromat 20x/0.8 M27), the Zen 2012 pro software including modules for z-stack, time-
lapse and multi-position acquisition and an AxioCam MRm Rev.3 monochrome camera with
filter sets with excitation bandpass, beam splitter, emission bandpass wavelength: GFP,
470/40 nm, 495 nm, 525/50 nm; tdTomato, 535/30 nm, 570 nm, 572/25 nm and mCherry,
550/25 nm, 590 nm, 629/62 nm. For spot bleaching at 473 nm in FRAP experiments the
microscope was extended with an UGA40 70 mW laser scanning system (Rapp
OptoElectronic). A Leica TCS SP5 II confocal microscope (Leica) equipped with a 63x Plan-
Apochromat oil immersion objective was used for additional FRAP experiments as described
previously (Muller-Ott et al., 2014) and for measuring recruitment/dissociation kinetics
(Supplemental Information).

Super-resolution radial fluctuations (SRRF) imaging of reporter locus
Cells were transfected with LacI containing a SNAP-tag and the respective components of the
activation complex directed to the tetO sites. After 24 hours SNAP-Cell 647-SiR substrate
(New England Biolabs) was added to the medium at a concentration of 3 µM, incubated for 30
min and washed three times with medium, incubated with medium for 30 min and washed
three times with PBS. Cells were fixed with 4 % paraformaldehyde for 10 min and washed with
PBS before imaging. Imaging was performed on the Andor Dragonfly spinning disc microscope
with a 100x silicon immersion objective (CFI SR HP Apochromat Lambda S 100x, Nikon) and
a 2x magnification lens to ensure oversampling. 200 frames were acquired per channel for one

 19
super-resolved SRRF image. Exposure time was 2.5 ms with 100 % laser intensity of the 488
nm or 637 nm laser for GFP or 647-SiR, respectively. SRRF analysis was performed using the
SRRF-stream tool implemented in the microscope software with 5 x 5 sub-pixels, a ring radius
of 1.5 pixels for radiality calculations and mean-projection of radiality images.

Light-induced time course experiments
Light-induced time course experiments followed the protocol given in (Trojanowski et al., 2019)
and were conducted with the AxioObserver Z1 widefield microscope. Slides with transfected
cells were kept in the dark until the start of image acquisition and red-light illumination was
used during sample preparation before initiating the reaction with blue light. For JQ1 (Sigma-
Aldrich, SML1524) treatment the drug was diluted in medium and added to the respective wells
to a final concentration of 1 µM three hours before the start of imaging. Doxycycline (Sigma-
Aldrich, D9891) was added 15 minutes before imaging to a final concentration of 5 µg/ml in
the dark to induce binding of CIBN-rTetR. The focal plane was determined by red-filtered
transmitted light and kept constant by the hardware autofocus. Imaging time courses
comprised repeated cycles of imaging of a grid of 16 positions (4x4, 50 % negative overlap)
with three z-slices (distance 1.0 µm) in intervals of 2 minutes over 90 minutes or 60 minutes
for BRD4 recruitment experiments. After each time course experiment the slide was
exchanged with a slide that had been stored in the dark to ensure that between experiments
PHR molecules that had been exposed to stray light from a neighboring well had reverted to
their inactive conformation in the dark.

Analysis of time course images
Image were processed with the EBImage and NSSQ R packages as described previously
(Trojanowski et al., 2019). In a first step positions of nuclei with successful recruitment of PHR-
GFP-AD were manually selected and segmented in the GFP channel by automated local
thresholding for each time point. The nucleus was tracked by mapping the segmented objects
with minimal distance in consecutive frames. The best focal plane was selected from the z-
stack for each time point using the intensity gradient inside the nucleus area. The reporter
gene cluster was segmented inside the nuclear area using a quantile-based threshold in the
PHR-GFP-AD channel. The spot position was tracked through the time course by finding the
closest segmented object in consecutive images. The areas of spot (Aspot) and nucleus masks
(Anucleus) and the average intensities inside the spot (Ispot), nucleus (Inucleus) and ring-shaped
background regions around them (Ispotbg, Inucleusbg) were measured in each channel. The amount
of fluorescence intensity recruited to the reporter spot was then calculated as the product of
background subtracted spot intensity and area:

 %#$'()%* ( ) = ( &+!, − &+!,./ ) ∙ &+!,

 20
You can also read