U.S. EPA's State and Local Climate and Energy Webinar Series - US ...
←
→
Page content transcription
If your browser does not render page correctly, please read the page content below
U.S. EPA’s State and Local Climate and
Energy Webinar Series

     Overview of EPA's Climate Change
                 Indicators
                  June 17, 2021
                    1 PM ET

                Three audio options:
               1. Listen via computer
     2. Receive an automated call from WebEx
     3. Dial 1-415-655-0002 or 1-855-797-9485
           Event number: 161 078 9086

                                                1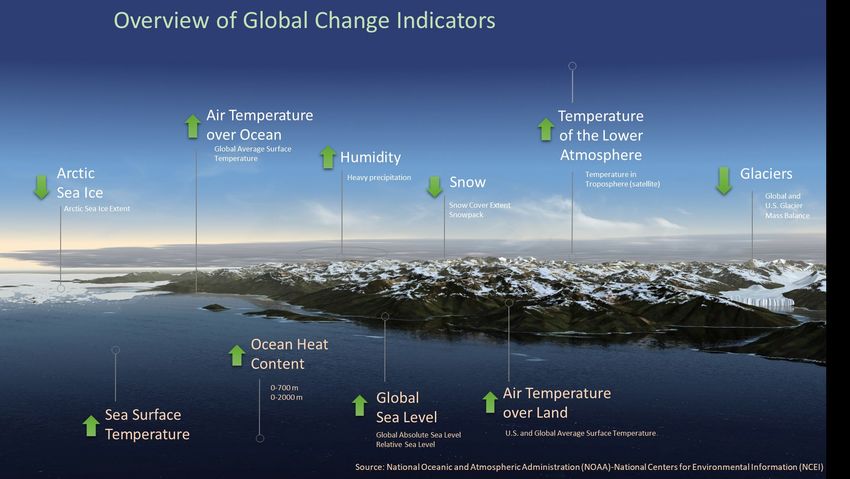
Screen View
There are several layout options
We recommend the side-by-side view
2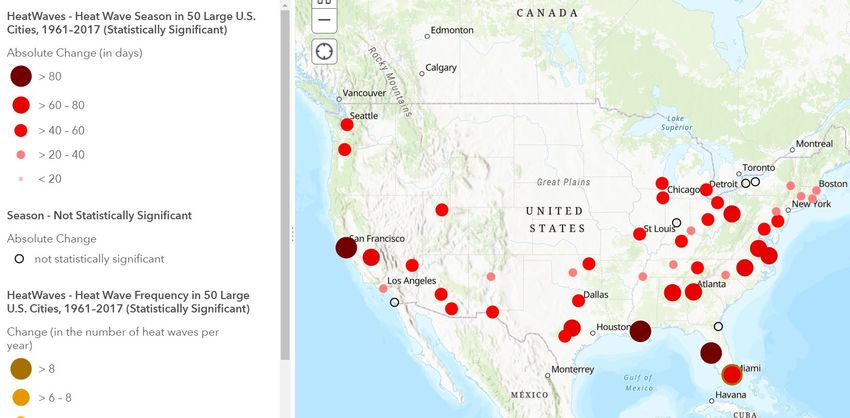
Webinar Panels
We’ll use three panels
Participants, Polling, and
Question & Answer (Q&A)
Use the arrow to expand or
collapse the panels
Adding Panels
If some panels don’t appear,
select the desired panels in the
lower right
Select More Options (…) for
Participants Q&A More Options
additional panels Polling
3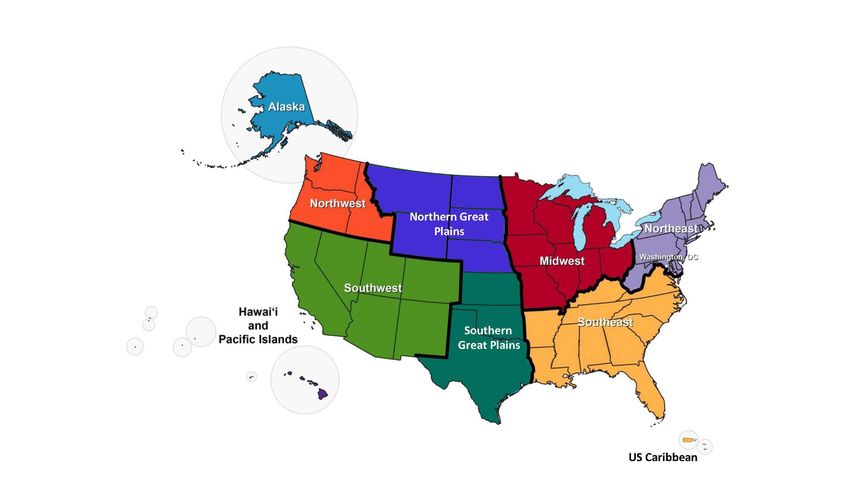
Polling and Feedback
Polling
We’ll ask several poll
questions during the webinar
The polling panel will appear
when we open the first poll
Select your desired response
and hit “Submit”
Webinar Feedback
A feedback form will pop-up
when you exit today’s webinar
4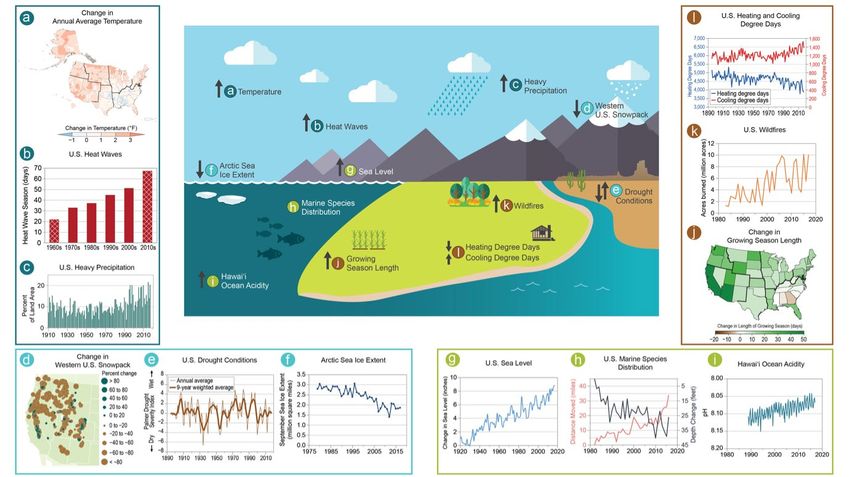
Q&A
Participants are muted
Questions will be moderated at the end
To ask a question:
1. Select “All Panelists” from
the drop-down menu
2. Enter your question in the
Q&A box
3. Hit “Send”
EPA will post responses on the Webinar Series page
www.epa.gov/statelocalenergy/state-local-and-tribal-webinar-series
5
Today’s Agenda
Maggie Molina, Branch Chief, State and Local Climate and
Energy Program, U.S. EPA
Mike Kolian, Physical Scientist/Climate Analyst, U.S. EPA
Lisa Bacanskas, Environmental Scientist, U.S. EPA
Question and Answer Session
6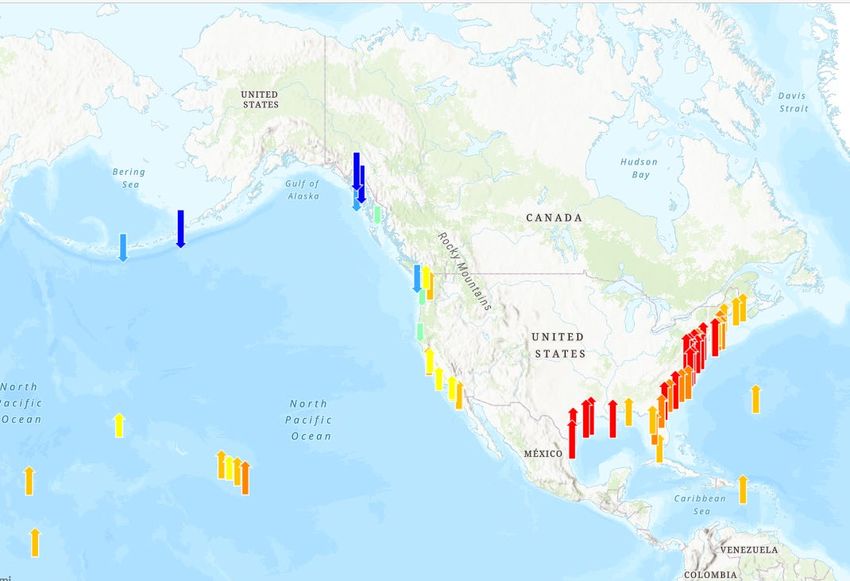
Introduction

               Maggie Molina

      U.S. Environmental Protection Agency

                                             7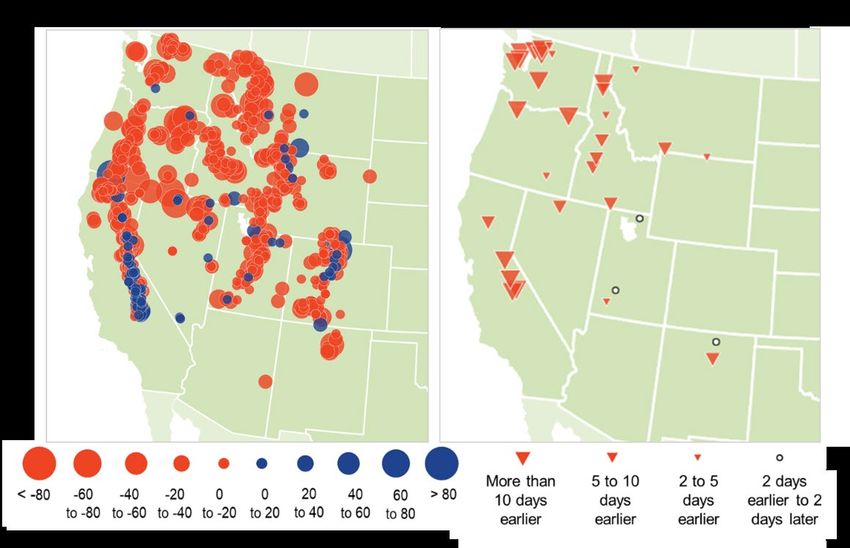
To what extent to do you use climate
change indicators in your work?
(select one)
Frequently
Occasionally
Rarely
Never
I have not yet used indicators, but am considering using them
Poll 1
8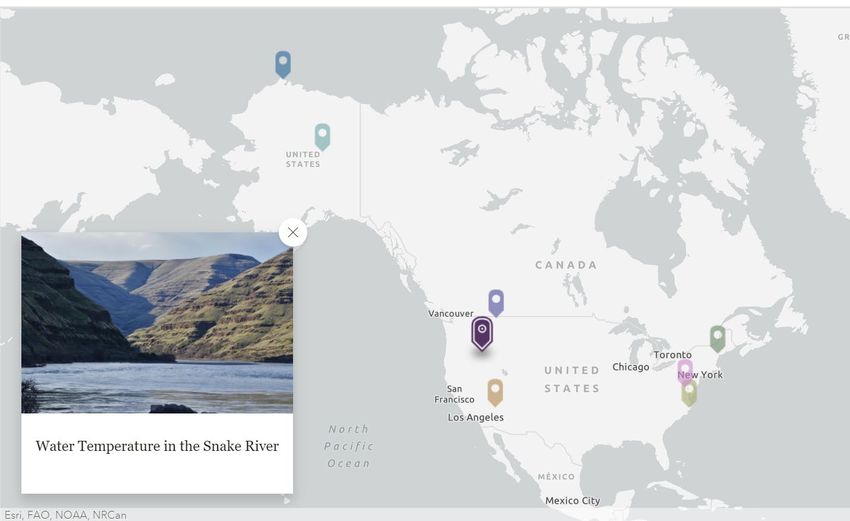
Overview of EPA’s Climate Indicators

                Mike Kolian
              Lisa Bacanskas

      U.S. Environmental Protection Agency

                                             9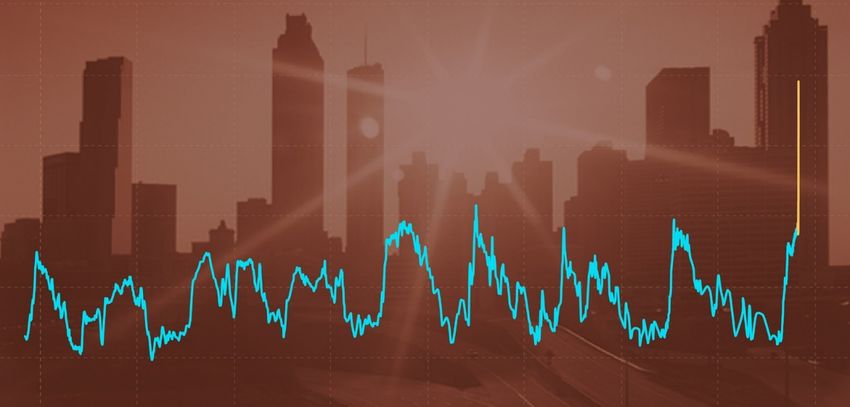
10
            Climate Change Indicators in the United States
                            www.epa.gov/climate-indicators

 Overview of EPA’s Climate Indicators
                          June 17, 2021

U.S. State and Local Climate and Energy Program Webinar Series
11
Climate Change Indicators in the United States
www.epa.gov/climate-indicators
Overview: EPA’s Climate Change Indicators Website
• Current and comprehensive resource on climate science Climate Change is Happening Now
• Observations only (no projections) Several new indicators and five years of data have been
added to EPA’s indicator suite.
• Focuses on the U.S. with global changes for context Explore >>
• Highlights federal government data but also a broader
collaboration of over 50 agencies and organizations
• Peer-reviewed, transparent documentation
• Ongoing updates and development of new indicators
• EPA indicators are well-integrated into U.S. Global Change
Research Program’s (USGCRP’s) National Climate Assessment
(EPA co-leads indicators Interagency Workgroup)
A Growing Body of Scientific Evidence
Published Reports
• 54 indicators; 140 figures; 275 datasets
• Downloadable, sharable and accessible: data,
graphics, interactive tools, and documentation.
2010 2012 2014 2016
201812
Climate Change Indicators in the United States
www.epa.gov/climate-indicators
Importance of Indicators
• Indicators provide multiple lines of evidence that climate change is occurring now and
here in the U.S., affecting public health and the environment
• Allows for routine tracking of observed changes and the latest science and data
• Indicator and data are relevant at national, regional, state and community levels in U.S.
• Climate indicators facilitate examination of risk, exposure and vulnerability, and
Environmental Justice considerations14
Climate Change Indicators in the United States
www.epa.gov/climate-indicators
What the Data Show
• Changes are more evident, changing faster, and becoming more extreme
• Recent observations are eclipsing historical thresholds, setting records is now common
• In 2020, ocean heat content reached the highest level ever in recorded history
(impacting sea level, marine heat waves, and coral beaching)
• Global average temperature in 2020 was among three warmest; 2011-2020 warmest
decade in 141 years
• 2020 Arctic Sea ice extent was the second smallest on record (since 1979)
• Winter and northern regions experienced most change (areas of Alaska warmed
more than 4 degrees F since 1925)
• Changes in seasonality: The wildfire season, pollen season are starting earlier, lasting
longer15
Climate Change Indicators in the United States
Climate Change Indicators Status (March-April)
www.epa.gov/climate-indicators
Global Temperature Global Temperature, 1901-2020
• 2020 was the second-warmest
year on record
• 2011–2020 was the warmest
decade on record
• Global average temperature has
increased at an average rate
of 0.13°F per decade since 1880;
however, since 1981 the average
rate of increase is 0.32°F -more
than twice that rate (NOAA,
2021) The combined land and ocean temperature with a 1901-2000 baseline
11 Data source: NOAA, 202116
Climate Change Indicators in the United States
Climate Change Indicators Status (March-April) www.epa.gov/climate-indicators
Ocean Heat Content Ocean Heat Content, 1955-2020
• Four different data analyses show
that the top 700 meters of the
oceans have become warmer
since 1955. Warming is occuring
in the top 2000 meters as well
• All data sets agree that ocean
warming rates show a particularly
strong increase in the past two
decades across all depths (2019
and 2020 both set records (World
Meteorological Organization, Ocean heat content in the top 700 meters compared against the 1971-2000 average
2021)
11 Agency (MRI/JMA), 2021; NOAA, 2021
Data source: Commonwealth Scientific and Industrial Research Organisation (CSIRO), 2016; Institute of Atmospheric Physics (IAP), 2021; Meteorological Research Institute/Japan Meteorological17
Climate Change Indicators in the United States
Climate Change Indicators Status (March-April)
www.epa.gov/climate-indicators
U.S. Temperatures Rate of Temperature Change in the U.S., 1901-2020
• Since 1901, the average surface
temperature across the contiguous 48
states has risen at an average rate of
0.16°F per decade and more quickly
since the late 1970s (0.31 to 0.54°F
per decade since 1979)
• Eight of the top 10 warmest years on
record for the contiguous 48 states
have occurred since 1998, and 2012
and 2016 were the two warmest years
on record
• We also look at changes in seasonal
temperatures, extreme temperature
(hot and cold), and heat waves
17
Data source: University of Alaska11
Fairbanks, 2021
Data source: NOAA, 202118
Climate Change Indicators in the United States
www.epa.gov/climate-indicators
Seasonal Changes and Climate: Observed evidence in the
United States
Key Evidence of Seasonality with a Timing Aspect
• Seasonal changes in
temperature and precipitation
• Early season warming and
related impacts
• Biological responses and
phenology
• Changes to seasonal conditions
and extreme events19
Climate Change Indicators in the United States
www.epa.gov/climate-indicators
Seasonal Temperatures Change in Seasonal Temperatures by State, 1896-2020
• All seasons are warming
• Winter is warming the fastest
Change in Temperature by Season, 1896-2020
1920
Climate Change Indicators in the United States
www.epa.gov/climate-indicators
Changes in Seasonality: Winter-Spring Transition
• Declines in spring (April 1st)
snowpack
• Most locations also experiencing
an earlier ‘peak’ snowpack
• Trend toward earlier snowmelt
runoff in streams
• Implications: impacts water
supply and streamflow. Early
season drying is associated with
wildfire risk
20
1955-2020 1940-2018In what application are you most likely to
use climate change indicators?
(select one)
Setting context for decision making or planning
Building support for decision making or planning
Public outreach and education
Informing decision making or planning
Implementing actions or plans
Evaluating actions or plans
Poll 2
2122
Climate Change Indicators in the United States
www.epa.gov/climate-indicators
U.S. Heat Waves Heat Wave Characteristics in 50 Large U.S. Cities, 1961-2019
• Defined as: Two or more consecutive days
in which the coolest temperature (adjusted
for humidity) at night is warmer than that
of 85 percent of July and August nights
averaged over a 30-year period
• Heat waves are occurring three times more
often than they did in the 1960s—about six
per year compared to two per year. The
average season length is 47 days longer
• Hot summer days and nights are also
increasing across the U.S. (twice the rate of
summer days in the United States)
The maps show changes in the number of heat waves per year (frequency) and the number of days
between the first and last heat wave of the year (season length). The graphs show averages across all
50 metropolitan areas by decade.
Data Source: NOAA, 202023
Climate Change Indicators in the United States
Climate Change Indicators Status (March-April)
www.epa.gov/climate-indicators
U.S. Residential
Energy Use
• The amount of electricity used
by the average American at
home during the summer has
nearly doubled since 1973, but
it appears to have leveled
somewhat in recent years
• Outdoor temperatures are not
the only factor that influence
energy use. Distribution of the
population, energy efficiency,
utility rates, and other factors
This graph shows the amount of electricity used by the average American during the summer months. The solid line
shows average summer electricity use per capita, and it represents all 50 states plus D.C. For reference, the dashed line
shows the average number of cooling degree days for the same months across the contiguous 48 states plus D.C.
Data source: Energy Information Administration, 11
NOAA, Bureau of Economic Analysis, 202124
Climate Change Indicators in the United States
www.epa.gov/climate-indicators
Relative Sea Level Change Along U.S. Coasts, 1960-2020
U.S. Sea Level
• Rising sea levels are linked to climate change
through two main mechanisms: changes in the
volume of ice on land (shrinking glaciers and ice
sheets) and thermal expansion of the ocean as it
absorbs more heat from the atmosphere
• Relative sea level (RSL) rose along much of the
U.S. coastline, particularly the Mid-Atlantic coast
and parts of the Gulf coast. RSL fell at some
locations in Alaska and the Pacific Northwest.
There, while absolute sea level has risen, land
elevation has risen more rapidly
• Globally, since 1993, average sea level has
risen at a rate of 0.12 to 0.14 inches per year—
roughly twice as fast as the long-term trend
This map shows cumulative changes in relative sea level from 1960 to
2020 at tide gauge stations along U.S. coasts. Data Source: NOAA, 202125
Climate Change Indicators in the United States
www.epa.gov/climate-indicators
Coastal Flooding Frequency of Flooding Along U.S Coasts, 2011-2020 Versus 1950-1959
• Relevance: As relative sea level rises one
noticeable consequence is an increase in
coastal flooding. Rising sea level increases the
reach of tides and storm surge
• Flooding is becoming more frequent along the
U.S. coastline. Every site measured has
experienced an increase in coastal flooding
since the 1950s. The rate of increase is
accelerating at most locations along the East
and Gulf Coasts
• The East Coast suffers the most frequent
coastal flooding and has generally
experienced the largest increases in the Data Source: NOAA
number of flood days. At several locations,
floods are now at least five times more This map shows the average number of days per year in which
25
coastal waters rose above a local threshold for flooding at 33 sites
common than they were in the 1950s along U.S. coasts. Data Source: NOAA, 202126
Climate Change Indicators in the United States
www.epa.gov/climate-indicators
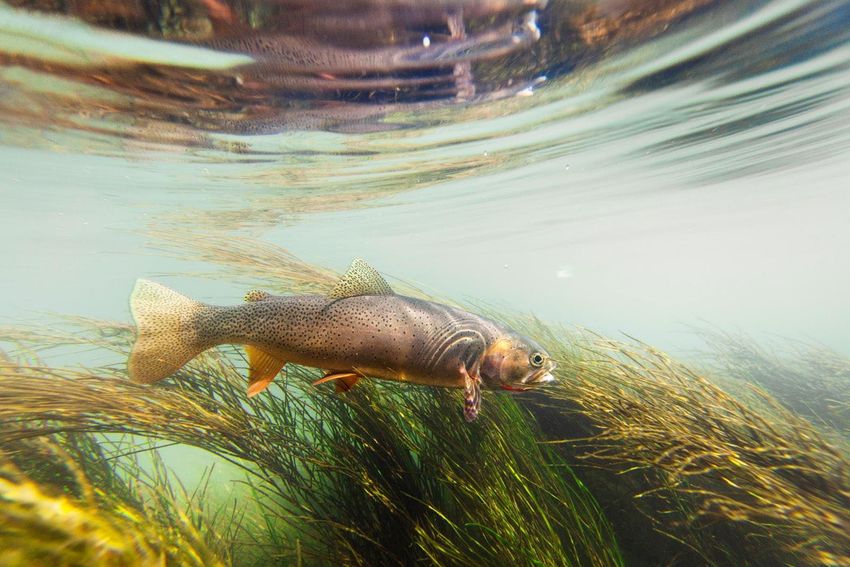
U.S. Wildfires Wildfire Extent in the United States, 1983-2020
• Relevance: The timing, extent and
severity of wildfire in western US forests
is strongly influenced by climate
particularly temperature and drought:
over seasonal to decadal time scales.
Earlier spring melting and reduced
snowpack are also factors
• The extent of area burned by wildfires
each year appears to have increased
since the 1980s. According to National
Interagency Fire Center data, of the 10
years with the largest acreage burned,
all have occurred since 2004, including
the peak year in 2015. This period
coincides with many of the warmest
years on record nationwide
Data Source: National Fire Information Council, United States Forest Service27
Climate Change Indicators in the United States
www.epa.gov/climate-indicators
Wildfire Extent (area burned)
Wildfires from 2000-2015 more than doubled in area burned, compared with the 1984-1999 fires
Wildfire boundaries Wildfires boundaries
for 1984-1999 for 2000-201528
Climate Change Indicators in the United States
www.epa.gov/climate-indicators
Red = new since 2016
List of all Indicators Year = data currency
Greenhouse Gases Oceans Snow and Ice Ecosystems
U.S. Greenhouse Gas Emissions (2018) Ocean Heat (2020) Arctic Sea Ice (2019, 2020) Wildfires (2018-2020)
Global Greenhouse Gas Emissions (2015, Sea Surface Temperature (2020) Antarctic Sea Ice (2018) Wildfire Season (2017)
2018)
Sea Level (2020) Ice Sheets (2018-2019) Streamflow (2018)
Atmospheric Concentrations of GHGs (2018,
Coastal Flooding (2020) Glaciers (2019) Stream Temperature (2014)
2019)
Ocean Acidity (2015, 2018) Permafrost (2019) Great Lakes Water Levels (2020)
Climate Forcing (2019)
Lake Ice (2019) Great Lakes Ice Cover (2019)
Snowfall (2007, 2020) Lake Temperature (2009)
Weather and Climate Health and Society Freeze - Thaw Conditions (2019) Bird Wintering Ranges (2013)
U.S. and Global Temperature (2020) Heating and Cooling Degree Days (2020) Snow Cover (2013, 2020) Marine Species Distribution (2018, 2019)
High and Low Temperatures (2009, 2020) Heat-Related Deaths (2018) Snowpack (2020) Leaf and Bloom Dates (2020)
Heat Waves in U.S. Cities (2019) Cold-Related Deaths (2016) Peak Snowpack (2020)
Seasonal Temperatures (2020) Heat-Related Illnesses (2010) Features
U.S. and Global Precipitation (2020) Lyme Disease (2018) Community Connection: Ice Breakup in Three Alaskan Rivers (2020)
Heavy Precipitation (2020) West Nile Virus (2019) Community Connection: Cherry Blossom Bloom Dates in Washington, D.C (2020)
River Flooding (2015) Residential Energy Use (2020) A Closer Look: Land Loss Along the Atlantic Coast (2011)
Drought (2020) Length of Growing Season (2020) A Closer Look: Temperature and Drought in the Southwest (2019)
SP-Evapotranspiration Index (2020) Ragweed Pollen Season (2015) A Closer Look: Glaciers in Glacier National Park (2015)
Tropical Cyclone Activity (2019, 2020) Growing Degree Days (2020) A Closer Look: Black Guillemots of Cooper Island (2018)
11
Tribal Connection: Water Temperature in the Snake River (2020)29
Climate Change Indicators in the United States
www.epa.gov/climate-indicators
What’s Available?
• Several new indicators (based on new
science, data, and work with partners)
• More years of data for nearly all
indicators (most through 2020)
• Technical documentation
• Interactive tools
• Downloadable figures, images, and
data for all indicators
2930
Climate Change Indicators in the United States
www.epa.gov/climate-indicators
Ways to Explore, Share and Use the Indicators
Visualization tool
• On-line Mapping - use in web tools, Story Maps,
geographic information system-based platforms (e.g.,
EJSCREEN), and analysis
• New data visualization with the Climate Indicators
Explorer tool
On-line Mapping31
Climate Change Indicators in the United States
www.epa.gov/climate-indicators
Ways to Explore, Share and Use the Indicators
Interactive Story Maps: Community
Connections
Tour various regions and communities for a
closer look at climate-related changes32
Climate Change Indicators in the United States
www.epa.gov/climate-indicators
Examples of Regional Observations
Leaf and Earlier leaf and bloom dates at a majority of sites, Growing 9-20 days longer (1895-2020) [+14 days
Bloom Dates with some shifting earlier by more than a week Season regional average]
(1951-1960 vs. 2011-2020) Seasonal Winter months have warmed by more
West Nile Between 1 and 4 cases per 100,000 per year (2002- Temperature than 3°F (1896-2020)
Virus 2019) [avg number of cases for region is 2.5]
Marine Key species have shifted northward—e.g.,
Permafrost Permafrost temperatures are warming,
Fisheries lobster has shifted 99 miles (1973-2019)
Temperatures particularly in northern Alaska (1978-2020) Lyme Increase in incidence (cases per 100,000) in ME,
Disease NH, VT (1991-2018)
Snowpack 97% of long-term measurement sites show a
decline in spring snowpack (1955-2020)
Sea Surface 1.5-2.0°F warmer ocean waters off the coast of Sea Level Has risen 7-11 inches since 1960 for
Temperature the Pacific Northwest (1901-2020) sites in the Mid-Atlantic
Heat Heat waves are becoming more frequent and
Drought Persistent periods of high severity drought in Waves the season length is increasing in many large
the last two decades. cities in the region (1961-2019)
Temperature Temperature in the region has warmed by Coastal Flooding is more frequent along the Southeast
2.6°F, with some areas up to 4.1°F warmer Flooding Atlantic and Gulf coasts, and the rate is
(1901-2020) accelerating (2011-2020 vs. 1950-1959)
Growing Has risen 10-16 inches along the TX coast (1960-
Season 2020)
Wildfires Average annual burned acreage was more than
six times higher in 2002-2018 than in 1984-2001.33
Climate Change Indicators in the United States
www.epa.gov/climate-indicators
USGCRP Indicators and Interagency Workgroup
• Provides science in support of the National
Climate Assessment (NCA). NCA5 will include
a chapter on indicators (due 2023)
• Showcase of Federal agency-specific
indicator efforts, research and development
• A platform website for updated, well-
documented science
www.globalchange.gov/indicators34
Climate Change Indicators in the United States
www.epa.gov/climate-indicators
Thank You for Attending!
www.epa.gov/climate-indicatorsQuestion and Answer Session
Upcoming Webinars
Maggie Molina
June 24, 2 PM (ET)
Molina.Maggie@epa.gov
Climate and Heat: Trends, Health Impacts and Risk
Mike Kolian June 29, 1 PM (ET)
kolian.michael@epa.gov Estimating the Public Health Benefits of Clean Energy
Register Today!
Lisa Bacanskas www.epa.gov/statelocalenergy/state-local-and-tribal-webinar-series
Bacanskas.Lisa@epa.gov
Visit the Climate Indicators Website | www.epa.gov/climate-indicators
Visit Our Website | www.epa.gov/statelocalenergy
Sign Up for Our Newsletter | www.epa.gov/statelocalenergy/state-and-local-energy-newsletters
Join Our LinkedIn Group | www.linkedin.com/groups/12129811/
35You can also read