USB QUANTUM SENSOR OWNER'S MANUAL - Model SQ-520 - Apogee Instruments
←
→
Page content transcription
If your browser does not render page correctly, please read the page content below
OWNER’S MANUAL

USB QUANTUM SENSOR
                        Model SQ-520
                          Rev: 29-Mar-2022

 APOGEE INSTRUMENTS, INC. | 721 WEST 1800 NORTH, LOGAN, UTAH 84321, USA
  TEL: (435) 792-4700 | FAX: (435) 787-8268 | WEB: APOGEEINSTRUMENTS.COM

                  Copyright © 2022 Apogee Instrument, Inc.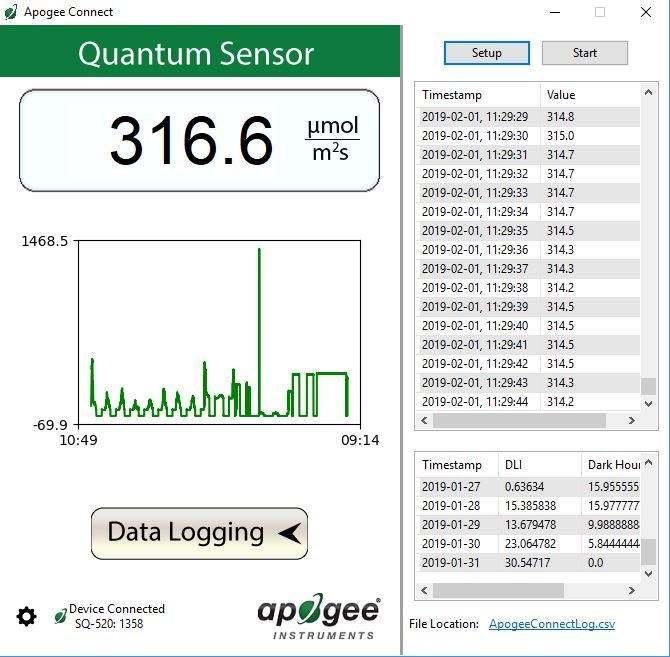
TABLE OF CONTENTS
Owner’s Manual ............................................................................................................................................................................... 1

    Certificate of Compliance ............................................................................................................................................................. 3

    Introduction.................................................................................................................................................................................. 4

    Sensor Models .............................................................................................................................................................................. 5

    Specifications................................................................................................................................................................................ 6

    Deployment and Installation ........................................................................................................................................................ 9

    Software Installation .................................................................................................................................................................... 9

    Operation and Measurement ..................................................................................................................................................... 11

    Windows Software ..................................................................................................................................................................... 15

    Mac Software ............................................................................................................................................................................. 20

    Maintenance and Recalibration ................................................................................................................................................. 25

    Troubleshooting and Customer Support .................................................................................................................................... 27

    Return and Warranty Policy ....................................................................................................................................................... 28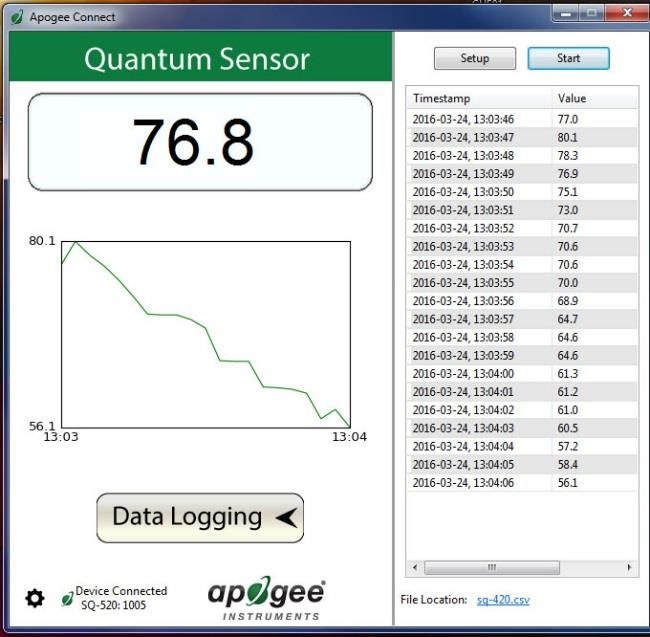
CERTIFICATE OF COMPLIANCE
EU Declaration of Conformity

This declaration of conformity is issued under the sole responsibility of the manufacturer:

         Apogee Instruments, Inc.
         721 W 1800 N
         Logan, Utah 84321
         USA

for the following product(s):

Models: SQ-520
Type: Quantum Sensor

The object of the declaration described above is in conformity with the relevant Union harmonization legislation:

2014/30/EU        Electromagnetic Compatibility (EMC) Directive
2011/65/EU        Restriction of Hazardous Substances (RoHS 2) Directive
2015/863/EU       Amending Annex II to Directive 2011/65/EU (RoHS 3)

Standards referenced during compliance assessment:

EN 61326-1:2013 Electrical equipment for measurement, control, and laboratory use – EMC requirements
EN 50581:2012 Technical documentation for the assessment of electrical and electronic products with respect to
                the restriction of hazardous substances

Please be advised that based on the information available to us from our raw material suppliers, the products
manufactured by us do not contain, as intentional additives, any of the restricted materials including lead (see
note below), mercury, cadmium, hexavalent chromium, polybrominated biphenyls (PBB), polybrominated
diphenyls (PBDE), bis (2-ethylhexyl) phthalate (DEHP), butyl benzyl phthalate (BBP), dibutyl phthalate (DBP), and
diisobutyl phthalate (DIBP). However, please note that articles containing greater than 0.1 % lead concentration
are RoHS 3 compliant using exemption 6c.

Further note that Apogee Instruments does not specifically run any analysis on our raw materials or end products
for the presence of these substances, but we rely on the information provided to us by our material suppliers.

Signed for and on behalf of:
Apogee Instruments, March 2022

Bruce Bugbee
President
Apogee Instruments, Inc.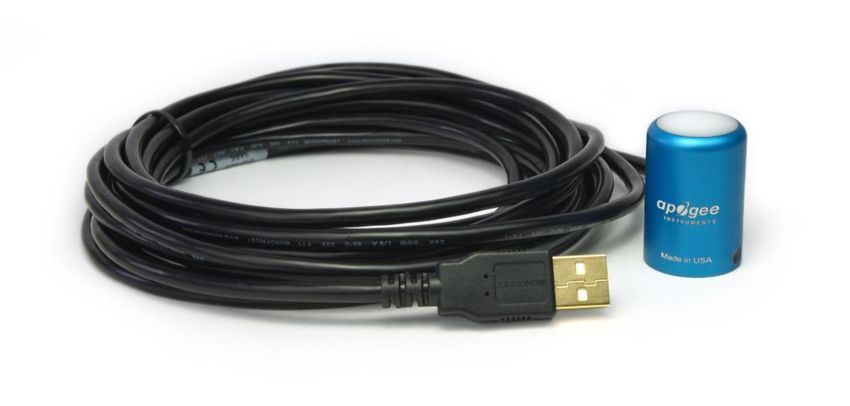
INTRODUCTION
Radiation that drives photosynthesis is called photosynthetically active radiation (PAR) and is typically defined as
total radiation across a range of 400 to 700 nm. PAR is almost universally quantified as photosynthetic photon flux
density (PPFD), the sum of photons from 400 to 700 nm in units of micromoles per square meter per second (µmol
m-2 s-1, equal to microEinsteins m-2 s-1). While microEinsteins and micromoles are equal (one Einstein = one mole of
photons), the Einstein is not an SI unit, so expressing PPFD as µmol m -2 s-1 is preferred. Daily total PPFD is typically
reported in units of moles of photons per square meter per day (mol m -2 d-1) and is often called daily light integral
(DLI).

The acronym PPF is also used and refers to the photosynthetic photon flux. The acronyms PPF and PPFD refer to
the same variable. Both terms are used because there is not a universal definition of the term flux. Flux is
sometimes defined as per unit area per unit time and sometimes defined as per unit time only. PPFD is used in this
manual.

Sensors that measure PPFD are often called quantum sensors due to the quantized nature of radiation. A quantum
refers to the minimum quantity of radiation, one photon, involved in physical interactions (e.g., absorption by
photosynthetic pigments). In other words, one photon is a single quantum of radiation.

Typical applications of quantum sensors include measurement of incident PPFD on plant canopies in outdoor
environments or in greenhouses and growth chambers, and reflected or under-canopy (transmitted) PPFD
measurement in the same environments.

Apogee Instruments SQ-500 series quantum sensors consist of a cast acrylic diffuser (filter), interference filter,
photodiode, and signal processing circuitry mounted in an anodized aluminum housing, and a cable to connect the
sensor to a measurement device. SQ-500 series quantum sensors are designed for continuous PPFD measurement
in indoor or outdoor environments. The sensor is potted solid with no internal air space. The signal from the sensor
is directly proportional to radiation incident on a flat surface where the radiation comes from all angles of a
hemisphere.
SENSOR MODELS
This manual covers the USB quantum sensor, model SQ-520 (listed in bold below). Additional models are covered
in their respective manuals.

                                     Model                 Signal
                                     SQ-520                 USB
                                     SQ-500               0-40 mV
                                     SQ-512                0-2.5 V
                                     SQ-515                0-5 V
                                     SQ-521               SDI-12
                                     SQ-522               Modbus

                                                              A sensor’s model number and serial number
                                                              are located near USB connector. If the
                                                              manufacturing date of a specific sensor is
                                                              required, please contact Apogee Instruments
                                                              with the serial number of the sensor.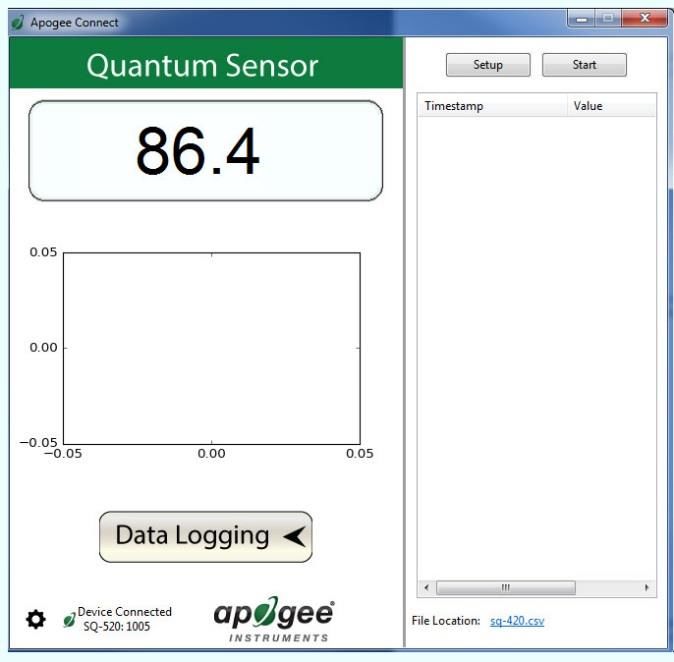
SPECIFICATIONS
                                                                       SQ-520
     Resolution                                                    0.1 µmol m-2 s-1
     Calibration Factor                          Custom for each sensor and stored in the firmware
     Calibration Uncertainty                          ± 5 % (see calibration Traceability below)
     Measurement Range                                          0 to 4000 µmol m-2 s-1
     Measurement Repeatability                                     Less than 0.5 %
     Long-term Drift
                                                               Less than 2 % per year
     (Non-stability)
     Non-linearity                                     Less than 1 % (up to 4000 µmol m-2 s-1)
     Response Time                                         Software updates every second
     Field of View                                                      180°
     Spectral Range                   389 to 692 nm ± 5 nm (wavelengths where response is greater than 50 %)
     Spectral Selectivity               Less than 10 % from 412 to 682 ± 5 nm (see Spectral Response below)
     Directional (Cosine)
                                   ± 2 % at 45° zenith angle, ± 5 % at 75° zenith angle (see Cosine Response below)
     Response
     Temperature Response                      -0.11± 0.04 % per C (see Temperature Response below)
     Azimuth Error                                                 Less than 0.5 %
     Tilt Error                                                    Less than 0.5 %
     Detector                                             Blue-enhanced silicon photodiode
     Housing                                        Anodized aluminum body with acrylic diffuser
     IP Rating                                                            IP68
                                 -40 to 70 C, 0 to 100 % relative humidity, can be submerged in water up to depths of
     Operating Environment
                                                                          30 m
     Dimensions                                             24 mm diameter, 37 mm height
     Mass                                                     Sensor head weighs 90 g
     USB Cable                                                      4.5 m (15 ft)
     Current Draw (when
                                                                       61 mA
     Logging)

Calibration Traceability

Apogee Instruments SQ-500 series quantum sensors are calibrated through side-by-side comparison to the mean
of four transfer standard quantum sensors under a reference lamp. The reference quantum sensors are
recalibrated with a quartz halogen lamp traceable to the National Institute of Standards and Technology (NIST).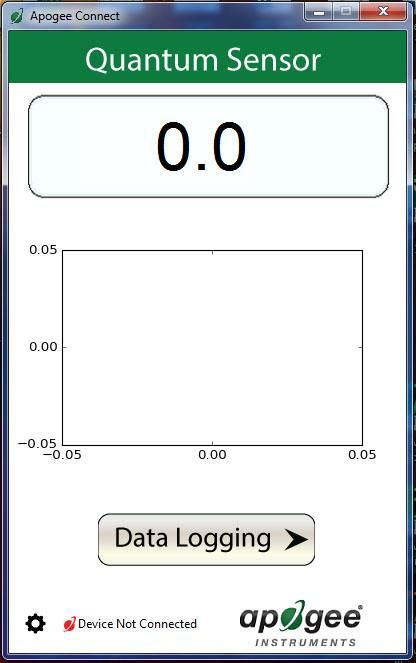
Spectral Response

                         Mean spectral response measurements of six
                         replicate Apogee SQ-100 (original) and SQ-
                         500 (full-spectrum) series quantum sensors.
                         Spectral response measurements were made
                         at 10 nm increments across a wavelength
                         range of 300 to 800 nm with a
                         monochromator and an attached electric
                         light source. Measured spectral data from
                         each quantum sensor were normalized by
                         the measured spectral response of the
                         monochromator/electric light combination,
                         which was measured with a
                         spectroradiometer.

Temperature Response

                       Mean temperature response of ten SQ-500
                       series quantum sensors (errors bars represent
                       two standard deviations above and below
                       mean). Temperature response measurements
                       were made at 10 C intervals across a
                       temperature range of approximately -10 to 40 C
                       in a temperature-controlled chamber under a
                       fixed, broad spectrum, electric lamp. At each
                       temperature set point, a spectroradiometer was
                       used to measure light intensity from the lamp
                       and all quantum sensors were compared to the
                       spectroradiometer. The spectroradiometer was
                       mounted external to the temperature control
                       chamber and remained at room temperature
                       during the experiment.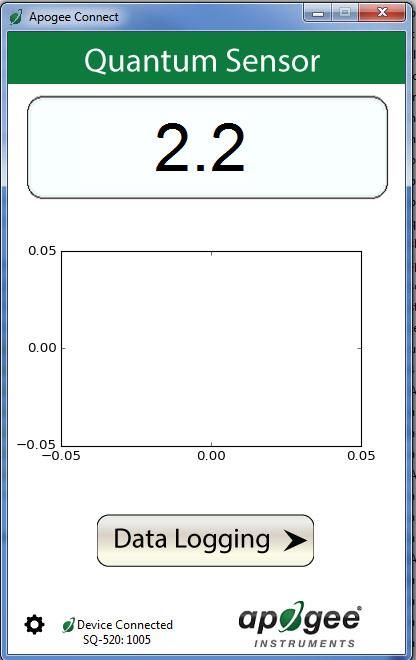
Cosine Response

                  Directional (cosine) response is defined as the
                  measurement error at a specific angle of
                  radiation incidence. Error for Apogee SQ-500
                  series quantum sensors is approximately ± 2 %
                  and ± 5 % at solar zenith angles of 45° and 75°,
                  respectively.

                                 Mean directional (cosine) response of
                                 seven apogee SQ-500 series quantum
                                 sensors. Directional response
                                 measurements were made on the
                                 rooftop of the Apogee building in
                                 Logan, Utah. Directional response
                                 was calculated as the relative
                                 difference of SQ-500 quantum
                                 sensors from the mean of replicate
                                 reference quantum sensors (LI-COR
                                 models LI-190 and LI-190R, Kipp &
                                 Zonen model PQS 1). Data were also
                                 collected in the laboratory using a
                                 reference lamp and positioning the
                                 sensor at varying angles.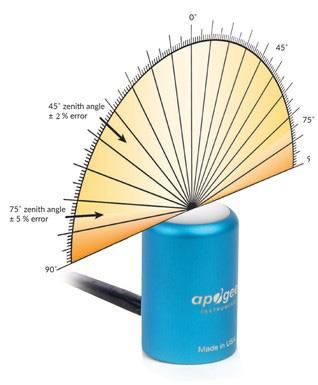
DEPLOYMENT AND INSTALLATION
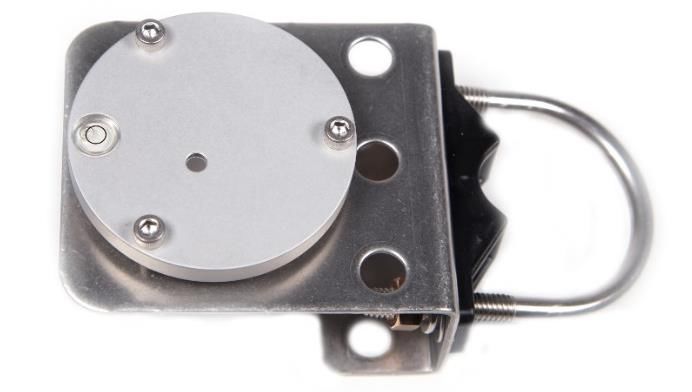
Mount the sensor to a solid surface with the nylon mounting screw provided. To accurately measure PPFD incident
on a horizontal surface, the sensor must be level. An Apogee Instruments model AL-100 leveling plate is
recommended for this purpose. To facilitate mounting on a cross arm, an Apogee Instruments model AL-120
mounting bracket is recommended.
Nylon Screw: 10-32 x 3/8 Nylon Screw: 10-32 x 3/8
Model: AL-100 Model: AL-120
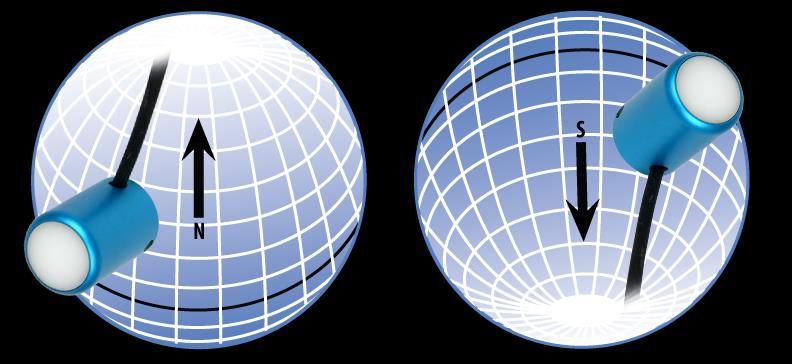
To minimize azimuth error, the sensor should be mounted with the cable pointing toward true north in the
northern hemisphere or true south in the southern hemisphere. Azimuth error is typically less than 0.5 %, but it is
easy to minimize by proper cable orientation.
In addition to orienting the cable to point toward the nearest pole, the sensor should also be mounted such that
obstructions (e.g., weather station tripod/tower or other instrumentation) do not shade the sensor. Once
mounted, the blue cap should be removed from the sensor. The blue cap can be used as a protective covering for
the sensor when it is not in use.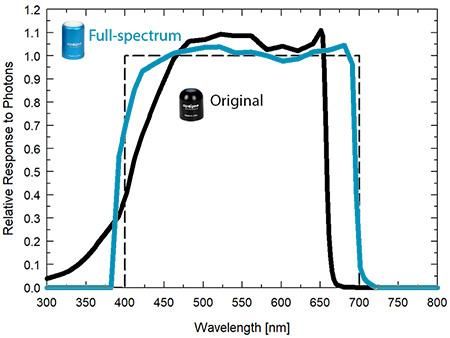
SOFTWARE INSTALLATION
The most recent version of ApogeeConnect software can be downloaded at
http://www.apogeeinstruments.com/downloads/.

Installing the software on a PC (Windows compatible, XP and later)

    1.   Double click on the installer package:
    2.   On the ‘Welcome’ screen, please click ‘Next’ to continue.
    3.   Select the radio button next to “I Agree” to the UELA… and click ‘Next’ to continue.
    4.   On the ‘Ready to Install the Program’ screen, click ‘Install’ to continue.
    5.   Click ‘Finish’ to complete the installation. There are shortcuts on your desktop and in your start bar.

Installing the software on a Mac (Mac compatible, 10.10 and later)

    1.   Double click on the installer package
    2.   On the ‘Introduction’ screen, please click ‘Continue’ to proceed.
    3.   Select ‘Continue’ on the ‘Read Me’ screen to continue, this screen contains a history of updates made to
         the ApogeeConnect software versions.
    4.   Select ‘Continue’ on the ‘License’ screen to receive a prompt to agree to the terms of the software license
         agreement. Click ‘Agree’ to continue once you receive the prompt.
    5.   On the ‘Installation Type’ screen, click ‘Install’ to install the software. You can change the location the
         software installs to by clicking ‘Change Install Location…’. *Note: You may be prompted for an
         administrator password at this time. If you are, proceed by entering your respective password and clicking
         ‘Install Software’.
    6.   Once you receive the message “The installation was successful.” on the ‘Summary’ screen click ‘Close’.
         Your software is now ready to be used.
OPERATION AND MEASUREMENT
Spectral Error
The combination of diffuser transmittance, interference filter transmittance, and photodetector sensitivity yields
spectral response of a quantum sensor. A perfect photodetector/filter/diffuser combination would exactly match
the defined plant photosynthetic response to photons (equal weighting to all photons between 400 and 700 nm,
no weighting of photons outside this range), but this is challenging in practice. Mismatch between the defined
plant photosynthetic response and sensor spectral response results in spectral error when the sensor is used to
measure radiation from sources with a different spectrum than the radiation source used to calibrate the sensor
(Federer and Tanner, 1966; Ross and Sulev, 2000).
Spectral errors for PPFD measurements made under common radiation sources for growing plants were calculated
for Apogee SQ-100 and SQ-500 series quantum sensors using the method of Federer and Tanner (1966). This
method requires PPFD weighting factors (defined plant photosynthetic response), measured sensor spectral
response (shown in Spectral Response section on page 7), and radiation source spectral outputs (measured with a
spectroradiometer). Note, this method calculates spectral error only and does not consider calibration, directional
(cosine), temperature, and stability/drift errors. Spectral error data (listed in table below) indicate errors less than
5 % for sunlight in different conditions (clear, cloudy, reflected from plant canopies, transmitted below plant
canopies) and common broad spectrum electric lamps (cool white fluorescent, metal halide, high pressure
sodium), but larger errors for different mixtures of light emitting diodes (LEDs) for the SQ-100 series sensors.
Spectral errors for the SQ-500 series sensors are smaller than those for SQ-100 series sensors because the spectral
response of SQ-500 series sensors is a closer match to the defined plant photosynthetic response.
Quantum sensors are the most common instrument for measuring PPFD, because they are about an order of
magnitude lower cost the spectroradiometers, but spectral errors must be considered. The spectral errors in the
table below can be used as correction factors for individual radiation sources.
Spectral Errors for PPFD Measurements with Apogee SQ-100 and SQ-500 Series Quantum Sensors
SQ-100 Series SQ-500 Series
Radiation Source (Error Calculated Relative to Sun, Clear Sky) PPFD Error [%] PPFD Error [%]
Sun (Clear Sky) 0.0 0.0
Sun (Cloudy Sky) 0.2 0.1
Reflected from Grass Canopy 3.8 -0.3
Transmitted below Wheat Canopy 4.5 0.1
Cool White Fluorescent (T5) 0.0 0.1
Metal Halide -2.8 0.9
Ceramic Metal Halide -16.1 0.3
High Pressure Sodium 0.2 0.1
Blue LED (448 nm peak, 20 nm full-width half-maximum) -10.5 -0.7
Green LED (524 nm peak, 30 nm full-width half-maximum) 8.8 3.2
Red LED (635 nm peak, 20 nm full-width half-maximum) 2.6 0.8
Red LED (667 nm peak, 20 nm full-width half-maximum) -62.1 2.8
Red, Blue LED Mixture (80 % Red, 20 % Blue) -72.8 -3.9
Red, Blue, White LED Mixture (60 % Red, 25 % White, 15 % Blue) -35.5 -2.0
Cool White LED -3.3 0.5
Warm White LED -8.9 0.2
Federer, C.A., and C.B. Tanner, 1966. Sensors for measuring light available for photosynthesis. Ecology 47:654-657.
Ross, J., and M. Sulev, 2000. Sources of errors in measurements of PAR. Agricultural and Forest Meteorology
100:103-125.Yield Photon Flux Density (YPFD) Measurements
Photosynthesis in plants does not respond equally to all photons. Relative quantum yield (plant photosynthetic
efficiency) is dependent on wavelength (green line in figure below) (McCree, 1972a; Inada, 1976). This is due to the
combination of spectral absorptivity of plant leaves (absorptivity is higher for blue and red photons than green
photons) and absorption by non-photosynthetic pigments. As a result, photons in the wavelength range of
approximately 600-630 nm are the most efficient.
Defined plant response to
photons (black line, weighting
factors used to calculate PPFD),
measured plant response to
photons (green line, weighting
factors used to calculate YPFD),
and SQ-500 series quantum
sensor response to photons
(sensor spectral response).
One potential definition of PAR is weighting photon flux density in units of mol m-2 s-1 at each wavelength
between 300 and 800 nm by measured relative quantum yield and summing the result. This is defined as yield
photon flux density (YPFD, units of mol m-2 s-1) (Sager et al., 1988). There are uncertainties and challenges
associated with this definition of PAR. Measurements used to generate the relative quantum yield data were made
on single leaves under low radiation levels and at short time scales (McCree, 1972a; Inada, 1976). Whole plants
and plant canopies typically have multiple leaf layers and are generally grown in the field or greenhouse over the
course of an entire growing season. Thus, actual conditions plants are subject to are likely different than those the
single leaves were in when measurements were made by McCree (1972a) and Inada (1976). In addition, relative
quantum yield shown in the figure above is the mean from twenty-two species grown in the field (McCree, 1972a).
Mean relative quantum yield for the same species grown in growth chambers was similar, but there were
differences, particularly at shorter wavelengths (less than 450 nm). There was also some variability between
species (McCree, 1972a; Inada, 1976).
McCree (1972b) found that equally weighting all photons between 400 and 700 nm and summing the result,
defined as photosynthetic photon flux density (PPFD, in units of mol m-2 s-1), was well correlated to
photosynthesis, and very similar to correlation between YPFD and photosynthesis. As a matter of practicality, PPFD
is a simpler definition of PAR. At the same time as McCree’s work, others had proposed PPFD as an accurate
measure of PAR and built sensors that approximated the PPFD weighting factors (Biggs et al., 1971; Federer and
Tanner, 1966). Correlation between PPFD and YPFD measurements for several radiation sources is very high (figure
below), as an approximation, YPFD = 0.9PPFD. As a result, almost universally PAR is defined as PPFD rather than
YPFD, although YPFD has been used in some studies. The only radiation sources shown (figure below) that don’t
fall on the regression line are the high pressure sodium (HPS) lamp, reflection from a plant canopy, and
transmission below a plant canopy. A large fraction of radiation from HPS lamps is in the red range of wavelengths
where the YPFD weighting factors (measured relative quantum yield) are at or near one. The factor for converting
PPFD to YPFD for HPS lamps is 0.95, rather than 0.90. The factor for converting PPFD to YPFD for reflected and
transmitted photons is 1.00.Correlation between
photosynthetic photon flux
density (PPFD) and yield photon
flux density (YPFD) for multiple
different radiation sources. YPFD
is approximately 90 % of PPFD.
Measurements were made with
a spectroradiometer (Apogee
Instruments model PS-200) and
weighting factors shown in the
previous figure were used to
calculate PPFD and YPFD.
Biggs, W., A.R. Edison, J.D. Eastin, K.W. Brown, J.W. Maranville, and M.D. Clegg, 1971. Photosynthesis light sensor
and meter. Ecology 52:125-131.
Federer, C.A., and C.B. Tanner, 1966. Sensors for measuring light available for photosynthesis. Ecology 47:654-657.
Inada, K., 1976. Action spectra for photosynthesis in higher plants. Plant and Cell Physiology 17:355-365.
McCree, K.J., 1972a. The action spectrum, absorptance and quantum yield of photosynthesis in crop plants.
Agricultural Meteorology 9:191-216.
McCree, K.J., 1972b. Test of current definitions of photosynthetically active radiation against leaf photosynthesis
Underwater Measurements and Immersion Effect
data. Agricultural Meteorology 10:443-453.
When a quantum sensor that was calibrated in air is used to make underwater
Sager, J.C., W.O. Smith, J.L. Edwards, and K.L. Cyr, 1988. Photosynthetic efficiency and phytochrome photoequilibria
determination using spectral data. Transactions of the ASAE 31:1882-1889.Underwater Measurements and Immersion Effect
When a radiation sensor is submerged in water, more of the incident radiation is backscattered out of the diffuser
than when the sensor is in air (Smith, 1969; Tyler and Smith, 1970). This phenomenon is caused by the difference
in the refractive index for air (1.00) and water (1.33), and is called the immersion effect. Without correction for the
immersion effect, radiation sensors calibrated in air can only provide relative values underwater (Smith, 1969;
Tyler and Smith, 1970). Immersion effect correction factors can be derived by making measurements in air and at
multiple water depths at a constant distance from a lamp in a controlled laboratory setting.
The SQ-520 sensor has an immersion effect correction factor of 1.25. The immersion
effect correction factor can be automatically applied to SQ-520 measurements by
turning on the immersion setting in the settings option of the ApogeeConnect
software, as pictured. Once you are finished making your underwater measurements
simply uncheck the immersion setting in the software to turn it off and continue
making measurements in air like normal.
When making underwater measurements, only the sensor and cable can go in the
water. The USB connector is not waterproof and must not get wet.
Further information on underwater measurements and the immersion effect can be found at
http://www.apogeeinstruments.com/underwater-par-measurements/.
Smith, R.C., 1969. An underwater spectral irradiance collector. Journal of Marine Research 27:341-351.
Tyler, J.E., and R.C. Smith, 1970. Measurements of Spectral Irradiance Underwater. Gordon and Breach, New York,
New York. 103 pagesWINDOWS SOFTWARE When the SQ-520 sensor is not plugged into the USB port, the software will display a message in the lower left corner, “Device Not Connected,” indicating it cannot establish communication with the sensor. Plug the sensor into a USB port and allow some time for the sensor to automatically establish communication with the software. Once established, the message in the lower left corner will display “Device Connected-Model: SN ####” and real-time PAR readings will update on the screen. Moving the sensor closer to a light source should increase the readings, while blocking all light from the sensor should drop the reading to zero.
Click the ‘Settings’ icon to display the software
options.

Note ‘Light Source’ is not a selectable option. The SQ-
520 is calibrated for all light sources, therefore, this
function is not necessary for the SQ-520. The function
is designed to give increased accuracy for the SQ-420.

Clicking ‘Immersion Setting’ will automatically apply
the sensor’s immersion effect correction factor of 1.25
to the sensor measurements. This setting should be
used when the sensor is being used to take
measurements underwater.

Clicking ‘Calibration’ will display the factory calibrated
multiplier and offset values. These values are saved in
firmware and can be recovered by clicking the
‘Recover Original’ button. Deriving a new calibration
multiplier and offset is accomplished by clicking the
‘Recalibrate’ button. This is applicable if users want to
calibrate the sensor to their own specific light source.
Note that a reference PAR value of the light source is
required to complete a recalibration.
After clicking the ‘Recalibate’ button the user will be
prompted to cover the sensor. Place a dark cap over the
sensor and wait for the real-time PAR reading to settle
at zero. Click OK.

Uncover the sensor and wait for the PAR reading to
settle before entering the reference value. Click OK.

The multiplier and offset values will automatically
calculate and update in the appropriate field. Be sure to
click ‘Save’ to retain the new multiplier and offset.

Clicking ‘Data Logging’ will allow the user to log interval
measurements in a csv file while the software is open
and communicating with the sensor.

Click ‘Setup’ and the Setup Logging window appears.
Click the ‘Browse’ button to create or select a csv file.

Select the desired sampling interval. Note that 1 second
is the minimum interval allowed. Click ‘Start’.
The data logging window will start to update at the
specified sampling interval and display the Timestamp,
Light Source, and Data Value. At the same time, data will
be written to the csv file. Note that if the csv file is open
in another program new data will not be saved to it.

The data logging window can be closed without affecting
logged data by clicking the ‘Data Logging’ button. The
‘Stop’ button must be clicked to end data logging.

The about screen tells you the software and firmware
versions. These can be used to help troubleshoot if
problems arise.

 ‘Manage Field Logging’ is used to setup the SQ-520 for
 use in the field. When the SQ-520 is supplied power
 from a USB power source (plug or select batteries) it will
 log data which you can retrieve. Choose the interval that
 data is saved as well as the interval that data is sampled
 and the light source used. The shortest sampling interval
 is 1 second. The longest sampling or logging interval is
 1440 minutes (1 day). Click ‘Load Settings’ to see current
 settings and ‘Save Settings’ to save the settings you want
 to the sensor. Note: If you don’t click save the sensor
 won’t change the settings.
Set the sampling interval in minutes or seconds. The
sampling interval is how often a measurement is taken
and logging interval is how often the data is saved. The
logged data is the average of the samples. The logging
interval must be evenly divided by the sampling interval.
For example, if the logging interval is 5 minutes and the
sampling interval is 2 minutes it causes an error. But a
sampling interval of 1 minute is acceptable.

Before clicking ‘Get Logged Data’ it is important to set the
time of the last logged data point. This is used to back
calculate the timestamps for the remaining data points. If
you just unplugged the sensor and plugged it into the
computer, the preloaded day and time should be
sufficient.

Click ‘Get Logged Data’ to save the data to your computer.
You will be asked where you want to save the data.

Click ‘Erase Data’ to erase all the saved data. This can’t be
undone.

When the software is open and logging data from sensor
models SQ-420 and SQ-520, it will calculate daily light
integral (DLI) in moles and Dark Hours in hours each day at
12:00 AM using PAR values collected during the previous
36 hours. The Dark Hours value is calculated using the
“Darkness Threshold” setting. The number of continuously
logged PAR values less than the Darkness Threshold are
counted and multiplied by the logging interval to calculate
the number of Dark Hours. This represents the longest
continuous duration of darkness, not the total duration of
darkness.

To use additional SQ-520 devices, open additional SQ-520 software windows. The device serial number will
display in the lower left-hand corner of the corresponding software window. Devices may be selected by serial
number in the tool bar.
MAC SOFTWARE
When the SQ-520 sensor is not plugged into the USB
port, the software will display a message in the lower left
corner, “Device Not Connected,” indicating it cannot
establish communication with the sensor.

Plug the sensor into a USB port and allow some time
for the sensor to automatically establish
communication with the software. Once established,
the message in the lower left corner will display
“Device Connected SN: ####” and real-time PAR
readings will update on the screen. Moving the sensor
closer to a light source should increase the readings,
while blocking all light from the sensor should drop the
reading to zero.
Click the ‘Settings’ icon to display the software options.

Clicking ‘Light Source’ will allow the user to change the
sensor’s default calibration reference from Electric to
Sunlight. Electric should be selected when measuring
most indoor artificial light sources, while Sunlight
should be selected when measuring sunlight (such as
when evaluating the need for recalibration).

Clicking ‘Immersion Setting’ will automatically apply
the sensor’s immersion effect correction factor of 1.25
to the sensor measurements. This setting should be
used when the sensor is being used to take
measurements underwater.
Clicking ‘Calibration’ will display the factory calibrated
multiplier and offset values. These values are saved in
firmware and can be recovered by clicking the
‘Recover Original’ button. Deriving a new calibration
multiplier and offset is accomplished by clicking the
‘Recalibrate’ button. This is applicable if users want to
calibrate the sensor to their own specific light source.
Note that a reference PAR value of the light source is
required to complete a recalibration.

After clicking the ‘Recalibrate’ button the user will be
prompted to cover the sensor. Place a dark cap over
the sensor and wait for the real-time PAR reading to
settle at zero. Click OK.

Uncover the sensor and wait for the PAR reading to
settle before entering the reference value. Click OK.

The multiplier and offset values will automatically
calculate and update in the appropriate field. Be sure
to click ‘Save’ to retain the new multiplier and offset.
Clicking ‘Data Logging’ will allow the user to log
interval measurements in a csv file while the software
is open and communicating with the sensor.

Click ‘Setup’ and the Setup Logging window appears.
Click the ‘Browse button to create or select a csv file.

Select the desired sampling interval. Note that 1
second is the minimum interval allowed. Click ‘Start’.

The data logging window will start to update at the
specified sampling interval and display the Timestamp,
Light Source, and Data Value. At the same time, data
will be written to the csv file. Note that if the csv file is
open in another program new data will not be saved to
it.

The data logging window can be closed without
affecting logged data by clicking the ‘Exit’ button. The
‘Stop’ button must be clicked to end data logging.

The about screen tells you the software and firmware
versions. These can be used to help troubleshoot if
problems arise.
‘Manage Field Logging’ is used to setup the SQ-520 for
the use in the field. When the SQ-520 is supplied
power from a USB power source (plug or select
batteries) it will log data which you can retrieve.
Choose the interval the data is saved as well as the
interval that data is sampled and the light source used.
The shortest sampling interval is 1 second. The longest
sampling or logging interval is 1440 minutes (1 day).
Click ‘Load Settings’ to see current settings and ‘Save
Setting’ to save the settings you want to the sensor.
Note: If you don’t click save the sensor won’t change
the settings.

Set the sampling interval in minutes or seconds. The
sampling interval is how often a measurement is taken
and logging interval is how often the data is saved. The
logged data is the average of the samples. The logging
interval must be evenly divided by the sampling
interval. For example, if the logging interval is 5
minutes and the sampling interval is 2 minutes it
causes an error. But a sampling interval of 1 minute is
acceptable.

Before clicking ‘Get Logged Data’ it is important to set
the time of the last logged data point. This is used to
back calculate the timestamps for the remaining data
points. If you just unplugged the sensor and plugged it
into the computer, the preloaded day and time should
be sufficient.

Click ‘Get Logged Data’ to save the data to your
computer. You will be asked where you want to save
the data.

Click ‘Erase Data’ to erase all the save data. This can’t
be undone.

When the software is open and logging data from sensor
models SQ-420 and SQ-520, it will calculate daily light
integral (DLI) in moles and Dark Hours in hours each day at
12:00 AM using PAR values collected during the previous
36 hours. The Dark Hours value is calculated using the
“Darkness Threshold” setting. The number of continuously
logged PAR values less than the Darkness Threshold are
counted and multiplied by the logging interval to calculate
the number of Dark Hours. This represents the longest
continuous duration of darkness, not the total duration of
darkness.
MAINTENANCE AND RECALIBRATION
Blocking of the optical path between the target and detector can cause low readings. Occasionally, accumulated
materials on the diffuser of the upward-looking sensor can block the optical path in three common ways:

    1.   Moisture or debris on the diffuser.
    2.   Dust during periods of low rainfall.
    3.   Salt deposit accumulation from evaporation of sea spray or sprinkler irrigation water.

Apogee Instruments upward-looking sensors have a domed diffuser and housing for improved self-cleaning from
rainfall, but active cleaning may be necessary. Dust or organic deposits are best removed using water, or window
cleaner, and a soft cloth or cotton swab. Salt deposits should be dissolved with vinegar and removed with a cloth
or cotton swab. Salt deposits cannot be removed with solvents such as alcohol or acetone. Use only gentle
pressure when cleaning the diffuser with a cotton swab or soft cloth to avoid scratching the outer surface. The
solvent should be allowed to do the cleaning, not mechanical force. Never use abrasive material or cleaner on the
diffuser.

Although Apogee sensors are very stable, nominal accuracy drift is normal for all research-grade sensors. To
ensure maximum accuracy, we generally recommend sensors are sent in for recalibration every two years,
although you can often wait longer according to your particular tolerances.

To determine if a specific sensor needs recalibration, the Clear Sky Calculator (www.clearskycalculator.com)
website and/or smartphone app can be used to indicate PPFD incident on a horizontal surface at any time of day at
any location in the world. It is most accurate when used near solar noon in spring and summer months, where
accuracy over multiple clear and unpolluted days is estimated to be ± 4 % in all climates and locations around the
world. For best accuracy, the sky must be completely clear, as reflected radiation from clouds causes incoming
radiation to increase above the value predicted by the clear sky calculator. Measured PPFD can exceed PPFD
predicted by the Clear Sky Calculator due to reflection from thin, high clouds and edges of clouds, which enhances
incident PPFD. The influence of high clouds typically shows up as spikes above clear sky values, not a constant
offset greater than clear sky values.

To determine recalibration need, input site conditions into the calculator and compare PPFD measurements to
calculated PPFD for a clear sky. If sensor PPFD measurements over multiple days near solar noon are consistently
different than calculated PPFD (by more than 6 %), the sensor should be cleaned and re-leveled. If measurements
are still different after a second test, email calibration@apogeeinstruments.com to discuss test results and
possible return of sensor(s).
Homepage of the Clear Sky Calculator. Two calculators are available: one for quantum sensors (PPFD) and one for pyranometers (total shortwave radiation). Clear Sky Calculator for quantum sensors. Site data are input in blue cells in middle of page and an estimate of PPFD is returned on right-hand side of page.
TROUBLESHOOTING AND CUSTOMER SUPPORT
Cable Length

Fifteen feet is the maximum cable length that can be built into the sensor.

Modifying Cable Length

If you required a longer cable length an “active” USB extension cable is required. Please note, the connection
between the cables must be made water tight prior to submersion.

Unit Conversion Charts

Apogee SQ-500 series quantum sensors are calibrated to measure PPFD in units of µmol m-2 s-1. Units other than
photon flux density (e.g., energy flux density, illuminance) may be required for certain applications. It is possible to
convert PPFD from a quantum sensor to other units, but it requires spectral output of the radiation source of
interest. Conversion factors for common radiation sources can be found in the Knowledge Base on the Apogee
website (http://www.apogeeinstruments.com/knowledge-base/; scroll down to Quantum Sensors section). A
spreadsheet to convert PPFD to energy flux density or illuminance is also provided in the Knowledge Base on the
Apogee website (http://www.apogeeinstruments.com/content/PPFD-to-Illuminance-Calculator.xls).
RETURN AND WARRANTY POLICY

RETURN POLICY
Apogee Instruments will accept returns within 30 days of purchase as long as the product is in new condition (to be
determined by Apogee). Returns are subject to a 10 % restocking fee.

WARRANTY POLICY
What is Covered
All products manufactured by Apogee Instruments are warranted to be free from defects in materials and craftsmanship
for a period of four (4) years from the date of shipment from our factory. To be considered for warranty coverage an
item must be evaluated by Apogee.

Products not manufactured by Apogee (spectroradiometers, chlorophyll content meters, EE08-SS probes) are covered
for a period of one (1) year.

What is Not Covered
The customer is responsible for all costs associated with the removal, reinstallation, and shipping of suspected warranty
items to our factory.

The warranty does not cover equipment that has been damaged due to the following conditions:

1. Improper installation, use, or abuse.

2. Operation of the instrument outside of its specified operating range.

3. Natural occurrences such as lightning, fire, etc.

4. Unauthorized modification.

5. Improper or unauthorized repair.

Please note that nominal accuracy drift is normal over time. Routine recalibration of sensors/meters is considered part of
proper maintenance and is not covered under warranty.

Who is Covered
This warranty covers the original purchaser of the product or other party who may own it during the warranty period.

What Apogee Will Do
At no charge Apogee will:

1. Either repair or replace (at our discretion) the item under warranty.

2. Ship the item back to the customer by the carrier of our choice.

Different or expedited shipping methods will be at the customer’s expense.
How To Return An Item
1. Please do not send any products back to Apogee Instruments until you have received a Return Merchandise
Authorization (RMA) number from our technical support department by submitting an online RMA form at
www.apogeeinstruments.com/tech-support-recalibration-repairs/. We will use your RMA number for tracking of the
service item. Call (435) 245-8012 or email techsupport@apogeeinstruments.com with questions.

2. For warranty evaluations, send all RMA sensors and meters back in the following condition: Clean the sensor’s exterior
and cord. Do not modify the sensors or wires, including splicing, cutting wire leads, etc. If a connector has been attached
to the cable end, please include the mating connector – otherwise the sensor connector will be removed in order to
complete the repair/recalibration. Note: When sending back sensors for routine calibration that have Apogee’s standard
stainless-steel connectors, you only need to send the sensor with the 30 cm section of cable and one-half of the
connector. We have mating connectors at our factory that can be used for calibrating the sensor.

3. Please write the RMA number on the outside of the shipping container.

4. Return the item with freight pre-paid and fully insured to our factory address shown below. We are not responsible for
any costs associated with the transportation of products across international borders.

Apogee Instruments, Inc.
721 West 1800 North Logan, UT
84321, USA

5. Upon receipt, Apogee Instruments will determine the cause of failure. If the product is found to be defective in terms
of operation to the published specifications due to a failure of product materials or craftsmanship, Apogee Instruments
will repair or replace the items free of charge. If it is determined that your product is not covered under warranty, you
will be informed and given an estimated repair/replacement cost.

PRODUCTS BEYOND THE WARRANTY PERIOD
For issues with sensors beyond the warranty period, please contact Apogee at techsupport@apogeeinstruments.com to
discuss repair or replacement options.

OTHER TERMS
The available remedy of defects under this warranty is for the repair or replacement of the original product, and Apogee
Instruments is not responsible for any direct, indirect, incidental, or consequential damages, including but not limited to
loss of income, loss of revenue, loss of profit, loss of data, loss of wages, loss of time, loss of sales, accruement of debts
or expenses, injury to personal property, or injury to any person or any other type of damage or loss.

This limited warranty and any disputes arising out of or in connection with this limited warranty ("Disputes") shall be
governed by the laws of the State of Utah, USA, excluding conflicts of law principles and excluding the Convention for the
International Sale of Goods. The courts located in the State of Utah, USA, shall have exclusive jurisdiction over any
Disputes.

This limited warranty gives you specific legal rights, and you may also have other rights, which vary from state to state
and jurisdiction to jurisdiction, and which shall not be affected by this limited warranty. This warranty extends only to
you and cannot by transferred or assigned. If any provision of this limited warranty is unlawful, void or unenforceable,
that provision shall be deemed severable and shall not affect any remaining provisions. In case of any inconsistency
between the English and other versions of this limited warranty, the English version shall prevail.

This warranty cannot be changed, assumed, or amended by any other person or agreement

                           APOGEE INSTRUMENTS, INC. | 721 WEST 1800 NORTH, LOGAN, UTAH 84321, USA
                            TEL: (435) 792-4700 | FAX: (435) 787-8268 | WEB: APOGEEINSTRUMENTS.COM

                                            Copyright © 2022 Apogee Instruments, Inc.
You can also read