Water Quality of Lake Mjøsa through Satellite Images: A Preliminary Study
←
→
Page content transcription
If your browser does not render page correctly, please read the page content below
Water Quality of Lake Mjøsa through Satellite
                                                      Images: A Preliminary Study

                                                            Anders Gjesdal Oliversen and Hilda Deborah

                                            Department of Computer Science, Norwegian University of Science and Technology
                                                               Teknologiveien 22, 2815 Gjøvik, Norway
arXiv:2110.10465v1 [eess.IV] 20 Oct 2021

                                                          andergol@stud.ntnu.no, hilda.deborah@ntnu.no
                                                                 https://www.ntnu.edu/colourlab

                                                 Abstract. Since around 2010, the water quality in lake Mjøsa has be-
                                                 gun to decline after an earlier successful effort to improve the water
                                                 quality (Mjøsaksjonen). In this study, we investigate the possibility of
                                                 using satellite imagery to monitor the water quality of lake Mjøsa, and
                                                 also compare the use of such an approach to current methods for mon-
                                                 itoring the lake. Using satellite images for remote sensing has layers of
                                                 complexity that were not apparent to us at first, and this paper summa-
                                                 rizes some of our findings by discussing factors of water quality, state of
                                                 the art for use of satellite imagery for water quality and some of our own
                                                 initial results. While our results where not too accurate for this prelimi-
                                                 nary study, it gives an introduction to the field and some of the methods
                                                 that may bring better results for further research. Satellite images can
                                                 play an important role in monitoring changing waters. The field is in
                                                 development and many factors of water quality may be analysed with
                                                 increasing levels of accuracy.

                                                 Keywords: Remote Sensing · Sentinel-2 · Water Quality · Mjøsa.

                                           1    Introduction

                                           About 100 000 people have Mjøsa as their source of drinking water [21], and
                                           people rely on Mjøsa for recreational purposes like swimming, sailing and fishing.
                                           Many animal species are also dependent on Mjøsa, and as the largest lake in
                                           Norway it plays an important role in the ecosystem of the area.
                                               Historically, the water quality of Mjøsa has not always been good. One of
                                           the first records to human pollution of Lake Mjøsa affecting the water quality
                                           is from 1872 [14], when sewage water released directly into Mjøsa without any
                                           form of prior cleansing treatment led to typus epidemic in Hamar that lasted 10
                                           years. Gjøvik was also struck by a similar typhus epidemic in 1931, resulting from
                                           hospital sewage released into Mjøsa [14]. From the mid 1950s and into the 1960s,
                                           toxic algae blooms came with increasing frequency and systematic monitoring of
                                           the water quality of lake Mjøsa and the tributary rivers commenced. The Mjøsa
                                           Campaign, or Mjøsaksjonen, was initiated in 1973 as an attempt to combat the
                                           pollution and save lake Mjøsa. It was a successful effort and phosphorus released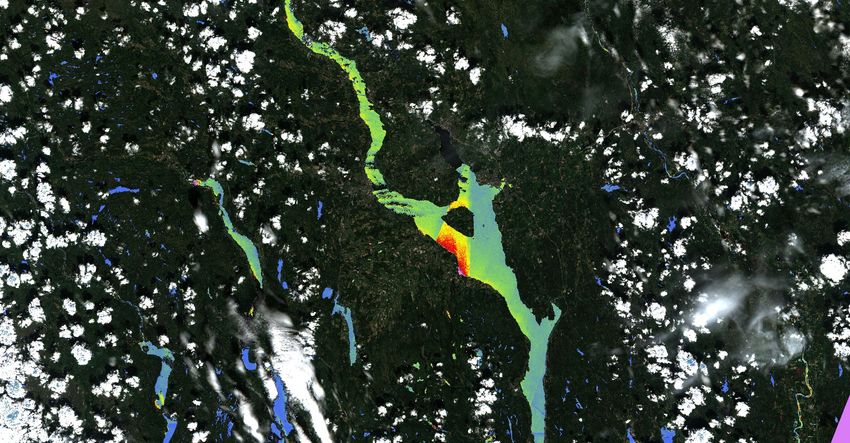
2      A. G. Oliversen and H. Deborah

into Mjøsa per year was reduced from 459 tons in 1972 to 225 tons in 1980 [14].
The condition of Mjøsa has been evaluated as “acceptable” in most of the years
after around 1990, but this started to change again around 2010. Several large
algae blooms have been reported in recent years [3,6,27], and levels of phosphorus
found in the water have been increasing [23]. A massive cyanobacteria bloom has
also been reported in 2019 [23].
    Traditionally, water quality analysis has been done through field sampling
and laboratory analysis. This approach has its limitation especially for the mon-
itoring large areas and numbers of water bodies, because the distribution of nu-
trients, algal blooms, and suspended matter are patchy [20]. In this preliminary
work, we are investigating the possibilities of using freely available Sentinel-2
images to monitor the water quality in Mjøsa. We aim to give an introduction
to the topic, as well as report the preliminary results, challenges, and lessons
learnt in this study. This article will be especially useful for readers from data
science or computer science, who do not have prior domain knowledge to work
in the topic of remote sensing for water quality.

2     Environmental Water Quality
Water quality is defined as a measure of the condition of water relative to the
requirements of one or more species and/or to any human need or purpose [8].
The U.S. Environmental Protection Agency also provides a definition for water
quality criteria as the levels of water quality expected to render a body of water
suitable for its designated use [26]. It was further elaborated that the criteria
are based on specific levels of pollutants that would make the water harmful
for a variety of purposes. From both definitions, we know that if we are to
assess water quality, we need to determine and specify the purpose. In this work,
we are specifically working with environmental water quality and, therefore,
are concerned with evaluating environmental water quality indicators. From this
point, we will use the term water quality to specifically the environmental one,
and not relating it to concerns of consumption or domestic/ industrial uses.

2.1   Eutrophication and Trophic State Index (TSI)
Nutrient pollution in water, i.e., when too many nutrients are added to the body
of water, will cause excessive growth of algae. Algae and plants are dependent
on nitrogen and phosphorus for growth, and these nutrients are usually scarce in
natural environments. High amounts of nitrogen and phosphorus can make algae
and water plants grow faster than the ecosystem can handle [15,19]. Therefore,
it is important to monitor eutrophication. The word eutrophication comes from
the Greek eutrophos, meaning “well-nourished” [10]. When a body of water is
enriched with nutrients and minerals it is described as the eutrophication of that
body of water. Phosphorus has long been seen as the main nutrient controlling
freshwater productivity, while controlling nitrogen has been seen as more impor-
tant for coastal waters. Some recent papers argue that control of both nutrients
is required to manage eutrophication in both freshwater and coastal waters [16].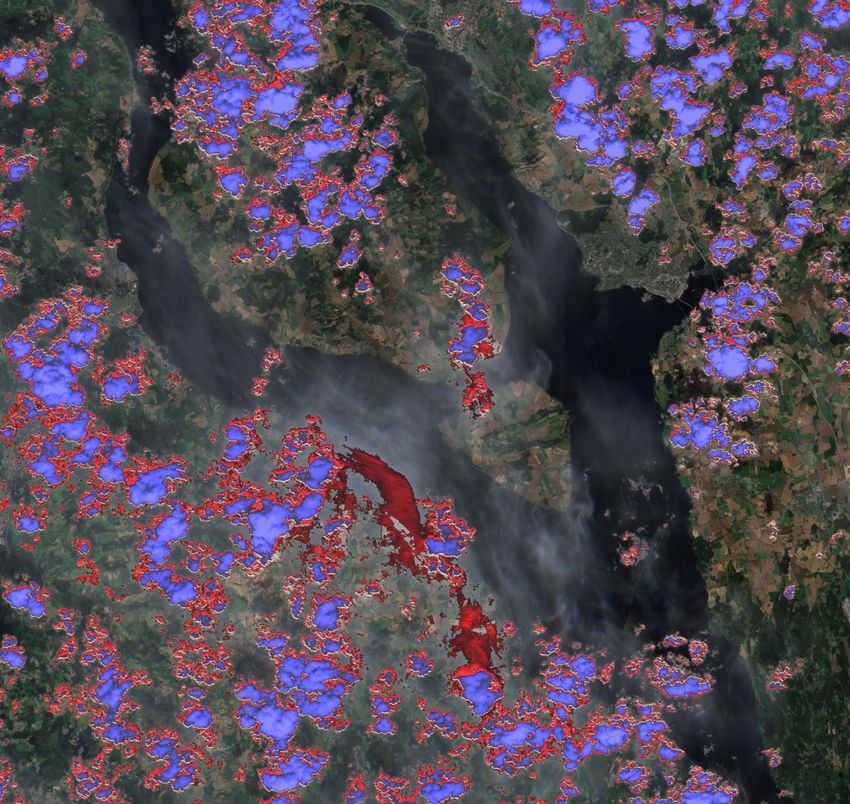
Water Quality of Lake Mjøsa through Satellite Images: A Preliminary Study          3

    Trophic means something of or relating to nutrition [11], and the Trophic
State Index (TSI) is a system used to rate water bodies based on their nutritional
state [9]. Water bodies with low levels of nutrients will have low amounts of bio-
logical activity, while those with high levels of nutrients will have high amounts of
biological activity. TSI rates water bodies as oligotrophic, mesotrophic, eutrophic
or hypereutrophic depending on the amount of dissolved nutrients in the water.
Where oligotrophic water bodies have the least amount of biological activity,
and hypereutrophic have the most. The low biological activity in oligotrophic
lakes means they have low algal production, clear waters with good visibility
and high drinking water quality.

2.2   On case 1 and case 2 waters
A distinction is made between case 1 and case 2 waters because they have dif-
ferent optical properties and, consequently, different algorithms are required to
work with them. Case 1 waters are typically open oceans or oligotrophic lakes.
Case 2 waters are more complex and are typically coastal waters and lakes.
However, while still in use, the case 1 and case 2 separation may be too much
of a simplification and it might be better if the optical properties of lakes are
determined on an individual basis [13].

2.3   Water quality indicators
Indicators for determining water quality are many and can be grouped into
biological, chemical, and physical indicators. However, only a part of those indi-
cators will be relevant for optical sensors. The following are bio-optical indicators
or properties that can be monitored by means of remote sensing:

Chlorophyll-a (chl-a) is one of the most common indicators of water quality
   looked for with remote sensing. It is the primary indicator of phytoplank-
   ton production, and phytoplankton blooms caused by eutrophication can be
   problematic. Chl-a absorbs light strongly at the blue (near 440 nm) and the
   red (near 670 nm) parts of the light spectrum [12]. All green plants and
   algae contain chl-a. So while analysing chl-a content in a body of water can
   be useful, it is not very specific.
Phycocyanin is a pigment unique to cyanobacteria and has distinctive optical
   features around 620-630 nm [12]. Cyanobacteria (”blue-green algae”) toxins
   can cause severe health issues [25,7]. Cyanobacteria also contain chl-a, but
   looking for chl-a is not a good way to identify cyanobacteria since all phy-
   toplankton contains chl-a. Cyanobacteria blooms have been problematic in
   Mjøsa, and it would be useful to be able to distinguish between cyanobacteria
   and other algae.
Total Suspended Solids (TSS), Colored Dissolved Organic Matter
   (CDOM), and turbidity all have an impact on reflectance. This makes
   them feasible to measure with remote sensing, but if the reflectance changes
   the atmospheric correction and algorithms for analysing the water may also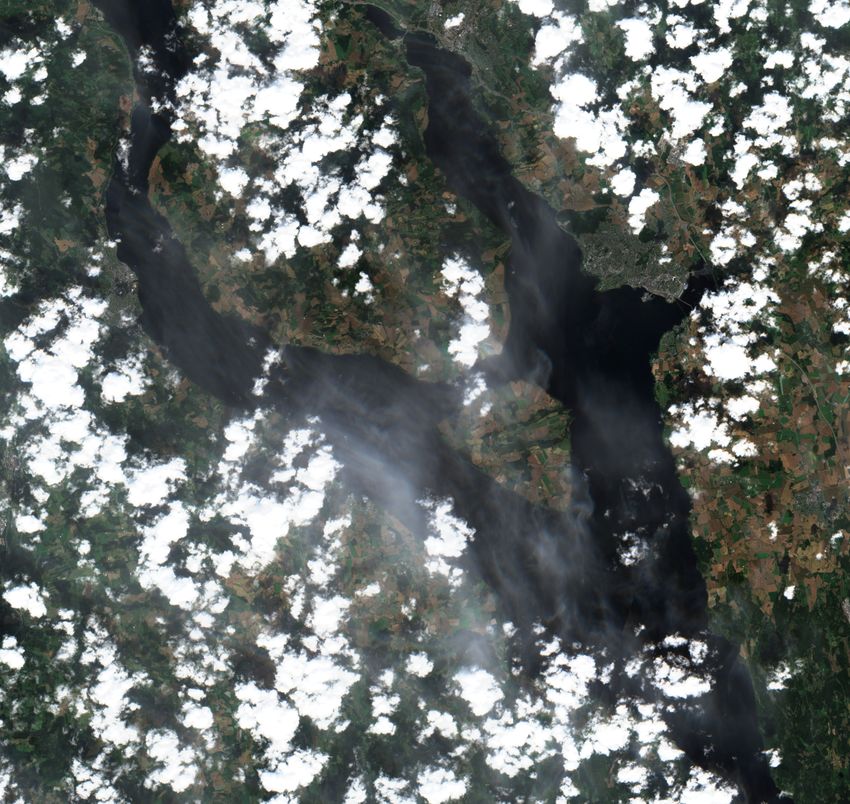
4      A. G. Oliversen and H. Deborah

  need to be changed [12]. TSS, CDOM and turbidity all impact the clarity
  of water in different ways, and different methods would be used to measure
  each of them. Clear water is generally an indicator of healthy water, and a
  sudden decrease in clarity in a previously clear body of water (like Mjøsa)
  may indicate that something is wrong [5].
Aquatic plants. Changing plant biomass can impact a lake’s biological com-
  munities, water, sediment chemistry, and nutrient cycling. Eutrophication
  can reduce the amount of (submerged) aquatic plants due to reduced light
  penetration. Eutrophication can also stimulate aquatic plant growth until
  they become a nuisance present in excessive amounts. A number of indices
  have been developed to detect aquatic plants, but it was concluded that the
  work done so far is incompatible and inconsistent [12]. The problem is not
  to detect if there are plants in the water, but trying to differentiate between
  them and identify problematic plant species. Some plants may be native to
  a body of water and are no cause for concern, while invasive species of water
  plants can be very problematic.

2.4   Water quality in Mjøsa in recent years

The Mjøsa Campaign initiated in 1973 focused on reducing phosphorus in Mjøsa,
because the access to phosphorus in Mjøsa is the limiting growth factor for algae
in the lake. Recently, however, not only the levels of phosphorus that have been
increasing but also the levels of nitrogen in the water [23]. Nitrogen from Mjøsa
will eventually end up in Oslofjorden via Glomma, and can potentially have a
larger negative impact on water quality in the coastal waters there [14].
    A recently published report [1] found the main sources contributing phospho-
rus to lake Mjøsa to be agriculture and sewage. Agriculture generally contributes
phosphorus with low bioavailability, while sewage contributes phosphorus with
high bioavailability. Bioavailable phosphorus is more easily transported in the
water and is more accessible for algae growth. Sewage is estimated to contribute
50-75% of the total amount of bioavailable phosphorus in the rivers running into
Mjøsa. Concentration of E. coli have also been found to be very high in many of
the tributary rivers to Mjøsa in recent years [1]. This indicates that the water
quality in the rivers is affected by sewage and livestock manure. E. coli concen-
trations were found to be above the set limit for use in soil irrigation in many
of these rivers [1].
    From 1972 to 2020 the mean temperature in the upper water layer of Mjøsa
for the period June-October has increased by 2.0 °C, and the maximum temper-
ature has increased by 3.3 °C [23]. Higher temperature in the lake could lead to
more eutrophic conditions. There has also been to be more flooding in the region
in recent years and this leads to higher total loads of phosphorus in Mjøsa and
the tributary lakes. Heavy rain followed by warm weather results in favourable
conditions for algal growth, and more of this kind of weather is expected in the
region in the future due to climate change. This will make it extra challenging
to reduce the pollution of lake Mjøsa in the coming years.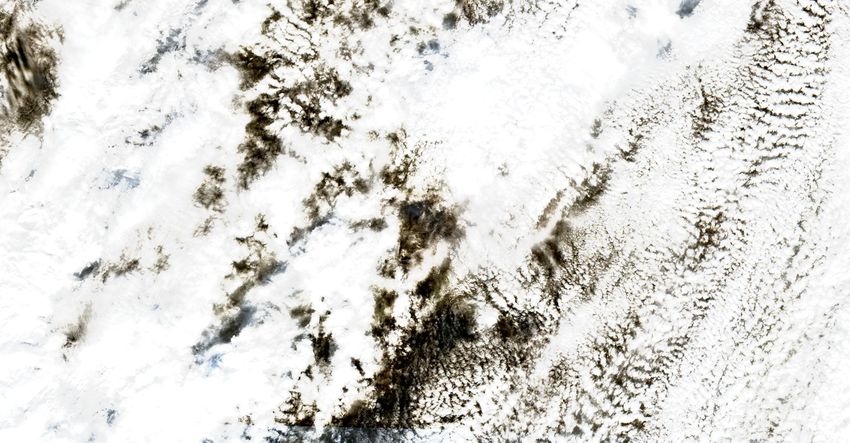
Water Quality of Lake Mjøsa through Satellite Images: A Preliminary Study         5

3     Materials and Methods
In this section we provide details regarding data and methods used in this study,
where we focus on lake Mjøsa. Relating to the different aspects that have been
described in Section 2, the characteristics of Mjøsa are as follows. Mjøsa’s natural
state is that of an oligotrophic lake [14]. However, regarding the type of waters,
Mjøsa is probably closer to the case 2 type of waters due to the ongoing pollution.

3.1   Data
Sentinel-2 images Sentinel-2 is part of the Copernicus programme by The
European Space Agency (ESA) and environmental data from the programme has
free, full and open access to all users, and we use the data for this preliminary
study. Data from other satellites could have been used as well, but working with
different sensors will further complicate the work and was decided against for this
preliminary study. Sentinel-2 is a constellation of two identical satellites in the
same orbit developed and operated by the European Space Agency. Sentinel-2A
launched 23rd June 2015 and Sentinel-2B launched 7th March 2017. The revisit
time every 1-5 days, but more frequent at high altitudes like Norway and there
is Sentinel-2 data of lake Mjøsa every 1-2 days. The satellites have 13 spectral
bands with spatial resolutions of 10m, 20m and 60m.

In-situ measurement NIVA has been monitoring the water quality of Mjøsa
since 1972. Physical data gathering is done on location by NIVA researchers
using various equipment and samples are brought to laboratories for analysis.
Monthly tests are done in the months of May to October. NIVA shared some of
the data gathered in 2016-2020 with us for comparison with satellite data. The
data was on turbidity, chlorophyll-a and total organic carbon (TOC) gathered
from four stations in Mjøsa, see Fig. 1.

3.2   Method
EO Browser is a cloud platform allowing the user to easily access high-
resolution data from many different satellites with almost no loading time, and
it is possible to do simple scripting directly in EO Browser. Analysing the data
directly in EO browser would save a lot of time and storage space compared to
downloading data from sources like Copernicus and using other tools for anal-
ysis. The data is big, and if analysis is to be done on a regular basis the time
and space saved with a tool like EO Browser would be significant. Although
EO Browser can be a great tool, there were a few challenges with using it for
analysing water quality that we found during this study:
Image stitching EO Browser stitches multiple images together. This effect is
   hardly visible in true colour images, but creates problems with overlapping
   areas when processing the data. There is a stitch that often happens in the
   middle of Mjøsa, making data in that area useless for analysis.
6      A. G. Oliversen and H. Deborah

Fig. 1: Satellite image of Mjøsa with NIVA stations for monitoring water quality.

Limited scripting tool EO Browser has good scripting capabilities for manip-
   ulating the different spectral bands, but usually simple tasks like extracting
   numerical values can be difficult.
Sen2Cor Atmospheric Correction Only Sentinel-2 data with the Sen2Cor
   atmospheric correction is available directly in EO Browser. This will be fine
   in most cases if analysing land areas, but it is not regarded as a good atmo-
   spheric correction to use for analysing water quality. This will be explained
   in more details later in this section.

Water quality scripts There are several Sentinel-2 scripts available for water
analysis in the Sentinel Hub custom scripts repository, that can be used on EO
Browser. Below are the ones we used.

Se2WaQ - Sentinel-2 Water Quality Script [24,17] was one of the scripts
   we found to be promising in the initial stages of the project and decided
   to use for comparison with in situ data. Se2WaQ can displays the spa-
   tial distribution of six indicators of water quality, i.e., the concentration
Water Quality of Lake Mjøsa through Satellite Images: A Preliminary Study         7

  of Chlorophyll-a (chl-a), the density of cyanobacteria, turbidity, colored dis-
  solved organic matter (CDOM), Dissolved organic carbon (DOC), and Water
  color. Of these indicators, however, we only had in situ data for chl-a and
  turbidity to compare with.
APA - Aquatic Plants and Algae Custom Script Detector [18] detects
  aquatic plants and algae in water bodies. We did not have in situ data from
  NIVA to directly compare with regarding these factors. Thus, we compared
  the satellite data with periods of algal blooms reported in the news.

3.3   Challenges in the remote sensing of inland waters
Previously, we have shortly touched upon the challenges we encountered while
using the EO Browser. There are, however, important considerations that are
specific to the remote sensing of inland waters. Below we elaborate in more
details the two main challenges.

Atmospheric correction is an essential step before analysing satellite data.
We have to remove the influence of atmosphere and surface to obtain the re-
flectance of interest, i.e., of the water itself. One of the atmospheric phenomena
that complicates the atmospheric correction for inland and coastal waters is the
adjacency effect, i.e., where scattering in the atmosphere contaminates water pix-
els with radiation from the surrounding land [12]. It has also been shown that all
atmospheric correction algorithms for Sentinel-2A have high uncertainties [28].
In the evaluation, Polymer and C2RCC achieved the lowest mean square differ-
ences. Sen2Cor, which is the default atmospheric correction for Sentinel-2 and
the one we used, was said to have generally poor performance for water bodies,
but better performance for inland waters than for coastal waters.

Cloud detection is also essential since clouds often fully or partially obscure
the data when using satellite images. Clouds obscuring the entire image is a
common occurrence with satellite data and this is one of the greatest challenges
when working with satellite images. If clouds only partially obscure the data,
they only need to be detected and masked out so they do not interfere with the
usable data. Cloud shadows can also distort the data and should be masked out.
There is radar satellite imagery available and this can be a solution for certain
uses. Radar can see through clouds, see Fig. 2, and for example detect larger
floods or ice cover. Unfortunately radar cannot be used to analyse parameters
of water quality. So this is ruled out as a potential solution in our current study.
There is a fine balance in cloud detection between failing to remove contami-
nated data and removing usable data. A recent study compared cloud detection
algorithms for Sentinel-2 and found that the LaSRC algorithm was the best one
for finding clouds and Tmask algorithm was the best for finding shadows [22].
Improvements in clouds detection are being made, but for now it is probably
best if a human looks over to check if the cloud detection was successful. In this
study, we use the Braaten-Cohen-Yang cloud detector [2] available from Sentinel
8 A. G. Oliversen and H. Deborah
(a) Sentinel-2 image
(b) Radar image
Fig. 2: Images taken over Mjøsa on 30th September 2019. Clouds completely
cover the Sentinel-2 image but the radar image of the same location on the same
date completely sees through the clouds.
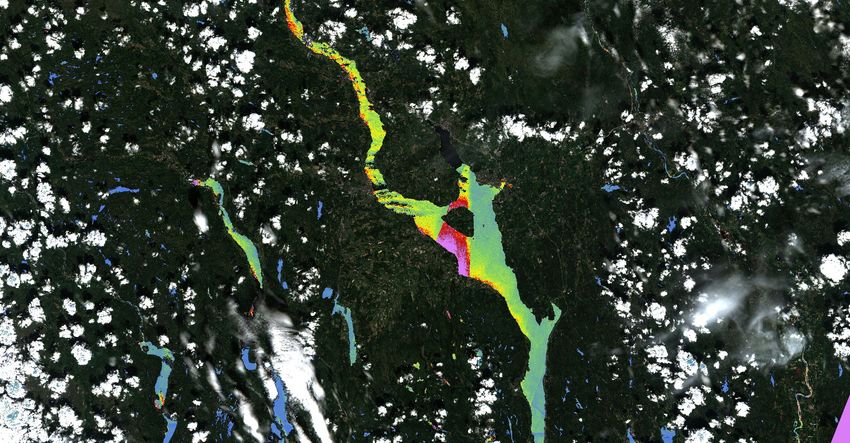
Hub. In the example in Fig. 3, a cloudy image is to the left and to the right is
the same image with the Braaten-Cohen-Yang cloud detector applied. Note that
thin cirrus clouds and cloud shadows are not detected with this algorithm, but
they would distort the data and this satellite image would not be suitable for
analysing the water in the image.
4 Results
Getting a good match between the satellite images and in situ data is a common
problem. For some uses it does not matter if there is a few days, or even weeks,
difference between the satellite and in situ data. But the conditions in water can
change fast, so a close match between the data is important. We got data from
NIVA at 55 different dates, and we only found eight suitable satellite images
(not obscured by clouds) to match with the NIVA data. Sentinel-2 covers Mjøsa
every 1-2 days, and only two of the eight dates match exactly. The rest had a
one day difference between the satellite and NIVA data.Water Quality of Lake Mjøsa through Satellite Images: A Preliminary Study 9
(a) Original cloudy image (b) Cloud detected image
Fig. 3: Result of cloud detection from a satellite image using Braaten-Cohen-
Yang detector. Thick cloud is segmented as purple pixels, while the thin ones
with red colors.
It should also be noted that the conditions of the water have great variations
within a small area. If several samples are taken to look for concentration of
algae within the same area, there can be a significant difference between the
samples. This is one of the reasons the overview satellite imagery can give of a
body of water can be so useful, but it also makes it hard to establish a ground
truth reference for the satellite imagery.
4.1 Se2WaQ
The results from Se2WaQ is visual, with different colours marking the severity
of the water quality parameters like turbidity and chl-a. The NIVA data is in
numerical values for this parameters gathered at the different stations. The fol-
lowing is an example of NIVA data from the 9th of July 2019, refer to Fig. 1 for
the station location:
– M071 - Turbidity: 7,25398 – Chl-a: 1,7
– M072 - Turbidity: 7,39289 – Chl-a: 2,3
– M073 - Turbidity: 0,9617 – Chl-a: 3
– M074 - Turbidity: 0,55414 – Chl-a: 2,4
This was compared to satellite data from 10th of June, see Fig. 4. Like the
NIVA data, Se2WaQ found more turbidity in the upper areas of Mjøsa near the
M071 and M071 stations. But the difference between those stations and values
from the M073 and M074 stations were not as strong in the Se2WaQ results.
There was little to no correlation between the chl-a values in the 9th of July
NIVA data and the 10th of July results from Se2WaQ.10 A. G. Oliversen and H. Deborah
(a) Turbidity (b) Chl-a
Fig. 4: Turbidity and Chl-a levels obtained using Se2WaQ script over Mjøsa on
10th June 2019.
These results are typical of the comparisons between the NIVA data and the
Se2WaQ results. Sometimes there is a fairly close correlation, and sometimes no
correlation at all. There is not much data to compare with, but what correlation
there is between the data is so weak that it might be coincidental. There is also
a chance that the weak correlation is a result of the NIVA data and the satellite
data being taken at different times, but Se2WaQ showed no improvement on the
two times when NIVA and satellite data was from the same day.
Se2WaQ is done directly in EO Browser and uses the Sen2Cor, which we
now know is not the best atmospheric correction for analysing water quality.
With this knowledge, and results, it seems fair to conclude that Se2WaQ in EO
Browser is probably not suitable for estimating water quality in Mjøsa.
4.2 APA
With the APA script in EO Browser we tested the scripts on dates of reported
algal blooms in Mjøsa. One such bloom happened in July 2021, and the script
showed a clear increase in algae activity leading up to the bloom, see Fig. 5.
The algae bloom was reported near Ringsaker, and was particularly severe by
Brumunddal. But the APA script seemed to show the same high algae activity for
almost all of Mjøsa. This is typical for our experience with the APA script. There
is some correlation between the results from the scripts and dates of reported
algae blooms, but the script does not show higher activity in the specific areas
of Mjøsa where the algal blooms are reported.
The APA script also only gives very generic results, since it looks for algae
and water plants in general. It has no information about what type of algaeWater Quality of Lake Mjøsa through Satellite Images: A Preliminary Study 11
Fig. 5: APA script result over Mjøsa on 16th July 2021.
or plant is being detected. The APA scripts also detects high activity at times
when there are no reports of algal blooms. This may be false positives, or that
something other than algae is detected. It also occasionally detects high algal
or water plant activity in May, when the ice on Mjøsa has just melted and it is
very unlikely that there would be any such activity yet.
APA shows a little promise for monitoring algal blooms in Mjøsa, but is
unreliable with its occasional detection of unlikely high algal or water plant
activity in May. When it does work the results are imprecise and generic, and
APA is probably not a reliable tool for studying algal activity in Mjøsa.
5 Conclusion
In this preliminary study we have gathered information about the usage of satel-
lite imagery for analysing water quality to get an overview of the state of the art
of the field. Lake Mjøsa was used as a case study and we compared our findings
with in situ measurements provided by NIVA. We attempted to analyse water
quality directly within EO Browser using the Se2WaQ and APA scripts. Neither
of them performed particularly well. The Sen2Cor atmospheric corrected data
available in EO Browser is not very suitable for analysing water quality and
it is unlikely that Se2WaQ and APA, or any algorithms used directly in EO
Browser, can be used to study the water quality of Mjøsa with a acceptable level
of accuracy.
Quick analysis of water quality with tools like EO Browser or Google Earth
Engine is probably still something for the future. The main problem is the need
for specialized atmospheric correction when working with different types of wa-
ter, but it is possible that data with types of different atmospheric correction will12 A. G. Oliversen and H. Deborah
be made available directly within these already powerful browser applications
as they are under continuous development. For now, the best approach when
wanting to analyse water quality is to download the full data, do atmospheric
correction suitable to the type of water studied and analyse the data with tools
like The European Space Agency’s SNAP [4].
When state of the art approach is used it should be possible to attain results
that are useful. More work still needs to be done to increase the accuracy when
studying water quality with satellite imagery, but progress is being made.
Mjøsa is changing and needs to be closely monitored. Satellite imagery can
give a great overview of Mjøsa and complement in situ measurements. This kind
of overview is important because water conditions may have great variations
within a small area and a sample does not necessarily represent the condition
of the area. In situ measurements of water quality are also time consuming and
labor intensive, and satellite imagery can provide information about the water
quality on days when in situ measurements are not done.
It should also be noted that few lakes in Norway, if any, have been as closely
monitored as Mjøsa has been since the start of Mjøsaksjonen. This means there
is a lot of data on Mjøsa that the satellite data can be compared with, and as
such it is a suitable starting point for monitoring Norwegian lakes. But many
lakes in Norway are in hard-to-reach locations and the water quality is only
tested every 2-3 years. These lakes would also greatly benefit from the increased
monitoring of water quality that satellite imagery can provide.
6 Acknowledgment
Authors would like to thank Therese Harvey from NIVA Denmark for the in-
valuable input and discussion, and also for providing field measurement data
collected by NIVA used in this study.
References
1. Bechmann, M., Thrane, J.E., Kværnø, S., Turtumøygard, S.: Eutrofiering av
Mjøsa: Kartlegging av årsaksforhold og kilder til fosfor i ni delnedbørfelt. Tech.
Rep. 7(58), Norsk Institutt for Bioøkonomi (NIBIO) (2021)
2. Braaten, J.D., Cohen, W.B., Yang, Z.: Automated cloud and cloud shadow iden-
tification in Landsat MSS imagery for temperate ecosystems. Remote Sensing of
Environment 169, 128–138 (2015). https://doi.org/10.1016/j.rse.2015.08.006
3. Børresen, M.F., Næsheim, A.: Bekymringsfull utvikling i Mjøsa. https://www.nrk.
no/innlandet/bekymringsfull-utvikling-i-mjosa-1.11652660. Last accessed
6 Sep 2021. (Apr 2014)
4. European Space Agency (ESA): SNAP Toolbox. https://step.esa.int/main/
toolboxes/snap/. Last accessed 2 Sep 2021
5. Fondriest Environmental, Inc.: Turbidity, total suspended solids & wa-
ter clarity. Fundamentals of environmental measurements. https://www.
fondriest.com/environmental-measurements/parameters/water-quality/
turbidity-total-suspended-solids-water-clarity/. Last accessed 27 Aug
2021Water Quality of Lake Mjøsa through Satellite Images: A Preliminary Study 13
6. Hellem-Hansen, V.L.: Advarer folk mot å bade i Mjøsa. https://www.nrk.no/
innlandet/advarer-folk-mot-a-bade-i-norges-storste-innsjo-1.14638823.
Last accessed 6 Sep 2021. (Jul 2019)
7. Hilborn, E.D., Roberts, V.A., Backer, L., DeConno, E., Egan, J.S., Hyde, J.B.,
Nicholas, D.C., Wiegert, E.J., Billing, L.M., DiOrio, M., Mohr, M.C., Hardy, F.J.,
Wade, T.J., Yoder, J.S., Hlavsa, M.C.: Algal bloom–Associated disease outbreaks
among users of freshwater lakes —United States, 2009–2010. Morbidity and Mor-
tality Weekly Report (MMWR) 63(01), 11–15 (2014)
8. Johnson, D.L., Ambrose, S.H., Bassett, T.J., Bowen, M.L., Crummey, D.E., Isaac-
son, J.S., Johnson, D.N., Lamb, P., Saul, M., Winter-Nelson, A.E.: Meanings of
environmental terms. Journal of Environmental Quality 26(3), 581–589 (1997).
https://doi.org/10.2134/jeq1997.00472425002600030002x
9. Lake County Wateratlas (LCWA): Learn more: Trophic State Index (TSI).
http://www.lake.wateratlas.usf.edu/library/learn-more/learnmore.aspx?
toolsection=lm_tsi. Last accessed 20 Aug 2021.
10. Merriam-Webster: Eutrophication definition. https://www.merriam-webster.
com/dictionary/eutrophication. Last accessed 20 Aug 2021.
11. Merriam-Webster: Trophic definition. https://www.merriam-webster.com/
dictionary/trophic. Last accessed 20 Aug 2021.
12. Mishra, D.R., Gitelson, A.A., Ogashawara, I. (eds.): Bio-optical modeling and re-
mote sensing of inland waters. Elsevier (2017)
13. Mobley, C., Stramski, D., Bissett, P., Boss, E.: Optical modeling of ocean waters:
Is the case 1 - case 2 classification still useful? Oceanography 17(2), 60–67 (2004).
https://doi.org/10.5670/oceanog.2004.48
14. Nashoug, O.: Vannkvaliteten i Mjøsa, før og nå. Mjøsovervåkingen gjennom 25 år.
Tech. rep., Styringsgruppa for overvåking av Mjøsa (1999)
15. National Oceanic and Atmospheric Administration. U.S. Department of
Commerce: What is eutrophication? https://oceanservice.noaa.gov/facts/
eutrophication.html. Last accessed 20 Aug 2021.
16. Paerl, H.W.: Controlling eutrophication along the freshwater–marine continuum:
Dual nutrient (N and P) reductions are essentialß. Estuaries and Coasts 32(4),
593–601 (2009). https://doi.org/10.1007/s12237-009-9158-8
17. Potes, M., Rodrigues, G., Penha, A.M., Novais, M.H., Costa, M.J., Salgado, R.,
Morais, M.M.: Use of Sentinel-2 – MSI for water quality monitoring at alqueva
reservoir, portugal. Proceedings of the International Association of Hydrological
Sciences 380, 73–79 (2018). https://doi.org/10.5194/piahs-380-73-2018
18. Péliova, A., Garcia-Lozano, C., Sitjar, J.: Aquatic plants and algae cus-
tom script detector (APA script). https://custom-scripts.sentinel-hub.com/
sentinel-2/apa_script/. Last accessed 31 Aug 2021
19. Schindler, D.W.: Recent advances in the understanding and management
of eutrophication. Limnology and Oceanography 51(1part2), 356–363 (2006).
https://doi.org/10.4319/lo.2006.51.1 part 2.0356
20. Song, K., Li, L., Li, S., Tedesco, L., Hall, B., Li, L.: Hyperspectral remote sensing
of total phosphorus (TP) in three Central Indiana water supply reservoirs. Water,
Air, & Soil Pollution 223(4), 1481–1502 (2011). https://doi.org/10.1007/s11270-
011-0959-6
21. Stuen, O.H.: Fakta om Mjøsa. Vassdragsforbundet for Mjøsa med tilløpselver.
https://www.vassdragsforbundet.no/fakta-om-mjosa/. Last accessed 31 Aug
202114 A. G. Oliversen and H. Deborah
22. Tarrio, K., Tang, X., Masek, J.G., Claverie, M., Ju, J., Qiu, S., Zhu, Z., Woodcock,
C.E.: Comparison of cloud detection algorithms for Sentinel-2 imagery. Science of
Remote Sensing 2, 100010 (2020). https://doi.org/10.1016/j.srs.2020.100010
23. Thrane, J.E., Økelsrud, A., Skjelbred, B., Ranneklev, S.B., Håll, J., Kile, M.R.:
Tiltaksorientert overvåking i vannområde Mjøsa. Årsrapport for 2020. Tech. Rep.
7622-2021, Norwegian Institute for Water Research (NIVA) (2021)
24. Toming, K., Kutser, T., Laas, A., Sepp, M., Paavel, B., Nõges, T.: First experiences
in mapping lake water quality parameters with sentinel-2 MSI imagery. Remote
Sensing 8(8), 640 (2016). https://doi.org/10.3390/rs8080640
25. U.S. Environmental Protection Agency: Epidemiology & health
effects of cyanobacteria. https://www.epa.gov/water-research/
epidemiology-health-effects-cyanobacteria. Last accessed 27 Aug 2021
26. U.S. Environmental Protection Agency: Terms of environment: Glossary, abbrevi-
ations, and acronyms. Tech. Rep. USEPA 175-B-94-105 (1994)
27. Vogt, L.F., Rognstad, H.H.: Forbyr bading i Norges største
innsjø. https://www.nrk.no/innlandet/stenger-badesteder-_
-frarader-bading-i-mjosa-etter-funn-av-blagronne-alger-1.15574349.
Last accessed 6 Sep 2021. (Jul 2021)
28. Warren, M.A., Simis, S.G.H., Martinez-Vicente, V., Poser, K., Bresciani, M.,
Alikas, K., Spyrakos, E., Giardino, C., Ansper, A.: Assessment of atmospheric
correction algorithms for the Sentinel-2A MultiSpectral Imager over coastal
and inland waters. Remote Sensing of Environment 225, 267–289 (2019).
https://doi.org/10.1016/j.rse.2019.03.018Reviews received from NIKT 2021 (Rejection) The manuscript was submitted to the 33rd Norwegian ICT Conference for Re- search and Education - NIKT 2021 (NIK track). The following texts are the reviews, verbatim and only reformatted for ease of reading from an email for- mat. Review 1 Relevance for NIK SCORE: 2 (within scope) Originality SCORE: 2 (high) Readability SCORE: 1 (good) Technical quality SCORE: 1 (good) Overall evaluation SCORE: 2 (accept) Text: This paper describes various ways of analysing satellite images or lake Mjøsa to identify markers of water quality. The paper is clear and well presented. There should be a clarification that this is about image analysis early on in the paper or even in the title, as it is, I was unsure how this was relevant some way into the paper. This was however resolved later. It is interesting to see that a field with so much potential has this many un- explored topics. Looking forward to see this project progress. Review 2 Relevance for NIK SCORE: 2 (within scope) Originality SCORE: 1 (medium) Readability SCORE: 1 (good) Technical quality SCORE: -2 (very poor) Overall evaluation SCORE: -1 (weak reject) Text: This paper describes using existing software and algorithms to quantify water quality in Mjøsa. The paper provides a good background of water quality measurements, and the attributes measured. Little related work in detecting algal blooms from satellite images is described, and the methodology is not compared to the state of the art.
The novelty and contribution of the paper is not described clearly.

No statistical evaluation has been performed on the results, so no clear con-
clusion is given.

Review 3
Relevance for NIK      SCORE: -1 (out of scope)
Originality            SCORE: 0 (low)
Readability            SCORE: 2 (excellent)
Technical quality      SCORE: 1 (good)
Overall evaluation     SCORE: -2 (reject)
Text:
This is a well-written paper on the possibilities of usingsatellite images to mea-
sure different kinds of pollution, and the algal and Cyaanobacterial blooming
effects in lakes.

The practical qualitative isues are very well described. In fact they are so well
described that the paper is very engaging.

But there is no statistical (or deterministic) framework described for describing
potential solutions. Instead, one particular solution based on simple scripting is
used, possibly becsue thsi is common in the geo-spatial imaging literature.

There is no algorithm mentioned. There is no signal processing described. Po-
tential problems are mentioned, but without explaiining why they cannot be
overcome. For example, stitching of images is described as aproblem. But it
seems to this reviewer that once we know that stitching is present in an individ-
ual image, we can design and run algorithms.

There is no emphasis on designing algorithms. Instead, the paper merely re-
ports what results from a standard scripting process.

Otherwise, the paper is very informative on the basic problem, using easy to
understand language.
You can also read