USING SNOW URINE SAMPLES TO ASSESS THE IMPACT OF WINTER TICKS ON MOOSE CALF CONDITION AND SURVIVAL - Alces
←
→
Page content transcription
If your browser does not render page correctly, please read the page content below
USING SNOW URINE SAMPLES TO ASSESS
THE IMPACT OF WINTER TICKS ON MOOSE
CALF CONDITION AND SURVIVAL
Daniel Ellingwood1, Peter J. Pekins1, and Henry Jones2
Department of Natural Resources and the Environment, University of New Hampshire, Durham,
1
NH, 03824, USA; 2Maine Department of Inland Fisheries and Wildlife, Bangor, ME, 04401, USA.
ABSTRACT: Snow urine samples collected in northern New Hampshire, USA were used to mea-
sure urea nitrogen (UN) and creatinine (C) content to develop ratios for tracking the nutritional
restriction of individual moose (Alces alces) through winter (2014–2017), inclusive of the adult
winter tick (Dermacentor albipictus) engorgement period. Samples (n = 215) were collected from
55 moose (38 calves, 17 cows) on a twice monthly schedule from late January through snowmelt or
calf mortality (March – early April). Early winter UN:C ratios from cows, surviving calves, and
calves that ultimately died from infestation of winter ticks were similar and reflected a normal win-
ter diet low in protein. A heightened UN:C ratio (> 3.5 mg/dL) was measured in March which
aligned with peak feeding by adult winter ticks, and presumably reflected accelerated protein deficit
associated with blood loss. This increase was not observed population-wide despite shared habitat,
occurring only in calves with mortal weight loss and anemia associated with heavy winter tick
infestation. Measurement of UN:C ratios from snow urine samples proved an effective method to
measure the temporal impact of winter tick infestation, and March samples can support other met-
rics used to estimate calf mortality.
ALCES VOL. 55: 13–21 (2019)
Key words: creatinine, epizootic, New Hampshire, moose, nutritional restriction, snow urine, urea
nitrogen, winter ticks
New Hampshire has experienced at least during an epizootic is determined by their
5 winter tick (Dermacentor albipictus) epi- relative condition (i.e., body weight, fat
zootics (> 50% calf mortality) in the last stores) and the severity of tick infestation as
decade, an unprecedented rate of occurrence it relates to metabolic impacts, including
(Musante et al. 2010, Bergeron et al. 2013, blood loss, protein deficiency, and subse-
Jones et al. 2019). Concurrent with this quent weight loss (Samuel 2004, Musante
heightened frequency of epizootics, New et al. 2007, Ellingwood 2018). As such, mon-
Hampshire’s moose (Alces alces) population itoring the condition of calves through winter
has declined ~45% over the past 15 years and spring should provide insight into the rel-
(NHFG 2015). The cause of this decline in ative and temporal influence of tick loads on
northern New Hampshire is the negative metabolic imbalance, survival, and produc-
influence of winter ticks on calf survival tivity. Measurement of urea nitrogen from
which can be < 30% annually, and associated urine samples in snow serves as an informa-
lower productivity of yearling and adult cows tive measure of individual condition, reflect-
(Musante et al. 2010, Jones et al. 2017, 2019). ing muscle tissue catabolism in animals with
The fate of moose calves (8–12 months old) an otherwise low-protein diet (Seal et al.
13
SNOW URINE SAMPLING – ELLINGWOOD ET AL. ALCES VOL. 55, 2019
1972, Kirkpatrick et al. 1975, Bahnak et al. STUDY AREA
1979). Radio-marked calves provide for a The study area (Berlin) is located within
unique opportunity to monitor and assess Coos County and includes sections of
specific physiological parameters from indi- Wildlife Management Units (WMU) B, C1,
viduals with known fate through the peak and C2 in the towns of Berlin, Milan,
mortality period associated with winter tick Dummer, Success, Cambridge, Millsfield,
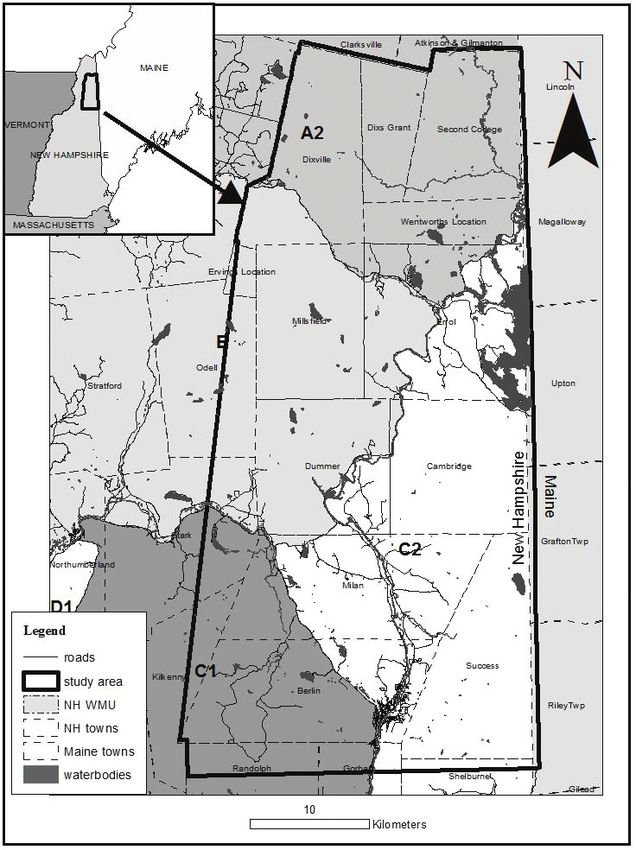
parasitism. Stark, and Second College Grant (Fig. 1).
Fig.1. Location of the study area in Wildlife Management Units A2, B, C1, and C2 in Coos County,
New Hampshire, USA.
14ALCES VOL. 55, 2019 SNOW URINE SAMPLING – ELLINGWOOD ET AL.
The landscape is bisected by the Androscoggin 2017). Moose were fitted with either VHF
River and is relatively mountainous, bor- (n = 76; M2610B, Advanced Telemetry
dered to the west by the Kilkenny Range and Systems, Isanti, Minnesota, USA; Mod-600,
the south by the Mahoosuc Range. Landcover Telonics, Mesa, Arizona, USA) or GPS
is predominately commercial forest in which radio-collars (n = 104; GPS Plus Vertex
deciduous areas are dominated by yellow Survey Collar, Vectronic Aerospace GmbH,
(Betula alleghaniensis) and paper birch Berlin, Germany). The tick load of each
(B. papyrifera), American beech (Fagus moose was measured by summing the num-
grandifolia), and sugar maple (Acer saccha- ber of ticks on 4, 10 cm transects on both
rum), with softwood stands characterized by the shoulder and rump (Sine et al. 2009,
black spruce (Picea mariana), red spruce Bergeron and Pekins 2014). The sum of
(P. rubens), balsam fir (Abies balsamea), and those 8 transects is used as an index to com-
white cedar (Thuja occidentalis) (DeGraaf et pare relative tick loads between individuals
al. 1992). Logging operations remove 1–3% and across years.
of timber annually, and optimal moose habi- The VHF radio-collars transmitted at
tat (4–16 year-old growth) increased 2.5X 55 pulses/min (ppm) while active, and
between 2001 and 2015 to equal > 17% of switched to 110 ppm after 4 h without move-
forest cover (Dunfey-Ball 2017). Habitat ment, signifying a mortality event. The GPS
quality is considered good and not a limit- radio-collars transmitted 2 location fixes/day
ing factor to the local moose population (00:00 and 12:00 hr EST) which were viewed
(Bergeron et al. 2011, Dunfey-Ball 2017). and downloaded via Vectronics Aerospace
The average date of first snowfall is 14 software (GPS PLUS X V10.4), and also
November, with permanent snow cover typi- had a VHF beacon transmitting at the same
cally in December (Dunfey-Ball 2017). This pulse rates as the VHF radio-collars. These
site was the location of a comprehensive radio-collars switched to mortality mode and
study of moose population dynamics in sent a mortality alert via email after 5 h of
2001–2005 when density was estimated inactivity. All calves were necropsied in the
as ~0.8 moose/km2 (Musante et al. 2010). field following standard procedures (Mason
The most recent population estimate is and Madden 2007, Munson 2015), including
~0.6 moose/km2, and from 2014–2018, an external examination, body weight mea-
> 200 moose were fit with radio-collars as surement, and collection of tissue samples
part of a larger study. Winter tick-related for subsequent examination at the New
calf mortality was 62%, 74%, 77%, and Hampshire Veterinary Diagnostics Lab
30% in 2014, 2015, 2016, and 2017, respec- (Durham, New Hampshire) to determine
tively (Jones et al. 2019, P. J. Pekins, unpub- cause of death (Jones et al. 2019).
lished data).
Urea nitrogen:creatinine sampling
METHODS Snow urine samples were used to track
Capture and monitoring the nutritional restriction of individual ani-
Calves (~8 months old) were captured mals through the winter, inclusive of the
in early January 2014 – 2017 via net-gun- adult tick engorgement period. Samples were
ning and aerial darting techniques (Aero collected from radio-marked calves and
Tech Inc., Clovis, New Mexico, USA in accompanying unmarked adult cows pre-
2014 and 2015; Native Range Capture sumed to be the mothers. An effort was made
Services, Elko, Nevada, USA in 2016 and to collect a sample from each individual
15SNOW URINE SAMPLING – ELLINGWOOD ET AL. ALCES VOL. 55, 2019
every 2 weeks beginning in late January and surviving calves, and dead calves across col-
extending through snowmelt or mortality lection intervals. Tukey’s range (HSD) test
(March – early April); the goal was to collect was used to make post-hoc comparisons
3–6 temporal samples per individual. between multiple collection periods.
Samples were collected within 24 h of urina-
tion by locating the bedding site and/or tracks RESULTS
in the snow at coordinates transmitted by the Winter mortality of radio-marked calves
GPS radio-collar at 00:00 hr that day; tracks in 2014 – 2016 averaged 71%, dropping
were followed until a sample was identified. to 30% in 2017; the leading cause of death
Moose with VHF radio-collars were located (> 90%) was winter tick parasitism
using ground telemetry techniques (Mech (Ellingwood 2018, Jones et al. 2019). A total
1983) and back-tracked to collect urine sam- of 158 snow urine samples were collected
ples. In cases where an adult accompanied from 38 radio-marked calves (23 winter
the calf, samples were distinguished between mortalities and 15 survivors) in the winters
the pair by the size of tracks and bed nearest of 2014–2017. Samples (n = 57) were also
to the sample. Consistent with the methods collected from 17 unmarked adult cows
used by DelGiudice et al. (1988), the most accompanying a portion of these marked
concentrated portion was collected in plastic calves; all adult cows were presumed to sur-
bags using rubber gloves to avoid contamina- vive through winter. Maximum annual snow
tion. Samples were subsequently thawed at depth during the collection periods ranged
room temperature and aliquoted into 2 mL from 17.8 – 71.1 cm.
cryovials. These aliquots were stored frozen From ~15 January – 14 February, there
until submission to BiovetUSA (Burnsville, were no statistical differences between
Minnesota) for measurement of urea nitro- UN:C ratios of unmarked cows, surviving
gen (UN) and urinary creatinine (C) content calves, and calves that died (P > 0.05). From
(mg/dL). These data were expressed as a ~ 15 Feb – 15 March, the mean UN:C ratio
ratio (UN:C) to correct for the dilution of of calves that died and those that survived
each sample by snow (DelGiudice et al. diverged significantly (P < 0.05), whereas
1988); C is proportional to muscle mass and the UN:C ratio of cows and surviving
remains near constant in individuals over a calves remained similar. The UN:C ratios
given day (DelGiudice and Seal 1988). of unmarked adult cows stayed stable
Analysis included those individuals that were throughout the sampling season (x̅ = 2.35 ±
sampled most consistently, while attempting 0.85), with individual samples ranging
to achieve near equal representation of sur- from 0.8–4.54 with no difference detected
viving and dead calves. between collection intervals (P > 0.05;
The UN:C ratio of urine samples were Fig. 2). The average UN:C ratio of calves
loge transformed to stabilize the variance in that died increased through the second week
the dataset prior to analysis (DelGiudice et of March, peaking at 4.68 ± 2.93; the ratio of
al. 1989). Samples were initially grouped by survivors was lower and relatively stable
fate (mortality or survivor), and samples during this same time period (x̅ = 2.43 ±
within each group were pooled at 2-week 0.74; Table 1). In the weeks following this
intervals (each individual was sampled spike in UN:C ratios, the average ratio of
every other week). A two-way ANOVA was calves that died never returned to levels
used to examine differences in the mean < 3.5, and mortality occurred 1–5 weeks
UN:C ratio of samples collected from cows, after their UN:C ratio peaked (x̅ = 3 weeks).
16ALCES VOL. 55, 2019 SNOW URINE SAMPLING – ELLINGWOOD ET AL.
Fig. 2. Mean (± SE) UN:C ratios in snow urine samples collected from radio-marked calves and
unmarked adult cow moose in northern New Hampshire (January-April, 2014–2017). Dotted line at
UN:C ratio = 3.5 represents the survival threshold described by DelGiudice (1995).
Table 1. Summary of UN:C ratios of snow-urine samples (n) from moose in 2014–2017, New Hampshire,
USA. Original UN:C data are presented here with statistical comparisons made after data were loge
transformed. Dead calves had significantly higher (P < 0.05; *) UN:C ratios from late February onward.
Surviving calves Dead calves Unmarked adult cows
Collection
interval n x̅ SD n x̅ SD n x̅ SD
15–31 Jan. 12 2.17 0.85 13 2.57 1.04 7 1.96 0.60
1–14 Feb. 11 2.50 0.80 19 2.88 0.97 12 2.37 0.87
15–28 Feb 15 2.99 0.75 18 3.58* 1.19 11 2.56 0.77
1–14 Mar. 14 2.43 0.74 15 4.68* 2.93 9 2.42 0.93
15–31 Mar. 10 2.47 0.53 12 3.66* 0.88 13 2.50 1.01
1–14 Apr. 10 2.18 0.87 9 4.27* 2.37 5 1.96 0.77
Spring snowmelt prevented sample collec- (Musante et al. 2010, Jones et al. 2019).
tion from 14 calves within 2 weeks of death. A low level of undernutrition during winter
is typical and reversible, as fat stores are
DISCUSSION used to supplement the reduced nutritional
Moose are on a negative nutritional quality of winter browse (DelGiudice and
plane from winter through early spring, Seal 1988, DelGiudice and Moen 1997,
although winter mortality from malnutrition Schwartz and Renecker 2007). Winter diets
is considered rare in the northeastern United have limited digestible protein which is
States. Adult survival rates in late winter reflected by low UN:C ratios in moose urine,
average 97% and starvation has not been and as fat stores deplete, moose increase cat-
identified as a source of mortality regionally abolism of muscle protein (rich in nitrogen)
17SNOW URINE SAMPLING – ELLINGWOOD ET AL. ALCES VOL. 55, 2019
to meet protein and energy requirements, snow depth for moose occurs at >90 cm
causing an abrupt spike in UN:C ratios (Coady 1974); however, in the winters of
(DelGiudice et al. 1987, DelGiudice and 2014–2017, average snow depth was ≤ 71 cm
Seal 1988). Ratios > 3.5 represent serious in northern New Hampshire and the highest
deterioration in body condition with esti- rate of calf mortality occurred in the year
mated losses of 0.5–0.8 kg/day of lean of lowest maximum snow depth (Jones
body (muscle) mass for a 400 kg moose et al. 2019).
(DelGuidice et al. 1997). For an average The timing of the spike in dead calves
(174 kg) calf expressing similar UN:C ratios, aligns with the peak feeding period of adult
this would equate to 0.2–0.3 kg/day or ~5% winter ticks in mid- to late March (Samuel
weight loss in 30 days. 2004). Arguably, calves were experiencing
Low UN:C levels (< 3.5) were measured an increasing protein and energy deficit due
in this study from January through late- to the physiological requirement to replenish
February each year, suggesting that all cows blood (protein) loss associated with feeding
and calves were in an early phase of under- by winter ticks. Tick load estimates derived
nutrition. The spike in UN:C ratios mea- from half-hide counts of dead calves aver-
sured in calves that died is symptomatic aged 47,000 (Jones et al. 2019), and com-
of animals experiencing prolonged undernu- pensation for blood loss associated with this
trition and catabolizing muscle. Similar infestation level requires 50 to >100% of the
effects have been measured in white-tailed daily protein requirement of a calf during the
deer (Odocoileus virginianus), elk (Cervus peak 2-week feeding period of adult winter
canadensis), and other moose populations ticks (Musante et al. 2007). Metabolically,
due to limited forage diversity, availability, this depletion of muscle mass (protein) mim-
and quality associated with marginal habitat ics that of a starving animal, producing a
and deep snow (DelGiudice et al. 1989, similar response in the UN:C ratios. For
1991a, 1991b). All dead calves expressed example, DelGiudice and Seal (1988) identi-
signs of anemia and emaciation including fied UN:C ratios ranging from 4 - >23 mg/dL
severe weight loss (23 ± 7%) in 3.5 months in urine samples collected from white-tailed
(Ellingwood 2018). This degree of weight deer experiencing prolonged undernutrition.
loss is comparable to that measured in white- The average UN:C ratio peaked at 4.68 for
tailed deer experiencing prolonged and irre- dead calves; however, given the average
versible levels of malnutrition (DelGiudice period (20 ± 13 days) between the date of the
and Seal 1988). last sample collection and mortality, our data
In contrast to the abovementioned exam- do not reflect the higher ratios that occur
ples, the impact of undernutrition in this closer to death.
study was not evident population-wide or The tick load measured at January cap-
associated with habitat or winter severity. ture was the primary determinant of calf fate,
Calves that died experienced a UN:C spike as tick load and probability of survival were
in March, whereas surviving calves and inversely related. For calves with low and
adult cows did not. Surviving calves and moderate tick counts, body weight has some
adults shared the same habitat as the dead counter-balancing effect on survival, with
calves, and forage availability in the study heavier calves (> 174 kg) expressing height-
area is not considered limiting (Bergeron ened resistance to mortality (Ellingwood
et al. 2011, Dunfey-Ball 2017). Limited 2018). This influence was also demon-
mobility and increased mortality due to strated in higher survival of heavier calves in
18ALCES VOL. 55, 2019 SNOW URINE SAMPLING – ELLINGWOOD ET AL.
northern Maine with similar tick loads. The Fish and Game Department from the U.S.
body weight of 73% of calves captured in Fish and Wildlife Service, Division of
New Hampshire was less than the average Wildlife and Sport Fish Restoration, and
weight (190 kg) in northern Maine where Safari Club International Foundation. This
winter tick epizootics remain uncommon research was made possible through the
(Ellingwood 2018; L. Kantar, Maine access granted by property owners includ-
Department of Inland Fisheries and Wildlife, ing American Forest Management, the
unpublished data). Given the high propor- Conservation Fund, Plum Creek, T. R. Dillon,
tion (17.5%) of optimal habitat (4–16 year and Wagner Forest Management Ltd. The
old regenerating growth) in the region efforts of field technicians J. DeBow and
(Dunfey-Ball 2017), these low weights pre- T. Soucy were critical for the collection of
sumably reflect the carry-over effects of these data.
compromised reproductive cows impacted
by high annual tick loads (Musante et al. REFERENCES
2010, Jones et al. 2017). Bahnak, B. R., J. C. Holland, L. J. Verme,
Temporal monitoring of UN:C ratios and J. J. Ozoga. 1979. Seasonal and
identified the occurrence and timing of nutritional effects on serum nitrogen
nutritional restriction of calves that ulti- constituents in white-tailed deer. Journal
mately died from blood loss to winter ticks. of Wildlife Management 43: 454–460.
While all moose exhibited some degree of Bergeron, D. H., and P. J. Pekins. 2014.
undernutrition, the spike observed in the Evaluating the usefulness of three indi-
UN:C ratio of dead calves was related ces for assessing winter tick abundance
directly to the feeding period of adult in northern New Hampshire. Alces 50:
female winter ticks. In more southern 1–15.
_______, _______, H.F. Jones, and W.B.
moose populations where winter ticks are
Leak. 2011. Moose browsing and forest
of most concern, UN:C ratios from snow
regeneration: a case study in northern
urine samples could be used to assess calf New Hampshire. Alces 47: 39–51.
condition, identify a potential epizootic _____, _____, and K. Rines. 2013. Temporal
(DelGiudice et al. 1997), and predict mor- assessment of physical characteristics
tality rate in the population. Collection and and reproductive status of moose in New
analysis of snow urine samples from calves Hampshire. Alces 49: 39–48.
in the second and third week in March Coady, J. W. 1974. Influence of snow on
should be adequate to identify the propor- behavior of moose. Le Naturaliste
tion with UN:C ratio > 3.5 and provide a Canadian 101: 417–436.
reasonable estimate of the seasonal calf DeGraff, R. M., M. Yamasaki, W. B. Leak,
mortality rate. The ability to measure this and J. W. Lanier. 1992. New England
metric provides critical recruitment infor- wildlife: management of forested habi-
tats. General Technical Report NE-144.
mation and is a useful proxy for productiv-
USDA Forest Service, Northeast
ity, both necessary to develop effective Forest Experiment Station, Radnor,
management strategies. Pennsylvania, USA.
DelGuidice G.D. 1995. Assessing winter
ACKNOWLEDGEMENTS nutritional restriction of northern deer
Funding for this project was provided with urine in snow: considerations,
through Wildlife Restoration Program Grant potential, and limitations. Wildlife
No. F13AF01123 (NH W-104-R-1) to N.H. Society Bulletin 23: 687–693.
19SNOW URINE SAMPLING – ELLINGWOOD ET AL. ALCES VOL. 55, 2019
_____, L. D. Mech, and U. S. Seal. 1988. Jones, H., P. J. Pekins, L. E. Kantar,
Chemical analyses of deer bladder urine M. O’Neil, and D. Ellingwood. 2017.
and urine collected from snow. Wildlife Fecundity and summer calf survival of
Society Bulletin 16: 324–326. moose during 3 successive years of inter
_______, _______, and _______. 1989. tick epizootics. Alces 53: 85–98.
Physiological assessment of deer popu- _______, _______, _______, D. Ellingwood,
lations by analysis of urine in snow. I. Sidor, A. Lichtenwalner, and
Journal of Wildlife Management 53: M. O’Neil. 2019. Mortality assessment
284–291. of calf moose during successive years of
_______, _______, _______, and P. D. winter tick epizootics in New Hampshire
Karns. 1987. Winter fasting and refeed- and Maine. Canadian Journal of Zoology:
ing effects on urine characteristics in 97: 22–30.
white-tailed deer. Journal of Wildlife Kirkpatrick, R.L., D.E. Buckland, W.A.
Management 51: 860–864. Abler, P.F. Scanlon, J.B. Whalen,
_______, and R. Moen. 1997. Simulating and H.E. Buckhart. 1975. Energy
nitrogen metabolism and urea nitrogen: and protein influences on blood
creatinine ratios in ruminants. Journal of urea nitrogen of white-tailed fawns.
Wildlife Management 61: 881–894. Journal of Wildlife Management 39:
______, R. O. Peterson, and W. M. Samuel. 692–698.
1997. Trends of winter nutritional Mason, G. L., and D. J. Madden. 2007.
restriction, ticks, and numbers of moose Performing the field necropsy examina-
on Isle Royale. Journal of Wildlife tion. Veterinary Clinics Food Animal
Management 61: 895–903. Practice 23: 503–526.
_______, _____, and U. S. Seal. 1991b. Mech, D. L. 1983. Handbook of Animal
Differences in urinary chemistry pro- Radio Tracking. University of Minnesota
files of moose on Isle Royale during Press, Minneapolis, Minnesota, USA.
winter. Journal of Wildlife Diseases 27: Munson, L. 2015. Necropsy of Wild
407–416. Animals. Wildlife Health Center, School
_____, and U. S. Seal. 1988. Classifying of Veterinary Medicine, University of
winter undernutrition in deer via serum California Davis, Davis, California,
and urinary urea nitrogen. Wildlife USA.
Society Bulletin 16: 27–32. Musante, A. R., P. J. Pekins, and D. L.
_____, F. J. Singer, and U. S. Seal. 1991a. Scarpitti. 2007. Metabolic impacts of
Physiological assessment of winter nutri- winter tick infestations on calf moose.
tional deprivation in elk of Yellowstone Alces 43: 101–110.
National Park. Journal of Wildlife _____, _____, and _____. 2010. Characteris
Management 55: 653–664. tics and dynamics of a regional moose
Dunfey-Ball, K. 2017. Moose density, (Alces alces) population in the northeast-
habitat and winter tick epizootics in
ern United States. Wildlife Biology 16:
a changing climate. M. S. Thesis. 185–204.
University of New Hampshire, Durham, New Hampshire Fish and Game Department
New Hampshire, USA. (NHFG). 2015. New Hampshire
Ellingwood, D. 2018. Assessing the impact Game Management Plan: 2016–2025.
of winter tick epizootics on moose New Hampshire Fish and Game
condition and population dynamics in Department, Concord, New Hampshire,
northern New Hampshire. M. S. Thesis. USA.
University of New Hampshire, Durham, Samuel, W. M. 2004. White as a Ghost:
New Hampshire, USA. Winter Ticks and Moose. Natural History
20ALCES VOL. 55, 2019 SNOW URINE SAMPLING – ELLINGWOOD ET AL.
Series, Volume 1. Federation of Alberta Seal, U. S., L. J. Verme, J. J. Ozoga, and
Naturalists, Edmonton, Alberta, Canada. A. W. Erickson. 1972. Nutritional
Schwartz, C. C., and L. A. Renecker. 2007. effects on thyroid activity and blood of
Nutrition and energetics. Pages 441–478 white-tailed deer. Journal of Wildlife
in A. W. Franzmann and C. C. Schwartz, Management 36: 1041–1051.
editors. Ecology and Management of the Sine, M. E., K. Morris, and D. Knupp. 2009.
North American Moose, 2nd edition. Assessment of a line transect method to
University Press of Colorado, Boulder, determine winter tick abundance on
Colorado, USA. moose. Alces 45: 143–146.
21You can also read