Virginia Beach Flood Protection Program Bond Referendum Analysis
←
→
Page content transcription
If your browser does not render page correctly, please read the page content below
Virginia Beach Flood
Protection Program Bond
Referendum Analysis

September 27, 2021
 Picture by Cole Keister
Virginia Beach Flood Protection
 Program Bond Referendum Analysis

 Virginia Beach Flood Protection
 Program Bond Referendum
 Analysis

Authors: Contributors:
Dr. Robert McNab Carol Considine
Professor, Department of Economics Director of Applied Projects, Commonwealth
Director, Dragas Center for Economic Center for Recurrent Flooding Resiliency
Analysis and Policy Institute for Coastal Adaptation & Resilience
Old Dominion University Old Dominion University

Dr. Juita-Elena (Wie) Yusuf Dr. Tom Allen
Professor, School of Public Service, Department of Political Science & Geography
Assistant Director for Education, Institute Program Head for Sea Level Rise & Geography,
for Coastal Adaptation & Resilience Institute for Coastal Adaptation & Resilience,
Old Dominion University Old Dominion University

Dr. Afi Anuar
Scientist
Consultant

Dr. Jessica Whitehead
Executive Director, Institute for Coastal
Adaptation & Resilience,
Old Dominion University

September 27, 2021
 PAGE 2

Virginia Beach Flood Protection
 Program Bond Referendum Analysis

 Table of Contents

 Executive Summary ...................................................................................................................................... 4

 Background and Introduction ...................................................................................................................... 7

 Economic Cost and Impact of the Flood Protection Program ................................................................ 8

 Public Perceptions and Preferences for Flood Adaptation ..................................................................... 38

 Financing Options for Resilience Infrastructure ....................................................................................... 58

September 27, 2021
 PAGE 3

Virginia Beach Flood Protection
 Program Bond Referendum Analysis

Executive Summary

On November 2, 2021, voters in the City of Virginia Beach will vote on a referendum that determines whether or not
the City Council should increase real estate taxes to fund a Flood Protection Program. The proposal accelerates the
construction of six flood mitigation projects already in the Virginia Beach Capital Improvement Plan by 3 years, and
funds design and construction of 15 additional projects that would also be completed by 2031. This report, jointly
produced by Old Dominion University’s Institute for Coastal Adaptation and Resilience (ICAR) and the Dragas Center
for Economic Analysis and Policy, combines a technical economic “pay now or pay later” analysis that this bond
referendum would have if passed with a synthesis of past social science and participatory mapping work on flooding in
Virginia Beach. It also provides an updated state of the research on options available to finance infrastructure that
reduces the impact of flooding. The report takes no position on whether the bond referendum should pass.

The impact of flooding is economically and socially significant. Recurrent flooding is the type of flooding that occurs
due to smaller flood events and chronic sea level rise. Unlike flooding from large disasters like hurricanes or
nor’easters, recurrent flooding is unlikely to meet thresholds to qualify for federal disaster assistance, meaning that its
costs will be borne locally by residents and businesses and grow over time. If Virginia Beach takes no action to reduce
the effects of projected recurrent flooding, our analysis calculates that average annualized losses from floods will rise
from $74.7 million (2021 to 2039) to $99.9 million (2040 to 2059) to $349.1 million (2060 to 2069). In addition to these
direct losses, floods also lead to lost economic output. We estimate the average annualized loss in economic output
increases from $106.8 million (2021 to 2039), $142.7 million (2040 – 2059), and $495.5 million (2060 – 2069).

Next, our report calculates the economic impact that construction of the projects in the referendum will have. We
estimate that the construction of the currently approved slate of projects will lift economic output in Virginia Beach by
$53.7 million and create over 470 jobs. If the referendum is passed and the schedule for the currently approved projects
accelerated, economic output will increase by $67.7 million and employment by almost 600 jobs. The construction of
the projects that are conditional on the passage of the referendum would raise economic output by $371.5 million and
create approximately 3,300 jobs. These economic impacts are largely transitory as the impacts are closely tied to the
construction of the approved and planned projects. If Virginia Beach continues to develop and construct additional
projects as part of their flood protection program, beyond which is detailed in this report, the construction-related
impacts would undoubtedly increase. As we do not have information on projects beyond those approved or conditional
on the referendum, our analysis is focused on the impacts associated with these projects.

To estimate the flood mitigation impacts of the currently approved slate of projects and projects whose construction is
dependent upon referendum passage, we calculated the net present value of the projects and the economic impacts of the
projects. If one does not account for the economic impacts of mitigating flood related losses to existing capital stock, the
benefit-cost ratio ranges from 13.4 to 14.1. Using economic output as a measure of benefits, we estimate the benefit-cost
ratio ranges from 19.1 to 20.1 Additionally, we determined how sensitive the resulting estimates were to multiple
assumptions about discount rate, inflation rate, leakage of expenditures outside the local economy, and the effectiveness
of the projects in reducing flood damages. Even if one assumes that the proposed projects only mitigate 25% of
projected flood losses, the estimated benefit-cost ratios are 3.3 (ignoring economic impacts) and 4.8 (inclusive of
economic impacts).

September 27, 2021
 PAGE 4

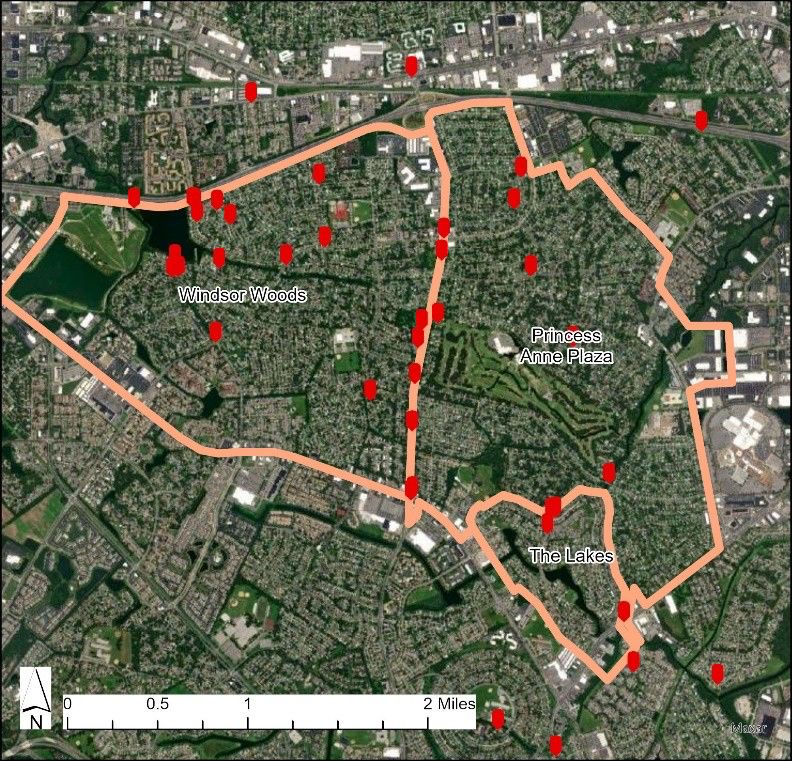
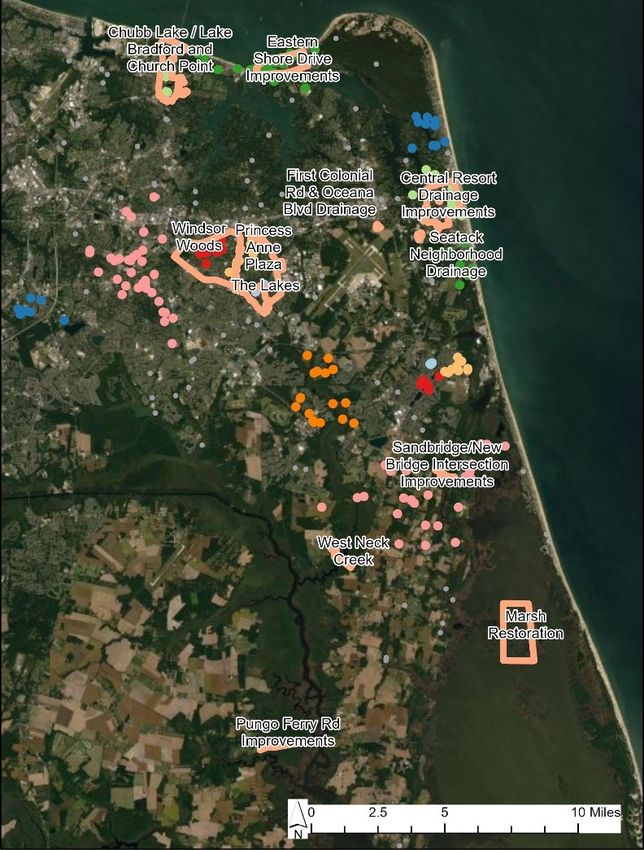
Virginia Beach Flood Protection
 Program Bond Referendum Analysis

Several quantitative surveys and qualitative focus groups and participatory mapping efforts have been conducted in
Hampton Roads since 2010. There are surveys with relevance to Virginia Beach, two of which were conducted by the
ASERT (Action-oriented Stakeholder Engagement for a Resilient Tomorrow) team at Old Dominion University. In
May-June 2016, 22% of the 1,633 respondents to the Hampton Roads Residents Perceptions of Sea Level Rise and
Flooding Adaptation survey lived in Virginia Beach. The ASERT team also gathered public perception data from
Virginia Beach residents (185 in-person participants, 81 online participants) at ASERT community meetings Phase 1 in
December 2017 and January 2018, held in the 7 sub-watersheds of the City. ASERT Community Meetings Phase 2 in
May-August 2019 were attended by 186 in-person participants and 59 online participants.

These ASERT-led efforts were conducted with different methodologies and using different questions than the telephone
survey conducted in June and July 2021 by Issues & Answers as part of the Stormwater/Flood Protection Program
Awareness and Attitudes Study, so the results of these ASERT efforts represent additional studies to compare and build
a picture of public perception. They cannot be used to demonstrate a change in public perception over time. Together,
these efforts produce a consistent picture that Virginia Beach residents recognize the need to plan for a future with more
flooding. Residents also consistently prefer infrastructure solutions to reducing flooding impacts, including public
preference and support for green infrastructure and natural and nature-based solutions.

Both the ASERT Community Meetings Phase 2 (2019) and the Stormwater/Flood Protection Program Awareness and
Attitudes Study (2021) asked questions specifically about public perceptions of how to pay for flood protection projects.
In the Stormwater/Flood Protection Program Awareness and Attitudes Study (2021), more than half of residents
surveyed either strongly agreed or somewhat agreed that existing revenue sources for stormwater and flood protection is
not sufficient to meet all the City’s long term flood preparedness needs. The Phase 2 ASERT Community Meetings
(2019) found that overall, there is support for different approaches to financing resilience infrastructure, with the highest
levels of participant support for conventional bonds (such as general obligation bonds or revenue bonds). To repay the
debt associated with infrastructure projects, of those ASERT participants, 73% of residents supported reallocating
existing revenues, 71% supported creating new revenue sources associated with the flood risk reduction, and 64%
supported dedicating revenue from fees and taxes associated with the infrastructure projects.

The questions in the Stormwater/Flood Protection Program Awareness and Attitudes Study (2021) were phrased to
provide a more nuanced understanding. In that study, when asked about the effects of sea level rise nearly 7 out of 10
residents surveyed agree that the city should not have to increase their taxes to pay for flood protection projects.
However, when asked about the proposed flood protection projects in particular, 65% of Virginia Beach residents agree
that they are willing to pay at least 1 cent more in taxes for flood protection projects, with 40% of residents surveyed
willing to pay at least 5 cents more. While less than 8% of the ASERT Community Meetings Phase 2 (2019)
participants indicated that social vulnerability impact was the most important criteria for evaluating adaptation
solutions, 46% of respondents to the Stormwater/Flood Protection Program Awareness and Attitudes Study (2021)
indicated that they were most concerned about the damaging effects of flooding on vulnerable populations.

Our team also analyzed the locations of the proposed projects accelerated by or made possible by the bond referendum
in comparison to maps created by ASERT Community Meetings Phase 1 (2018). The ASERT Phase 1 meetings
included a participatory mapping component, where residents used weTable technology to map locations of observed
flooding. For several projects and communities in Virginia Beach, there is a strong correspondence between project
locations with community flooding concerns. Specifically, Linkhorn Bay master plan (Seatack and First Colonial &
Oceana) and Central Beach district, Eastern Shore Drive and Lake Bradford/Chubb Lake/Church Point area, and
Windsor Woods/Princess Anne Plaza/The Lakes (Figure 5) project locations have a strong correlation with the

September 27, 2021
 PAGE 5
Virginia Beach Flood Protection
 Program Bond Referendum Analysis

community flooding concerns identified during ASERT. It is important to note that not all flooding concerns identified
on the ASERT community map are addressed by the prioritized stormwater projects in the bond referendum.

The bond referendum asks voters to approve the City of Virginia Beach to issue general obligation bonds in the
maximum amount of $567,500,000 for the design and construction of flood mitigation measures as part of a Citywide
Flood Protection Program. To provide information on how this approach compares with the current state of knowledge
on how to fund flood protection projects, this report reviews the current state of financing and revenue options for
resilience infrastructure. About 90% of state and local capital infrastructure spending in the United States is paid for
through debt financing. Primarily, local governments use general obligation (G.O.) bonds to finance projects like
drainage improvements, roads, and other government facilities that do not produce revenues.

Recently, some local governments across the country are developing innovative debt instruments such as green bonds,
sustainability bonds, climate bonds, social impact bonds, environmental impact bonds, catastrophe bonds, and resilience
bonds. Green, sustainability, and climate bonds are specific types of G.O. bonds that have an environmental bottom line
with additional reporting and monitoring. They sometimes attract lower interest rates than traditional bonds, but not
always. Impact bonds do not have a fixed rate of return and the repayment of principal and interest is contingent on the
project meeting agreed-upon goals and outcomes. The City of Hampton, Virginia, issued $12 million in environmental
impact bonds to pay for nature-based projects with low borrowing costs due to strong investor demand and the bond
being oversubscribed. The City of Hampton developed outcomes in collaboration with Quantified Ventures and the
Chesapeake Bay Foundation and will predict, measure, and report on the stormwater storage capacity these projects
produce. Catastrophe bonds are risk management tools which pay out during a disaster and are not applicable to
Virginia Beach’s need for stormwater projects, because they cannot be used to finance infrastructure. Finally, resilience
bonds are still in the stage of concept development and require complex modeling of risks and risk reduction.

In Virginia, payment of G.O. bonds requires the issuing locality to levy ad valorem taxes (i.e., taxes based on the
assessed value of the taxed item) such as the real estate property tax. Both the Virginia Beach City Charter and Virginia
Public Finance Act provide the authority for the city to levy ad valorem taxes upon taxable property within the city for
bond payment. The bond referendum as proposed will use an increase in real estate tax as the revenue stream that
secures the bond. Alternative approaches could include local option taxes (though this option is limited by jurisdiction
eligibility and currently authorized in the Hampton Roads region for funds allocated to roads and transit), user fees,
impact fees, tax increment financing, and special assessment districts. We describe the advantages and disadvantages of
each of these options; however, economic analysis to determine how any of these options might compare to the
mechanism proposed in the bond referendum was outside the scope of our economic analysis.

September 27, 2021
 PAGE 6

Virginia Beach Flood Protection
 Program Bond Referendum Analysis

Background and Introduction

The City of Virginia Beach has included a bond referendum for a Flood Protection Program on the November 2, 2021,
ballot to determine whether City Council should increase real estate taxes to fund flood protection projects. This report
includes an analysis of the economic impact of the proposed stormwater projects included in the referendum, public
perceptions and preferences for flood adaptation, community identified flooding challenges and available options for
paying for flood resilience infrastructure.

The bond referendum specifically includes the design and construction of flood mitigation measures as part of a
comprehensive flood protection program that includes 21 projects. Six of the projects (Eastern Shore Drive - Elevate
Lynnhaven Drive, Princess Anne Plaza North London/Bridge Creek Tide Gate, Pungo Ferry Road Improvements, The
Lakes Holland Road Gate, Windsor Woods - Thalia Creek/Lake Trashmore Improvements, and Windsor Woods Pump
Station) are approved in the current Virginia Beach Capital Improvement Plan with completion dates that extend from
June of 2028 to June of 2031. As part of the comprehensive flood protection program, these six projects will be
accelerated with all projects completed by June of 2028. In addition to the acceleration of those six projects the bond
referendum includes 15 additional projects that are not currently approved as part of the Virginia Beach Capital
Improvement plan (Central Resort District - 24th Street Culvert, Central Resort Drainage Improvements, Chubb Lake /
Lake Bradford Outfall, Church Point / Thoroughgood BMP and Conveyance Improvements, Eastern Shore Drive -
Phase I - Section 1F Improvements, Eastern Shore Drive - Phase I - Section 1G Improvements, Eastern Shore Drive -
Poinciana Pump Station, First Colonial Road and Oceana Boulevard Drainage Improvements, Princess Anne Plaza
North London Bridge Creek Pump Station Princess Anne Plaza North London Bridge Creek Barriers, Sandbridge/New
Bridge Intersection Improvements, Seatack Neighborhood Drainage Improvements, Stormwater Green Infrastructure -
Marsh Restoration, The Lakes Drainage Improvements - Flood Barriers, West Neck Creek Bridge City-Wide SLR
Strategy, Windsor Woods Drainage - Flood Barriers, Princess Anne Plaza Golf Course Conversion). These additional
projects will also be accelerated to be completed by June of 2031.

The City of Virginia Beach reached out to Old Dominion University to request a technical analysis of the Virginia
Beach Flood Protection Program Bond Referendum that synthesizes work done at Old Dominion University on flood
adaptation and resilience since 2010 with economic analysis of the projects in the proposed flood protection program.
This analysis also leverages work previously done on recurrent flooding in Virginia Beach on the Sea Level Wise
Adaptation Strategy. Importantly, this report takes no position on whether the bond referendum should pass. Instead, it
seeks to provide a “pay now or pay later” analysis for the City of Virginia Beach on the costs, benefits, and limits of the
proposed referendum, a synthesis of the prior social science work done on flooding perceptions, and context from
public policy research on the types of financing options that can potentially be used for flood resilience infrastructure
projects. The analysis of the Virginia Beach Flood Protection Program Bond Referendum has been completed by a
multidisciplinary team from Old Dominion University and is a partnership between the Institute for Coastal Adaptation
and Resilience (ICAR) and Dragas Center for Economic Analysis and Policy.

September 27, 2021
 PAGE 7

Virginia Beach Flood Protection
 Program Bond Referendum Analysis

Economic Cost and Impact of the Flood Protection
Program

The City of Virginia Beach, Virginia is proposing to fund a set of infrastructure projects through a public
referendum to mitigate current and projected losses associated with recurrent flooding. While a small
number of projects are approved in the current Capital Improvement Program (CIP), a larger set of projects
is conditional on the passage of the referendum. We estimate that if no action is taken beyond what is
approved in the current CIP, the net present value of annualized losses due to recurrent flooding from 2021
to 2069 range from $4.6 billion to $5.9 billion in 2021 dollars. Accounting for the associated economic
impacts due to the loss of capital stock, the net present value of losses in terms of economic output would
likely range from $6.5 billion to $8.4 billion in 2021 dollars. annual declines in economic activity would
reduce annual employment in Virginia Beach by 700 from 2021 to 2039, over 900 from 2040 to 2059, and
approximately 3,050 from 2060 to 2070.

The benefit-cost ratio is a useful guide to the public return on investment in infrastructure projects and is
equal to the ratio of the net present value of mitigated losses and the net present value of real expenditures.
If one does not account for the economic impacts of mitigating flood related losses to existing capital stock,
the benefit-cost ratio of the proposed projects ranges from 13.4 to 14.1. Using economic output as a measure
of benefits, we estimate the benefit-cost ratio of the proposed projects ranges from 19.1 to 20.1. The benefit-
cost ratio remains significant even if one adopts non-standard assumptions on the discount rate, inflation
rate, and the effectiveness of the flood mitigation projects. Even if the current and proposed projects
mitigate only 25% of projected flooding losses from 2021 to 2069, the benefit-cost ratio ranges from 3.3 to
4.8. We argue that our estimates serve as a lower-bound as population growth, increases in economic
activity, or an acceleration of sea level rise would increase the projected losses in the future. Given the
severity of losses increases over time, current action would yield sufficient benefits to taxpayers, businesses,
and residents in the future. These results support the conclusion that the passage of the referendum would
generate benefits to the taxpayers of Virginia Beach well in excess of the costs associated with the projects
in question.

September 27, 2021
 PAGE 8
Virginia Beach Flood Protection
 Program Bond Referendum Analysis

Introduction

Virginia Beach is proposing to fund a slate of infrastructure projects with the express intent of mitigating
current and future losses associated with recurrent flooding. While some projects are included in the
approved Capital Improvement Program (CIP), not all approved projects are currently funded. A larger
set of proposed infrastructure projects is dependent upon the passage of a bond referendum in November
2021. The purpose of this report is to estimate the net present value and associated economic impacts of
the current slate of projects and the projects conditional on the passage of the referendum.

If no action is taken to mitigate projected recurrent flooding in Virginia Beach, estimates of annual
expected losses rise significantly over the study period. Average annualized losses rise from $74.7 million
(2021 to 2039) to $99.9 million (2040 to 2059) to $349.1 million (2060 to 2069). We estimate the average
annualized loss in economic output increases from $106.8 million (2021 to 2039), $142.7 million (2040 –
2059), and $495.5 million (2060 – 2069).

We estimate that the net present value of annualized losses from flooding ranges from $4.6 billion to $5.9
billion in 2021 dollars. These losses would ripple through the Virginia Beach economy, lowering economic
output and employment. 1 We estimate the net present value of declines in economic output range from
$6.5 billion to $8.4 billion in 2021 dollars. These losses are equivalent to approximately one-quarter of
Virginia Beach’s 2019 real Gross Domestic Product. Unlike a natural disaster that occurs in a discrete time
period and typically results in the injection of public and private insurance and recovery funds, damages
from recurrent flooding occur and accumulate over time. As recurrent flooding increases, insurers are
likely to increase premiums and restrict coverages before leaving the Virginia Beach market altogether as
losses accumulate. We can reasonably expect that, over time, a greater proportion of costs will be borne by
residents and businesses, further depressing economic activity.

To estimate the economic impacts of the slate of current and proposed projects, we examine the impacts
associated with construction separately from the impacts associated with flood mitigation. We use
estimates of average annual expected losses from flooding to estimate the net present value of these projects
and associated impacts on economic output and employment. We examine the sensitivity of our results to
changes in the underlying assumptions and variations in loss mitigation.

We estimate that the construction of the currently approved slate of projects will lift economic output in
Virginia Beach by $53.7 million and create over 470 jobs. If the referendum is passed and the schedule for
the currently approved projects accelerated, economic output will increase by $67.7 million and
employment by almost 600 jobs. The construction of the projects that are conditional on the passage of the
referendum would raise economic output by $371.5 million and create approximately 3,300 jobs. These
economic impacts are largely transitory as the impacts are closely tied to the construction of the approved
and planned projects. If Virginia Beach continues to develop and construct additional projects as part of
their flood protection program, beyond which is detailed in this report, the construction-related impacts

 1 We adhere to standard practice in defining employment as total jobs in the study area, where total jobs are equal to the sum of full-time, part-time, and
 seasonal employment (Bureau of Economic Analysis, 2018).

September 27, 2021
 PAGE 9
Virginia Beach Flood Protection
 Program Bond Referendum Analysis

would undoubtedly increase. As we do not have information on projects beyond those approved or
conditional on the referendum, our analysis is focused on the impacts associated with these projects.

We estimate the flood mitigation impacts of the currently approved slate of projects and projects
conditional on the passage of the referendum. We calculate the net present value of the projects and the
economic impacts of the projects. We test the sensitivity of the estimates to variations in the discount rate,
inflation rate, and leakages of expenditures out of the local economy. We also explore how variations in
the effectiveness of flood mitigation would impact the estimates.

We calculate the benefit-cost ratio to provide a gauge of the return to public investment. The benefit-cost
ratio is equal to the ratio of the net present value of mitigated losses and the net present value of real
expenditures. If one does not account for the economic impacts of mitigating flood related losses to existing
capital stock, the benefit-cost ratio ranges from 13.4 to 14.1. Using economic output as a measure of benefits,
we estimate the benefit-cost ratio ranges from 19.1 to 20.1.

To test the sensitivity of the estimates, we explore the possibility that the proposed projects do not
completely mitigate projected damages. Even if one assumes that the proposed projects only mitigate 25%
of projected flood losses, the estimated benefit-cost ratios are 3.3 (ignoring economic impacts) and 4.8
(inclusive of economic impacts). Acceptable variations in the underlying assumptions do not yield a
benefit-cost ratio below 1. We must make non-standard assumptions about discount rates, inflation,
economic leakages, and the ineffectiveness of flood mitigation efforts to produce benefit-cost ratios below
1.

Our analysis provides insight into the benefits and costs associated with the currently approved and
contingent projects. We estimate, if the referendum is passed and projects are constructed according to the
announced schedule, that each dollar of public investment will generate 13 to 20 dollars of benefits,
depending on the prevailing assumptions. The returns on investment remain robust even when
assumptions are altered to heavily discount future benefits and diminish the effectiveness of flood
mitigation efforts. Given the relatively high return on the proposed public investments, we conclude that
the proposed projects funded by the referendum would yield significant net benefits to the taxpayers of
Virginia Beach.

A Brief Primer on Economic Impact Analysis
When considering the economic impact of a policy, economists focus on two broad effects: displacement
and additionality. Changes in public policy may cause economic agents (consumers and businesses) to alter
their behavior. The question is whether the policy change results in spending that is additional or whether
it displaces economic activity from one sector to another. Economic impact analysis focuses on the
incremental changes in economic activity and employment and should not be confused with the overall
level of activity and jobs in the economy.

September 27, 2021
 PAGE 10
Virginia Beach Flood Protection
 Program Bond Referendum Analysis

Additionality occurs when a policy change causes economic agents to engage in behavior that they would
not have taken in absence of the policy. Economic agents do not shift expenditures from elsewhere in this
case. If Virginia Beach passes a referendum to fund the construction of a flood mitigation project, then the
expenditures associated with the project and consequent economic activity are additional to the local
economy.

Displacement, on the other hand, occurs when a policy change causes economic agents to shift their
behavior such that they reduce spending in one area to increase spending in another area. The additional
spending because of the updated policy must be balanced against the reductions in spending elsewhere to
determine the economic impact. For example, if Virginia Beach cancels the construction of a recreational
facility to fund the construction of a flood mitigation project, the city is merely moving spending from one
type of capital spending to another. If we ignored the decline in planned expenditures on the recreational
facility, we would overstate the economic impact of the flood mitigation project.

The timing of spending is also important and may mix the concepts of additionality and displacement. If
spending is accelerated or delayed, then one must account for the impacts associated with the original
schedule and altered schedule. The net impact will be the incremental changes in output and employment
associated with the schedule change, not the net impacts associated with the original schedule or the altered
schedule.

To understand our approach, it is helpful to imagine a pebble dropped into a puddle of water to visualize
how the economy reacts to a change in investment or employment. The impact represents the initial round
of economic activity on output, earnings, and employment. The initial round of economic activity ripples
through the rest of the economy like the waves moving through the puddle. These ripples represent the
indirect and induced impacts that come about through the interconnectedness of the local economy. The
indirect economic impact comes from economic activity by companies frequented by employees or
companies that provide services to the project or individuals or establishments in the project. The induced
impact accounts for additional spending due to additional income generated by industries directly and
indirectly affected by the project in Virginia Beach. These spillovers create a total economic impact that is
generally larger than the direct impact.

The notion of an economic multiplier summarizes the total economic impact of a change in economic
activity. If a firm invests $10,000,000 (direct impact) that generates $3,000,000 in indirect economic impacts
and $2,000,000 in induced economic impacts, then the economic impact multiplier is ($10,000,000 +
$3,000,000 + $2,000,000) / $10,000,000 = 1.5. In other words, for this sector, every $1 of new spending yields
a $1.5 increase in economic output, where output is the measure of the total value of goods produced in
the sector.

The expenditure of funds also may create an incremental change in employment (jobs). The direct, indirect,
and induced impacts on jobs are dependent upon the relationship between changes in output and changes
in employment. Labor intensive sectors, for example, will likely observe more significant direct
employment impacts than capital intensive sectors. Continuing the example, assume that $10 million in
direct spending generates 40 jobs, $3 million in indirect spending generates 1.5 jobs, and $2 million in

September 27, 2021
 PAGE 11
Virginia Beach Flood Protection
 Program Bond Referendum Analysis

induced spending yields 0.5 jobs. The jobs multiplier is thus (40+1.5+0.5)/($10,000,000/$1,000,000) = 4.2.
In other words, a $1 million increase in direct spending generates 4.2 new jobs.

We must also consider whether spending ‘leaks’ from the local economy. The higher the proportion of
spending that occurs outside the study region, the lower the direct expenditure and economic impacts on
the area of interest. Assume that in the previous example, the firm invested $10 million in a local facility,
but 50% of this expenditure was on materials and labor from outside the study area. In this case, direct
spending would be $5 million, not $10 million, because of the leakage of $5 million outside the study area.
The overall economic impact of the firm’s investment would be $7.5 million, not the $10 million associated
with the overall spending on the project.

Overview of Existing and Proposed Projects
To estimate the economic impact of the slate of projects funded by the proposed referendum, it is necessary
to first establish the baseline against which comparisons can be made. The baseline consists of a set of
projects in the approved CIP that are either funded or there exists high confidence that these projects will
be funded by the scheduled start date. The six baseline projects, schedules, and budgeted amounts are
displayed in Table 1.

 Table 1.
 Projects Approved in the Current Capital Improvement Plan

 Project Name Start Date End Date Total
 Budget
 Eastern Shore Drive - Elevate Lynnhaven 07/01/23 11/30/29 $3,600,000
 Drive
 Princess Anne Plaza North London/Bridge 07/01/20 06/30/31 $11,322,000
 Creek Tide Gate
 Pungo Ferry Road Improvements 07/01/24 01/01/30 $11,500,000
 The Lakes Holland Road Gate 07/01/24 06/30/30 $8,507,000
 Windsor Woods - Thalia Creek/Lake 07/01/23 06/30/28 $5,200,000
 Trashmore Improvements
 Windsor Woods Pump Station 07/01/22 06/30/30 $40,250,000

 Total $80,379,000

If the referendum passes, the projects highlighted in Table 1 will be accelerated relative to the existing
baseline. As Table 2 illustrates, the funding levels of these projects remain constant in nominal (budget)
dollars, however, the acceleration shifts these projects forward in time. The acceleration of these projects

September 27, 2021
 PAGE 12
Virginia Beach Flood Protection
 Program Bond Referendum Analysis

means that the spending and benefits accrue earlier than the baseline. To avoid double-counting, we
estimate the incremental benefit of acceleration for this set of projects.

 Table 2.
 Projects Approved in the Current Capital Improvement Plan - Accelerated

 Project Name Start Date End Date Total
 Budget
 Eastern Shore Drive - Elevate Lynnhaven 07/01/22 06/30/28 $3,600,000
 Drive
 Princess Anne Plaza North London/Bridge 07/01/20 06/30/25 $11,322,000
 Creek Tide Gate
 Pungo Ferry Road Improvements 07/01/22 12/31/27 $11,500,000
 The Lakes Holland Road Gate 07/01/22 06/30/27 $8,507,000
 Windsor Woods - Thalia Creek/Lake 07/01/22 06/30/25 $5,200,000
 Trashmore Improvements
 Windsor Woods Pump Station 07/01/22 06/30/27 $40,250,000

 Total $80,379,000

The passage of the referendum will also fund the design and construction of a large slate of new projects.
As these projects are conditional on the passage of the referendum, there are no economic impacts
associated with these projects in the baseline scenario. Table 3 illustrates the group of new projects. For
convenience, we treat one project that consists of three phases (the Princess Anne Golf Course Conversion
project) as three distinct projects.

September 27, 2021
 PAGE 13
Virginia Beach Flood Protection
 Program Bond Referendum Analysis

 Table 3.
 New Projects Funded by Referendum Passage

 Project Name Start Date End Date Total
 Budget
 Central Resort District - 24th Street Culvert 07/01/22 06/30/26 $5,200,000
 Central Resort Drainage Improvements 07/01/22 12/31/30 $92,800,000
 Chubb Lake / Lake Bradford Outfall 07/01/22 06/30/29 $78,200,000
 Church Point / Thoroughgood BMP and 07/01/23 06/30/30 $35,900,000
 Conveyance Improvements
 Eastern Shore Drive - Phase I - Section 1F 07/01/22 12/31/25 $1,560,000
 Improvements
 Eastern Shore Drive - Phase I - Section 1G 07/01/22 12/31/25 $940,000
 Improvements
 Eastern Shore Drive - Poinciana Pump Station 07/01/22 12/31/26 $8,200,000
 First Colonial Road and Oceana Boulevard 07/01/22 12/31/25 $2,325,000
 Drainage Improvements
 Princess Anne Plaza North London Bridge 07/01/22 06/30/27 $55,452,000
 Creek Pump Station
 Princess Anne Plaza North London Bridge 07/01/22 06/30/26 $2,126,000
 Creek Barriers
 Sandbridge/New Bridge Intersection 07/01/22 12/31/27 $7,990,000
 Improvements
 Seatack Neighborhood Drainage 07/01/22 12/31/25 $2,400,000
 Improvements
 Stormwater Green Infrastructure - Marsh 07/01/23 06/30/26 $40,000,000
 Restoration
 The Lakes Drainage Improvements - Flood 07/01/22 06/30/26 $3,600,000
 Barriers
 West Neck Creek Bridge City-Wide SLR 07/01/22 06/30/31 $69,000,000
 Strategy
 Windsor Woods Drainage - Flood Barriers 07/01/22 06/30/26 $14,000,000
 Princess Anne Plaza Golf Course Conversion 07/01/20 06/30/25 $33,975,434
 (Phase 1)
 Princess Anne Plaza Golf Course Conversion 07/01/23 06/30/28 $31,290,133
 (Phase 2)
 Princess Anne Plaza Golf Course Conversion 07/01/26 06/30/31 $18,334,433
 (Phase 3)

 Total $503,293,000

September 27, 2021
 PAGE 14
Virginia Beach Flood Protection
 Program Bond Referendum Analysis

Methodology for Present Value Expenditure Estimates
To estimate the economic impact of the baseline and alternative scenarios, we first estimate nominal
expenditures by project by category by year. Using the projected start and completion dates of each product
and category, we determine the total number of months that each project i is active in category j. We
explicitly assume that category expenditures are evenly distributed across active months and estimate
average monthly category nominal expenditures in Equation (1).

Equation (1)

Using the projected start and completion dates, we then determine the total number of months that each
project is active in each category by year t. The product of the number of months active by year in each
category and average expenditures by category yields the estimate of annual expenditures by category by
project by year as shown in Equation (2).

Equation (2)

The Office of Management and Budget’s Circular A-94 (OMB A-94) provides guidelines for benefit-cost
analysis for the analysis of federal programs (Office of Management and Budget, 2012). As noted in OMB
Circular A-94, economic analyses are commonly conducted using real or constant-dollar values.2 Given the
potential costs of flooding are expressed as annualized losses in 2021 dollars, we convert estimated nominal
expenditures into constant price 2021 dollars using the GDP Price Index. Equation (3) illustrates the
conversion of nominal expenditures to constant price expenditures.

Equation (3)

 2 It is commonly understood that one should not mix nominal and real values in economic analysis

September 27, 2021
 PAGE 15
Virginia Beach Flood Protection
 Program Bond Referendum Analysis

Table 4 contains the assumptions for the baseline and alternate scenarios. For the baseline scenario, we
adopt the Congressional Budget Office’s forecasts of the Gross Domestic Product (GDP) Price Index
(Congressional Budget Office, 2021). We convert the base year of the index from 2012 to 2021 for conformity
with the annualized loss estimates and formation of the budget expenditure projections. The CBO’s July
2021 forecast is that the growth in the GDP price index will moderate from 2.8% in 2021 to 2.1% in 2022 and
remain constant at 2.1% over the study period. For our alternate scenario, we assume a higher rate of
growth in the GDP Price Index than the CBO baseline to test the sensitivity of our analysis. We assume that
the GDP price index will increase 3% in 2021, 2.8% in 2022, 2.6% in 2023, and will then average 2.5% over
the remainder of the study period.

 Table 4.
 Baseline and Alternate Scenario Assumptions

 Primary Analysis Sensitivity Analysis
 Real Discount Rate 7.0% 2.5%

 Inflation Rate
 2021 Inflation Rate 2.8% 3.0%
 2022 Inflation Rate 2.1% 2.8%
 2023 Inflation Rate 2.1% 2.6%
 2024 Inflation Rate 2.1% 2.5%
 2025 Inflation Rate 2.1% 2.5%
 2026 Inflation Rate 2.1% 2.5%
 2027 Inflation Rate 2.1% 2.5%
 2028 Inflation Rate 2.1% 2.5%
 2029 Inflation Rate 2.1% 2.5%
 2030 Inflation Rate 2.0% 2.5%
 2031 Inflation Rate 2.0% 2.5%

 Leakages
 Design 10% 10%
 Site Acquisition 10% 25%
 Private Utility Adjustments 50% 50%
 Construction 25% 35%
 Contingencies 25% 30%

September 27, 2021
 PAGE 16
Virginia Beach Flood Protection
 Program Bond Referendum Analysis

To compute the present value of the baseline and alternative scenarios, it is necessary to discount future
benefits and costs. Discounting reflects the time value of money as future costs and benefits are worth less
contemporaneously the farther out these costs and benefits occur in the future. We use a real discount rate
to discount constant-dollar expenditures. As noted in OMB A-94, constant-dollar cost benefit analyses of
proposed investments should utilize a real discount rate of 7 percent. However, the Congressional Research
Service (CRS) noted the Water Resources Development Act of 1974 (WRDA 1974) required the executive
branch to use an annually adjusted water planning discount rate for project planning purposes
(Congressional Research Service, 2016). For 2021, the WRDA 1974 discount rate was set at 2.5 percent (Natural
Resources Conservation Service, 2021). We use a real discount rate of 7 percent following OMB guidance and
test the sensitivity of our results using the 2.5 percent discount rate.

We estimate the present value of constant-dollar expenditures by category and year for the slate of
projects in the primary and alternative scenarios. Equation (4) illustrates the calculation of the discount
factor given the discount rate r. We determine the number of periods, n, as equal to the year distance
(positive or negative) from 2021.

Equation (4)

 =
 ( + )

Using the discount factor in Equation (4) and Equation (5), we estimate the present value of real
expenditures for each project category in year t.

Equation (5)

Tables 5 and 6 present the real present value of the current slate of CIP projects as currently scheduled and
as accelerated if the referendum passes. In the baseline scenario, the present value of real expenditures
increases from $46.9 million to $59.2 million if the referendum is passed, an increase of $12.2 million. In the
alternative scenario, acceleration increases the present value of real expenditures from $60.5 million to $68.4
million, an increase of $7.9 million. The larger increase in the baseline scenario is largely due to the higher
discount rate relative to the alternative scenario; acceleration moves expenditures closer to the present,
increasing their present value.

September 27, 2021
 PAGE 17
Virginia Beach Flood Protection
 Program Bond Referendum Analysis

 Table 5.
 Present Value of Real Expenditures Projects Approved in the Current
 Capital Improvement Plan Baseline Scenario

 Project Name Total Current Accelerated
 Budget Schedule Schedule
 Eastern Shore Drive - Elevate Lynnhaven $3,600,000 $2,130,051 $2,364,074
 Drive
 Princess Anne Plaza North $11,322,000 $6,751,973 $9,577,611
 London/Bridge Creek Tide Gate
 Pungo Ferry Road Improvements $11,500,000 $6,355,549 $7,660,616
 The Lakes Holland Road Gate $8,507,000 $4,532,340 $6,180,178
 Windsor Woods - Thalia Creek/Lake $5,200,000 $3,411,271 $4,133,209
 Trashmore Improvements
 Windsor Woods Pump Station $40,250,000 $23,729,146 $29,229,643

 Total $80,379,000 $46,910,329 $59,145,330
Notes: The baseline scenario employs a real discount rate of 7% and the Congressional Budget Office’s GDP Price
Index forecast of July 2021.

 Table 6.
 Present Value of Real Expenditures Projects Approved in the Current
 Capital Improvement Plan – Accelerated Alternative Scenario
 Project Name Total Current Accelerated
 Budget Schedule Schedule
 Eastern Shore Drive - Elevate Lynnhaven $3,600,000 $2,736,483 $2,888,155
 Drive
 Princess Anne Plaza North $11,322,000 $8,605,286 $10,365,272
 London/Bridge Creek Tide Gate
 Pungo Ferry Road Improvements $11,500,000 $8,448,521 $9,302,311
 The Lakes Holland Road Gate $8,507,000 $6,128,615 $7,193,726
 Windsor Woods - Thalia Creek/Lake $5,200,000 $4,172,506 $4,613,120
 Trashmore Improvements
 Windsor Woods Pump Station $40,250,000 $30,424,999 $34,037,543

 Total $80,379,000 $60,516,411 $68,400,127
Notes: The alternative scenario employs a real discount rate of 2.5% and the alternative GDP Price Index forecast
contained in Table 1.

September 27, 2021
 PAGE 18
Virginia Beach Flood Protection
 Program Bond Referendum Analysis

Table 7 contains estimates of the real present value of the projects that are conditional on the passage of
the referendum. The real present value of these projects is $328.7 million in the baseline scenario and $401.2
million in the alternative scenario. These estimates highlight the conservative nature of adopting the 7
percent discount rate in the baseline scenario given that it more significantly discounts future costs and
benefits than the 2.5 percent discount rate in the alternative scenario.

 Table 7.
 Present Value of Real Expenditures New Projects Funded by
 Referendum Passage
 Project Name Total Baseline Alternative
 Budget Scenario Scenario
 Central Resort District - 24th Street $5,200,000 $3,738,219 $4,378,467
 Culvert
 Central Resort Drainage Improvements $92,800,000 $54,013,864 $69,741,476
 Chubb Lake / Lake Bradford Outfall $78,200,000 $49,485,880 $61,463,655
 Church Point / Thoroughgood BMP and $35,900,000 $20,796,336 $26,959,312
 Conveyance Improvements
 Eastern Shore Drive - Phase I - Section 1F $1,560,000 $1,166,866 $1,341,196
 Improvements
 Eastern Shore Drive - Phase I - Section 1G $940,000 $712,591 $813,670
 Improvements
 Eastern Shore Drive - Poinciana Pump $8,200,000 $5,886,385 $6,898,080
 Station
 First Colonial Road and Oceana $2,325,000 $1,760,613 $2,011,280
 Boulevard Drainage Improvements
 Princess Anne Plaza North London $55,452,000 $42,029,036 $47,867,623
 Bridge Creek Pump Station
 Princess Anne Plaza North London $2,126,000 $1,555,078 $1,806,104
 Bridge Creek Barriers
 Sandbridge/New Bridge Intersection $7,990,000 $5,298,922 $6,443,645
 Improvements
 Seatack Neighborhood Drainage $2,400,000 $1,820,690 $2,078,121
 Improvements
 Stormwater Green Infrastructure - Marsh $40,000,000 $30,659,916 $34,805,603
 Restoration
 The Lakes Drainage Improvements - $3,600,000 $2,673,938 $3,082,096
 Flood Barriers
 West Neck Creek Bridge City-Wide SLR $69,000,000 $38,373,686 $50,617,676
 Strategy

September 27, 2021
 PAGE 19
Virginia Beach Flood Protection
 Program Bond Referendum Analysis

 Windsor Woods Drainage - Flood $14,000,000 $10,315,767 $11,937,690
 Barriers
 Princess Anne Plaza Golf Course $33,975,434 $28,990,165 $31,242,083
 Conversion (Phase 1)
 Princess Anne Plaza Golf Course $31,290,133 $20,203,455 $24,906,923
 Conversion (Phase 2)
 Princess Anne Plaza Golf Course $18,334,433 $9,215,697 $12,825,971
 Conversion (Phase 3)

 Total $503,293,000 $328,697,102 $401,220,672
Notes: The baseline scenario employs a real discount rate of 7% and the Congressional Budget Office’s GDP Price
Index forecast of July 2021. The alternative scenario employs a real discount rate of 2.5% and the alternative GDP
Price Index forecast contained in Table 1.

An economic leakage occurs when spending occurs outside a study area. If the spending that flows to
individuals and businesses outside the study area is included in the economic impact analysis, the impact
of the proposed projects would be overstated. If, for example, 10% of the real present value design
expenditures leak from Virginia Beach, then the present value of real direct design expenditures in Virginia
Beach will be equal to 90% of the present value of real design expenditures (the total spending in the design
category for the project in a given year). Equation (6) shows the estimation of the present value of direct
real expenditures by project, spending category, and time. The present value of real direct
expenditures by project is the input for the economic impact estimates as it captures only the spending
that occurs within Virginia Beach.

Equation (6)
 , ,

 , ,
 = × × F − J

Construction Economic Impacts
To determine the economic impact of the construction, we ascertain the impact of the approved slate of
projects. As shown in Table 8, the real present value of the approved projects on the current schedule is
$46.9 million. After accounting for leakages in the baseline scenario (Table 4), the real present value of
direct spending in Virginia Beach will be $36.3 million. If construction proceeded as currently scheduled,
these projects would lift economic output by $53.7 million. In the alternative scenario, economic output
increases by $61.5 million. Graph 1 illustrates the real present value of direct spending and the real present
value of economic output in the baseline and alternative scenarios.

September 27, 2021
 PAGE 20
Virginia Beach Flood Protection
 Program Bond Referendum Analysis

 Table 8.
 Construction Economic Impacts in the Baseline Scenario Projects
 Approved in the Current Capital Improvement Plan
 Project Name Planned Present Present Total Total
 Budget Value of Value of Estimated Employment
 Expenditure Real Real Direct Impact
 Expenditures Expenditures on Real
 in Virginia Output
 Beach
 Eastern Shore Drive $3,600,000 $2,130,051 $1,654,304 $2,411,542 21.3
 - Elevate Lynnhaven Drive
 Princess Anne Plaza $11,322,000 $6,751,973 $5,122,165 $7,466,208 65.2
 North London/Bridge
 Creek Tide Gate
 Pungo Ferry Road $11,500,000 $6,355,549 $4,935,551 $7,155,266 63.5
 Improvements
 The Lakes Holland $8,507,000 $4,532,340 $3,526,049 $5,217,013 46.3
 Road Gate
 Windsor Woods - Thalia $5,200,000 $3,411,271 $2,673,491 $3,969,188 35.0
 Creek/Lake Trashmore Impr
 Windsor Woods $40,250,000 $23,729,146 $18,379,205 $27,434,898 242.6
 Pump Station

 Totals $80,379,000 $46,910,329 $36,290,765 $53,654,115 474

Graph 2 presents the impact on employment for the currently approved projects. In the baseline scenario,
currently scheduled construction would create 474 jobs. If the referendum were passed, the acceleration of
these projects would raise job creation to 599 jobs (Table 9). In the alternative scenario, 543 and 677 jobs are
created under the current and accelerated schedules, respectively.

Graph 3 displays the real present value of spending and economic output in Virginia Beach for the slate of
new projects that would be funded by the passage of the referendum. In the baseline scenario, these projects
would result in approximately $254.5 million in real direct spending in the city, increasing total economic
output by about $371.5 million (Table 10). In the alternative scenario, the projects would increase direct
spending by approximately $273.1 million and economic output by $398.9 million. In the baseline scenario,
the new projects would create approximately 3,310 jobs while 3,545 jobs would be added in the alternative
scenario. These jobs include the jobs directly related to the construction of the projects and the indirect and
induced jobs created by the construction spending and employment.

September 27, 2021
 PAGE 21
Virginia Beach Flood Protection
 Program Bond Referendum Analysis

 Graph 1.
 Real Present Value of Currently Approved Projects Baseline and
 Alternative Scenarios

 $90
 Present Value in Millions of 2021 Dollars

 $80 $76.8

 $70 $67.7
 $61.5
 $60 $53.7 $52.0
 $50 $45.8
 $41.5
 $40 $36.3

 $30

 $20

 $10

 $0
 Baseline Spending Baseline Output Alternative Spending Alternative Output

 Current Schedule Accelerated Schedule

 Graph 2.
 Impact on Employment – Construction of Currently Approved Projects
 Baseline and Alternative Scenarios

 677
 599
 543
 474
 Change in Employment

September 27, 2021
 PAGE 22
Virginia Beach Flood Protection
 Program Bond Referendum Analysis

 Table 9.
 Construction Economic Impacts in the Baseline Scenario Projects
 Approved in the Current Capital Improvement Plan - Accelerated

 Project Name Planned Present Present Total Total
 Budget Value of Value of Estimated Employment
 Expenditure Real Real Direct Impact on
 Expenditures Expenditures Real
 in Virginia Output
 Beach
 Eastern Shore Drive $3,600,000 $2,364,074 $1,835,978 $2,678,061 23.6
 - Elevate Lynnhaven Drive
 Princess Anne Plaza $11,322,000 $9,577,611 $7,269,482 $10,600,463 92.5
 North London/Bridge
 Creek Tide Gate
 Pungo Ferry Road $11,500,000 $7,660,616 $5,953,296 $8,638,715 76.6
 Improvements
 The Lakes Holland $8,507,000 $6,180,178 $4,825,010 $7,164,445 63.7
 Road Gate
 Windsor Woods - Thalia $5,200,000 $4,133,209 $3,231,282 $4,784,669 42.1
 Creek/Lake Trashmore Impr
 Windsor Woods $40,250,000 $29,229,643 $22,647,314 $33,875,891 299.9
 Pump Station

 Totals $80,379,000 $59,145,330 $45,762,363 $67,742,244 599

 Graph 3.
 Real Present Value of Direct Spending and Economic Output Baseline
 and Alternative Scenarios
 $450
 $398.9
 Present Value in Millions of 2021 Dollars

 $400 $371.5
 $350

 $300 $273.0
 $254.5
 $250

 $200

 $150

 $100

 $50

 $0
 Baseline Spending Baseline Output Alternative Spending Alternative Output

September 27, 2021
 PAGE 23
Virginia Beach Flood Protection
 Program Bond Referendum Analysis

 Table 10.
 Construction Economic Impacts in the Baseline Scenario
 New Projects

 Project Name Planned Present Present Total Total
 Budget Value of Value of Estimated Employment
 Expenditure Real Real Direct Impact on
 Expenditures Expenditures Real
 in Virginia Output
 Beach
 Central Resort District – $5,200,000 $3,738,219 $2,821,569 $3,970,374 35.7
 24th Street Culvert
 Central Resort Drainage $92,800,000 $54,013,864 $41,629,892 $61,143,411 549.5
 Improvements
 Chubb Lake / Lake $78,200,000 $49,485,880 $38,429,461 $56,331,091 503.2
 Bradford Outfall
 Church Point / Thoroughgood $35,900,000 $20,796,336 $16,149,481 $23,671,762 211.5
 BMP and Conveyance Improvements
 Eastern Shore Drive - Phase I – $1,560,000 $1,166,866 $900,302 $1,291,388 11.4
 Section 1F Improvements
 Eastern Shore Drive - Phase I – $940,000 $712,591 $559,596 $809,743 7.3
 Section 1G Improvements
 Eastern Shore Drive – $8,200,000 $5,886,385 $4,521,689 $6,568,502 57.2
 Poinciana Pump Station
 First Colonial Road and Oceana $2,325,000 $1,760,613 $1,344,853 $1,966,315 17.2
 Boulevard Drainage Improvements
 Princess Anne Plaza North London $55,452,000 $42,029,036 $32,757,725 $47,349,681 431.9
 Bridge Creek Pump Station
 Princess Anne Plaza North London $2,126,000 $1,555,078 $1,204,038 $1,764,346 15.4
 Bridge Creek Barriers
 Sandbridge/New Bridge $7,990,000 $5,298,922 $4,068,970 $5,898,187 52.9
 Intersection Improvements
 Seatack Neighborhood $2,400,000 $1,820,690 $1,374,892 $2,008,907 17.6
 Drainage Improvements
 Stormwater Green Infrastructure – $40,000,000 $30,659,916 $23,435,634 $33,731,826 293.7
 Marsh Restoration
 The Lakes Drainage Improvements – $3,600,000 $2,673,938 $2,097,992 $3,050,014 27.4
 Flood Barriers
 West Neck Creek Bridge City- $69,000,000 $38,373,686 $29,822,159 $43,876,751 387.9
 Wide SLR Strategy
 Windsor Woods Drainage – $14,000,000 $10,315,767 $8,063,814 $11,938,936 105.0
 Flood Barriers
 Princess Anne Plaza Golf $33,975,434 $28,990,165 $22,703,941 $33,056,343 295.9
 Course Conversion (Phase 1)
 Princess Anne Plaza Golf Course $31,290,133 $20,203,455 $15,533,367 $22,587,126 196.7
 Conversion (Phase 2)
 Princess Anne Plaza Golf Course $18,334,433 $9,215,697 $7,107,436 $10,498,084 92.3
 Conversion (Phase 3)
 Totals $503,293,000 $328,697,102 $254,526,810 $371,512,786 3,310

September 27, 2021
 PAGE 24
Virginia Beach Flood Protection
 Program Bond Referendum Analysis

The referendum, as previously noted, would have two discernable effects: acceleration of currently
approved projects and funding of new projects. Graph 4 illustrates the changes in economic output if the
referendum is successful. In the baseline scenario, the impact on economic output increases from $53.7
million to $385.6 million. In the alternative scenario, the impact on economic output increases from $61.5
million to $414.2 million. With regards to employment, the passage of the referendum increases jobs by
3,435 and 3,679 in the baseline and alternative scenarios, respectively (Graph 5).

 Graph 4.
 Impact on Economic Output – Construction Baseline and
 Alternative Scenarios

 $385.6
 Millions of 2021 Dollars

Note: Currently approved projects only include projects in the approved CIP and on current schedule. Referendum
passage includes the impact of the acceleration of currently approved projects and the construction of projects
conditional on the passage of the referendum.

September 27, 2021
 PAGE 25
Virginia Beach Flood Protection
 Program Bond Referendum Analysis

 Graph 5.
 Impact on Employment – Construction Baseline and
 Alternative Scenarios
 Change in Employment

 500

Note: Currently approved projects only include projects in the approved CIP and on current schedule. Referendum passage
includes the impact of the acceleration of currently approved projects and the construction of projects conditional on the passage of
the referendum.

We note that these economic impacts are solely related to the construction of these projects in question and
do not account for the mitigation of losses associated with these projects. We also note that the construction
impacts are associated with the current and proposed slate of projects. If additional projects are constructed
in the future, the economic impacts of the current and proposed projects would increase. However, our
focus is on the projects that would be affected by the referendum. For these reasons, we estimate the
impacts of construction and acceleration separately from the impacts of mitigation.

Net Present Value of Mitigation
To estimate the net present value of the losses associated with the proposed projects, we employ damage
estimates from HAZUS as generated by Virginia Beach Public Works Stormwater Engineering Center and
Dewberry. As noted by the United States Geological Service, the federal government employs annual
exceedance probabilities (AEPs). The most used definition is a ‘1 in 100-year flood.’ This refers to a flood
level that has a one in one hundred, or 1%, chance in being equaled or exceeded each year. Following
standard practice, this is noted as a 1% AEP.

September 27, 2021
 PAGE 26
You can also read