WARP FIELD PHYSICS Eagleworks Laboratories - NASA JSC Dr. Harold "Sonny" White
←
→
Page content transcription
If your browser does not render page correctly, please read the page content below
https://ntrs.nasa.gov/search.jsp?R=20140000851 2019-10-01T19:38:46+00:00Z

                                                          Eagleworks Laboratories
                                                      WARP FIELD PHYSICS

                                                                  Dr. Harold “Sonny” White
                                                                          NASA JSC

Picture courtesy of NASA,
http://www.nasa.gov/centers/glenn/technology/warp/warpstat.html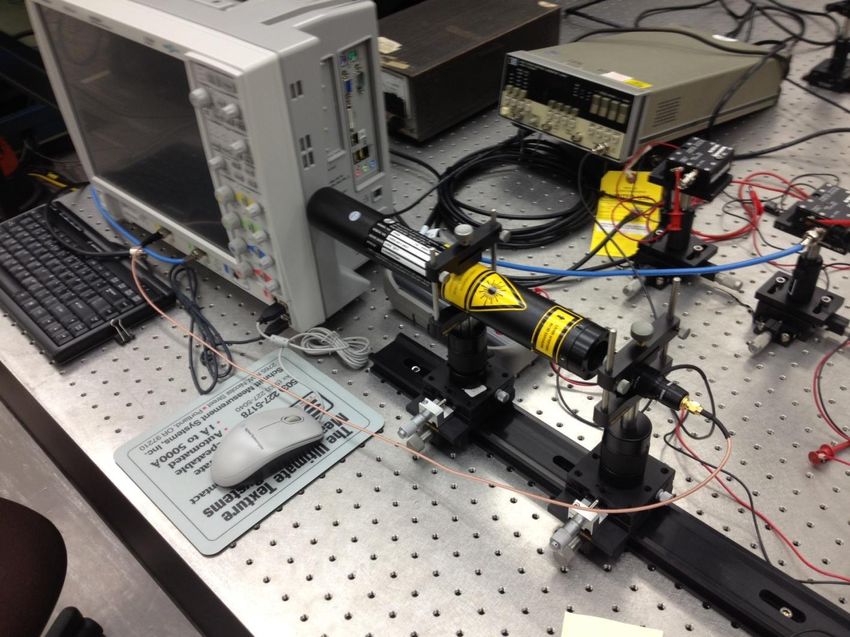
Hyper-fast interstellar travel…
      • Is there a way within the framework of physics such that one
        could cross any given cosmic distance in an arbitrarily short
        period of time, while never locally breaking the speed of light
        (11th commandment)?
                                                    SPACEWARPS
                                                      (inflation)

                       WORMHOLES
                        (shortcuts)
                                                                          22
Images courtesy NASA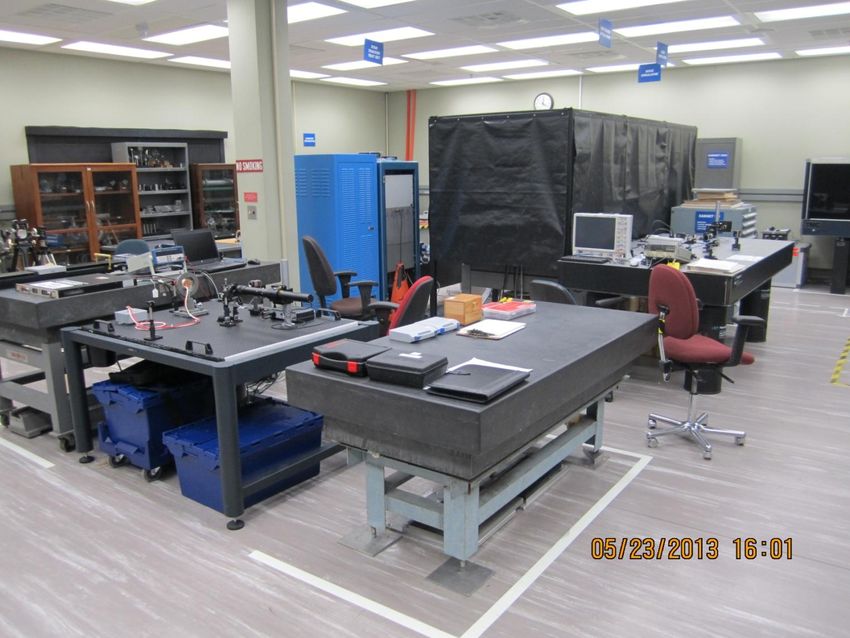
Inflation: Alcubierre Metric1
Warp Metric:
     2             2                         2        2        2
                                                                       Space expansion                                      Location of
ds            dt        (dx vs f (rs )dt )       dy       dz             behind ship                                        ship proper

                                Apparent speed
Shaping Function:
         Shell thickness   Shell size
           parameter       parameter

               tanh( (rs        R)) tanh( (rs    R))
  f (rs )
                               2 tanh( R)
York Time:
             x df (rs )        York Time is measure of
           vs s                 expansion/contraction
              rs drs                   of space

Energy Density:
                                                 2
                           2    2    2
    1 00                1 v ( y z ) df (rs )
                           s
     G                            2
                                                                                                                       Space contraction
   8                   8      4rs    drs                                                                                in front of ship
                                                                                                                                                     33
                                                               1.   Alcubierre, M., “The warp drive: hyper-fast travel within general relativity,”
                                                                    Class. Quant. Grav. 11, L73-L77 (1994).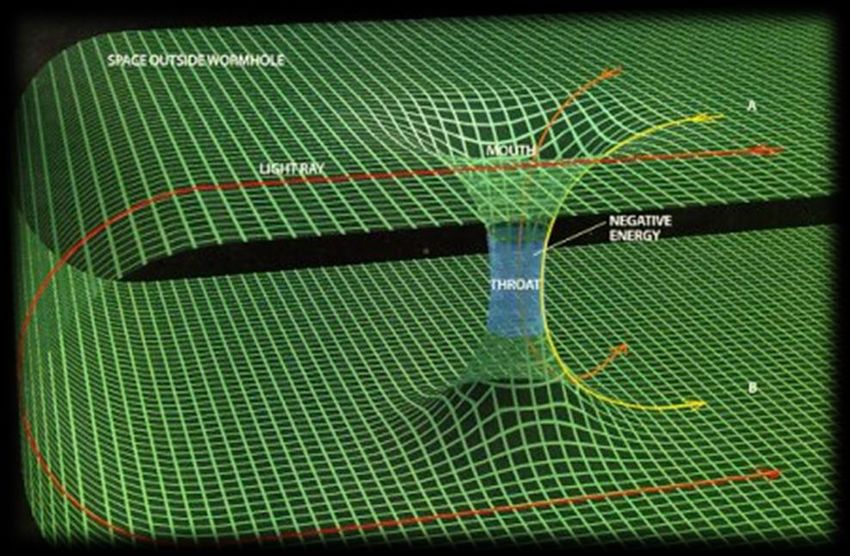
Bubble Topology Optimization
   York Time magnitude decreases

                    v                                     v                               v

                                                                      “bubble” thickness decreases
   Energy density magnitude decreases

       v                                      v                               v

                                                                      “bubble” thickness decreases
                                                                                                    4
Surface plots of York Time &   T00,   =10c, 10 meter diameter volume, variable warp “bubble” thickness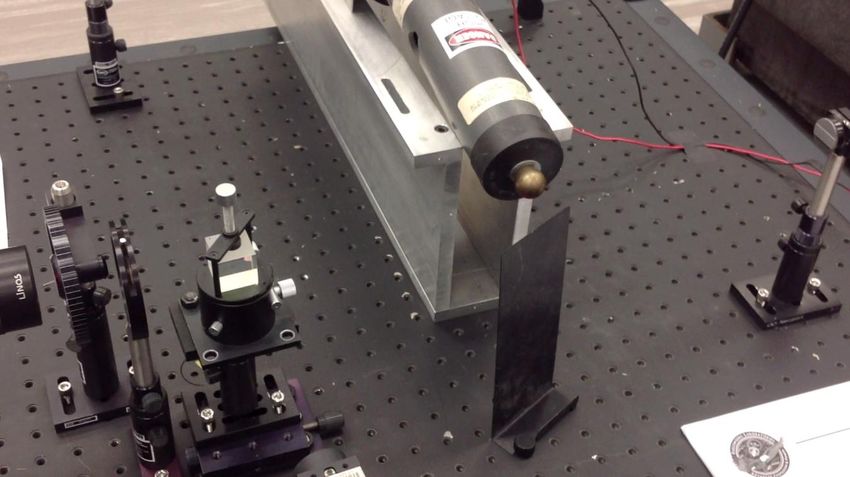
Bubble Oscillation Optimization
                                           2        2   2   a 2 (t )
                                      ds        c dt          2 kU
                                                                     dX 2 dU 2
                                                            e

                                               dX       ce kU   dU 2
                                                              1 2 2
                                               dt       a(t )   c dt

                                      dU                           dX
                                                1,U         0              0
                                       dt                          dt

                                                                 d      dU
                                               eU           U
                                                                 dt      dt

d
dt           Oscillate the bubble intensity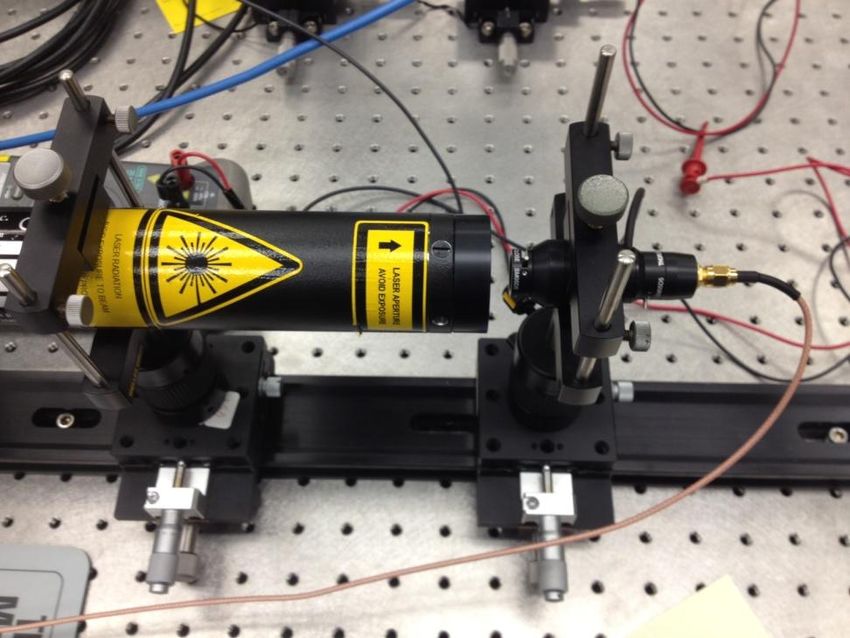
Images courtesy NASA

            6
Warp Field Interferometer
                                                                                         •      Warp Field Interferometer developed after
                                                                                                putting metric into canonical form1:

                                                                                                                                             2
                                                                                                    2                 vs f (rs )
                                                                                        ds 2 (vs f (rs ) 2   1) dt   2
                                                                                                                                  dx                 dx 2 dy 2 dz 2
                                                                                                                   vs f (rs ) 2 1

                                                                                         •      Generate microscopic warp bubble that
                                                                                                perturbs optical index by 1 part in
                                                                                                10,000,000
                                                                                         •      Induce relative phase shift between split
                                                                                                beams that should be detectable.

     X ( x, y)                        X 1 ( x, y )                                                                        M ( x, y )e j   ( x, y )

                                                                                           2D Analytic
                                                                                             Signal
       Numerical simulation              Numerical simulation                              processing
       of fringe at detector             of fringe at detector                                                            Numerical simulation
          with device off                   with device on                                                                 of contour plot of
                                                                                                                              for warp field   7
1.     White, H., “A Discussion on space-time metric engineering,” Gen. Rel. Grav. 35, 2025-2033 (2003).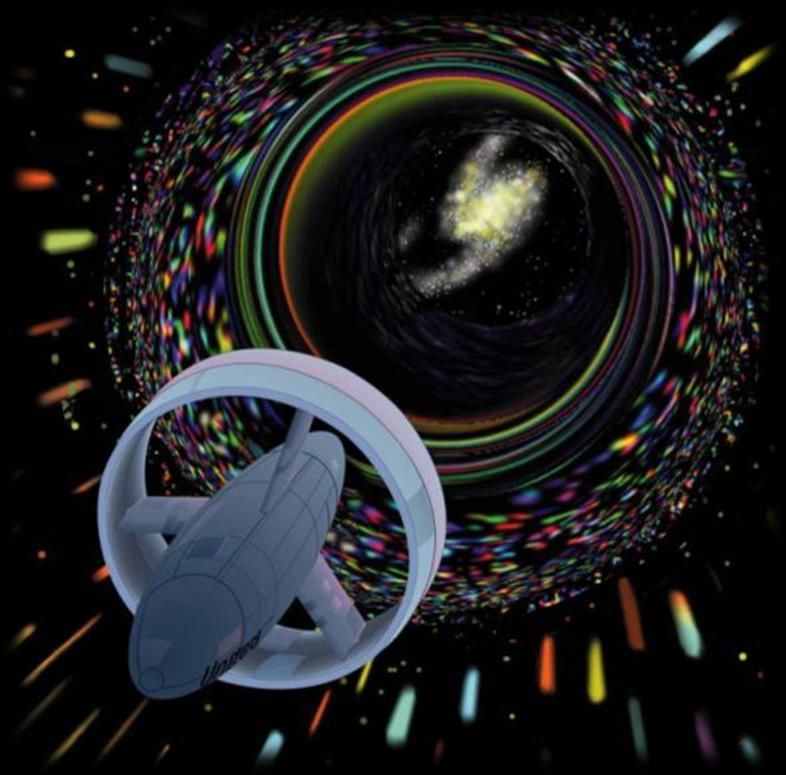
Warp Bubble Detection Attempts Using
                 Interferometry
• Goal is to use interferometer to detect and measure
  effect of warp bubble on optical path length through
  the measurement of associated interference fringe
  shifts.
• The EWL has attempted to mitigate the effect of
  vibrations & air currents
   –   Using a vibration-isolated optical table
   –   Using a vibration-isolated room
   –   Using an optical hood
   –   Using signal processing to increase signal to noise ratio
   –   Collecting statistical data to increase signal to noise ratio

                                                                       8
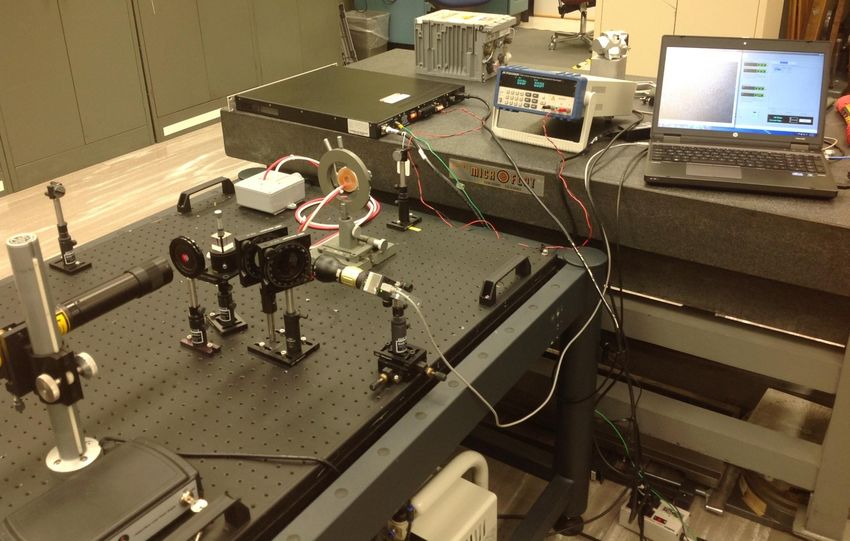
Eagleworks Optics Laboratory

Low-fidelity
 test article

                                           Time of Flight
                                            Experiment

                            Warp field
                          Interferometer
                                                            9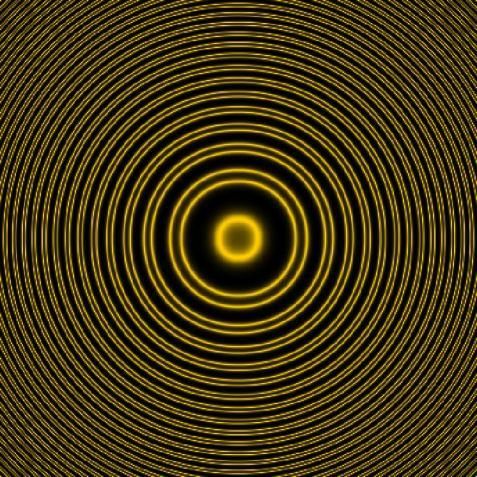
Interferometer and Test-article Setup

         Beam
         splitter

  Iris

              2 Polarizers
              (jointly used for
              intensity
              control)

                                    10
Isolated Lab
Panel Overview
Primary/Auxiliary
Feed Air
Isolator pressure
Height control pressure
11SINGLE PATCH
INTERFEROMETER MODAL ANALYSIS,
ANALYTIC SIGNAL VARIATION
12Interferometer Modal Analysis:
Synthetic Data
• A set of 1000 synthetic interferogram fringe patterns were generated as JPEG image
frames
– Set contained repeating sequence of 10 frames with sinusoidal shifting in time with a
shifting amplitude of 1/10 of a spatial radian*. Fringe pattern repeatedly
– No noise added to the shifting (i.e. unwanted vibrations not included) shifted up and down along
– Gray scale intensity sampled at upper left pixel and a Discrete Fourier Transform (DFT) this axis
calculated for the sample train.
– Very strong peak observed at 1/5 Nyquist frequency as expected, and of course, no noise
spectrum.
DFT Magnitude Spectrum
Strong peak observed at the
excitation frequency (1/5
Nyquist frequency)
Shifted up and
to the left
Frequency
2 fringe patterns out of set of 1000, showing maximum shift amplitude Conclusion: Small, repetitive shifts in fringe lines can be
(In this case, the fringe pattern on the right is shifted about 1 radian up
easily detected with a temporal DFT approach. 13
and to the left compared to the fringe pattern on the left.)Modal Analysis: Analytic Signal Variation,
Single Patch
2D DFT of the dashed region
Calculate DFT of this 128x128
region centered at arrow tip.
The result is an array of complex values, called the analytic signal. Now, set all DFT coefficients to
Use the complex value at the center and calculate the “phase”. zero except for this small
Repeat for all of the captured frames and store the representative region around this peak
phase values as a 1D series. corresponding to the fringe
lines, and inverse transform.14Single Patch Modal Analysis,
always off
Test Article Off
Magnitude Spectrum of Phase Series
15Single Patch Modal Analysis,
cycled on/off
•Test article cycled on and off at .25 Hz, and associated
fringe images frame sampled at 2.5 Hz for 3149 samples.
•Any effect should show up at frequency 315.
•Nothing around that frequency stands out above the noise
for this run.
•No evidence that the test article caused fringes to shift at
this measurement precision.
•Concern that single patch may not sample enough of
image, so subsequent effort done to sample across image.
Magnitude Spectrum of Phase Series
16MULTIPLE SAMPLE POSITIONS
INTERFEROMETER MODAL ANALYSIS,
ANALYTIC SIGNAL VARIATION
17Description of Work
• Room and table were floating
• Optical hood covering table
• Test article cycled on every 4 seconds
• Frames captured every 0.4 seconds
• 3149 frames processed
• Sampling occurred at 88 positions in image plane
• At each pixel sampled (through 3149 frames), the
sample train was Fourier transformed, and the
magnitude spectrum reviewed (see next slides)
18Test Article Off
Magnitude Spectrum of Phase Series
Magnitude
Frequency 19Test Article Cycled every 4 Sec
(2 sec @ 20KV, 2 sec off)
Magnitude Spectrum of Phase Series
Are these bumps actual differences w.r.t. test article
Magnitude
“off”?
- Or are they always present, but affected differently
by noise between runs?
Frequency 20Close up (off)
21Close up (cycled)
22Air Dielectric in Beam Path
• Cap ring replaced with high-voltage device "Ozona" such that
the charge collection sphere partially blocked the interferometer
beam in the leg along the laser axis.
• High voltage source was cycled on and off in 2 second intervals.
• The screen capture was operating at a rate of 0.4 sec per frame.
• The optics table was
floating but not the
room.
• The optics table was
not covered.
• HV source power
strip was on the
micro flat table next
to the interferometer
table.
23HV Power Supply Off
24HV Power Supply Cycled @ 2 second
Intervals
25DAN NEHLICH, SOUTH DAKOTA STATE UNIVERSITY
INTERFEROMETRY MEASUREMENTS
OF A DC TOROIDAL CAPACITOR
26SDSU Interferometer Setup
DC Toroidal Capacitor Test Article
Interference Pattern
Warp Field Interferometer
27Image Subtraction Approach
• Positing that aberrations may include fringe pattern shifting in
addition to or instead of induced curvature in the patterns, image
subtraction was used to determine possible correlations to the
voltage differential.
– This method treats each image as an array and subtracts that array
from the preceding, resulting in an image representative of the shift
that occurred.
– Average intensity of each subtracted image is calculated and statistical
comparison is performed.
– Statistical analysis of mean intensity values of each subtracted image,
showed the observed shifts tended to increase during
charge/discharge cycles, and remain constant in the control runs.
• The data presented in these scatter plots represents 2200 unique
data points for charge/discharge cycles at 19 kV.
• Each point plotted represents approximately 20 images taken at the
same point of the cycle, yielding an average intensity for each point
in time along the graph.
28Control, Charge, Discharge Scatter Plots
control
d
charge ?
dt
discharge
29Hough Transform Approach
• In order to establish a direction of fringe
pattern shifting, edge detection
algorithms were necessary to determine
individual line locations.
• The Hough Transform, along with the
associated houghpeaks and houghlines
functions in Matlab, was utilized to this
end.
Hough Line Representation
• An algorithm was written to utilize the
edge mapping function of the transform,
determine the distance of each line to
the origin (normal to the fringe
orientation) and then sort and weight
the data to provide the relevant fringe
locations for analysis.
Hough Transform with Peaks
Average Shifts of Interference Pattern 30ENHANCED WARP FIELD PHYSICS EXPERIMENTS
IMAGE AVERAGING, FABRY-PEROT
INTERFEROMETER, & TIME OF FLIGHT
31Single Image
32Averaged Image
33Fabry-Perot Warp Field Interferometer
Front Back
Mirror Mirror
Imager Laser
DC or (preferably) AC
Test Article
Example: Michelson-Morley • Consists of two reflecting, Example: Fabry-Perot
Interferometer image for highly parallel surfaces, called Interferometer image for
Sodium source an Etalon Sodium source (note doublet)
• The interference pattern is
created within the Etalon
• Multiple reflections in the
Etalon reinforce the areas
where constructive and
destructive interference
occurs
• Allows for much higher-
precision measurements of
fringes (image averaging
without software) 34Fabry-Perot Experiment
He-Ne Laser
SA-210 Scanning Fabry-Perot
Interferometer
35Time of Flight Schematic
~200MHz test device
Polarizer
HeNe
Beam EO Modulator
Splitter Newport Broadband Amplitude Modulator
Model 4102NF
~12” Type Broadband Amplitude Modulator
Operating Frequency DC-200 MHz
Mirror
Wavelength Range 500-900 nm
Detectors Thorlabs High-Speed Avalanche Detector Material MgO:LiNbO3
Model APD210
Maximum Vπ 195 V @ 633 nm
Rise Time 0.5 ns
Supply Voltage +12 to +15 V Maximum Input Power 2 W/mm2 @ 532 nm
Current Consumption 200 mA Aperture Diameter 2 mm
Max. Incident Power 10 mW RF Bandwidth 200 MHz
Spectral Range 400 – 1000 nm RF Connector SMA
Frequency Range 1-1600 mHz Input Impedance 10 pF
Maximum RF Power 10 W
Maximum Gain 2.5x10⁵ V/W
Connector SMA
Agilent Technologies Infiniium DSO9254A 2.5 GHz Oscilloscope
•2.5 GHz bandwidth across all 4 analog channels
•20 GSa/s max. sample rate
•Standard 20 Mpts memory per channel, upgradeable to 1 Gpts 36Time of Flight Experiment
37Forward Plan
• DC Toroidal Capacitor Approach:
– Work with larger sample sets to decrease effects of vibrational “noise”, and
develop test articles with longer regions of optical influence to increase the
signal.
– Utilize image averaging algorithms to increase fidelity of interference
information.
– Utilize the Fabry-Perot Interferometer to increase the sensitivity of the
experimental apparatus to below 1/100 of a wavelength.
• Explore the d /dt dependency in future test devices
– The idea of an optimized space warp needs negative vacuum energy, and large
d /dt - both of these conditions are present in the q-thruster technology also
being explored in the lab.
– Use the q-thruster physics models to guide design of RF frequency test devices
to be evaluated in the warp field interferometer, the Fabry-Perot
Interferometer, and the time of flight experiment.
38Q-Thruster
39
• Q-thrusters are a low-TRL form of electric propulsion that operates on the
principle of pushing off of the quantum vacuum.
• A terrestrial analog to this is to consider how a submarine uses its propeller to
push a column of water in one direction, while the sub recoils in the other to
conserve momentum – the submarine does not carry a “tank” of sea water to be
Casimir force used as propellant.
• In our case, we use the tools of Magnetohydrodynamics (MHD) to show how the
thruster pushes off of the quantum vacuum which can be thought of as a sea of
virtual particles - principally electrons and positrons that pop into and out of
existence, and where fields are stronger, there are more virtual particles.
• The idea of pushing off the quantum vacuum has been in the technical literature
for a few decades, but to date, the obstacle has been the magnitude of the
predicted thrust which has been derived analytically to be very small, and
0.4N/kW test article therefore not likely to be useful for human spaceflight.
• Our recent theoretical model development and test data suggests that we can
greatly increase the magnitude of the negative pressure of the quantum vacuum
and generate a specific force such that technology based on this approach can be
competitive for in-space propulsion (~0.1N/kW), and possibly for terrestrial
applications (~10N/kW).
• As an additional validation of the approach , the theory allows calculation of
physics constants from first principles: Gravitational constant, Planck constant,
Quantum Bohr radius, dark energy fraction, electron mass.
Vacuum
MHD
39Q-thruster Physics Data
2004 Test Article 2005 Test Campaign 2012 Test Article
1 2 3
The test unit was run at 2.13 MHz, yielding an AC electric field
of ~20kV/m, and an AC magnetic field of ~27 Gauss. 2012 test article tested in November
• Based on the input parameters, the QVPT thrust prediction was 2012
0.63 mN
• The observed thrust was +/- 0.89 mN
2012 test article tested -> 98uN
predicted, 2-3 uN detected
The test unit was run at 3.8 MHz yielding an AC electric field • Scientifically very significant as vacuum
of ~20kV/m, and an AC magnetic field of ~48 Gauss. fluctuation density had to be increased from
• Based on the input parameters, the QVPT thrust prediction was ~1x10-26 to > 1x10-14
2.79 mN • As built quality factor much lower than
• The observed thrust was +4.91 to -1.96 mN as measured via a desired, more engineering work necessary
4900 mN (500gf) load cell • Adjustment to power distribution network
are in work to address power losses,
As can be seen to the right, the thrust signal is very clear increase thrust level
when the unit is excited.
~4 mN Thrust ~3 mN Thrust
Specific Force ~0.4N/kW Specific Force ~0.3N/kW ~vacuum fluctuation density
increased from 1x10-26 to >1x10-14
1 2
SFE Test Article at JSC Microwave Thruster Device Cannae Test Article
5 6 7
Aviation Week, 5 Dec 2012 SPR Ltd. Has produced several Microwave test articles. Claim is they produce At DARPA’s request, Eagleworks Lab began discussions with
In 2013, Boeing/DARPA sent Eagleworks Lab an SFE thrust with just electric power input. Cannae LLC on hosting a test article
test article for testing and evaluation • Shawyer’s theoretical model has been deemed
non-viable by scientific community (rightly so) Cannae’s “Q-Drive” design is inspired by RF resonant cavity
Evaluation of the test article in and out of a Faraday design used in particle linear accelerators
Shield performed from Feb through June 2013. Thruster assessed against Q-thruster models and
• Utilizes an asymmetric superconductive Niobium-Tin resonant cavity
analysis suggests this may be a microwave
• There is a consistent transient thrust at device version of a quantum vacuum plasma thruster.
• Cannae theoretical model is likely non-physical.
Initial assessment of conditions in thruster during operation First Generation Test Article
turn-on and turn-off that is consistent with Q- • Tapered shape creates virtual toroid of active volume Prototype 16mN @ 850W,
thruster physics that can realize net thrust in virtual plasma. 0.02N/kW indicate it may be a high frequency q-thruster.
• Microwave Q-thrusters would not be restricted to
• The magnitude of the thrust scaled tapered construction.
approximately with the cube of the input May 30,SFE
Anomalous Thrust Pulse Amplitude while
Test Article in Faraday Shield Thrust magnitude increased over multiple test
On/Off Switching at 20kV, pg-1
voltage (20-110uN). devices from 16 to 170mN
Microns
• The magnitude of the thrust is dependent on Peak + Current at 20kV: ~331nA
Peak - Current at 20 kV: ~280nA ~110uN Anomalous Turnoff Pulse with If Q-Thruster theory accounts for measured Cannae Test Facility
Average On/Off thrust pulse= 19.9uN 7 same peak input power implies: ~18.0
the AC content of the turn-on and turn-off pulse Specific Thrust = 3.25 N/kWe N/kWe. force, then microwave test articles may Dynamic Test Article 96mN @
3 4 5 6 8
have ability to reach >10N/kW 334W, 0.3N/kW
• Specific force of transient thrust was in the ~1-
Note 2-Cycle ~Constant
75V Cal Chinese university claims to have duplicated
20 N/kW range. Amplitude Ring ~12.6uN
EM Drive tests , but no way for U.S. to
196 Seconds (5.1 Points/sec at 2048 Samples/Point)
evaluate credibility (so we have ignored it)
~20-110 uN Thrust Pulses (2048 Samples/point, 5.1 points/sec)
16-170 mN Thruster ~7-10 mN Thruster
Specific Force ~1-20N/kW
June 2013
Second Generation Test Article
55
Specific Force 0.02-0.4N/kW High fidelity Test Article 170mN Specific Force ~0.75N/kW (under development)
@ 450W, 0.4N/kW
5 6 7
What we suspect:
• A variety of industry experiments, for which theory is lacking, may be Q-thrusters
including Boeing, Lockheed-Martin, EM Drive, Cannae, etc.
• Low measured thrust but specific power ranges from 0.3 to 10+ N/KW 40Q-thruster Roadmap
~10N/kW
Outer solar system exploration & beyond
In-space
Space-lift
Aero
?N/kW Blimp Test
Space
Tugs
In-space
ISS Demo
(CMG perturbation)
ISS Free Flyer
COTS Free Flyer
Class D Mission
~0.1N/kW 41Q-THRUSTER + 2MW NUCLEAR POWER IS MISSION ENABLING
POSSIBLE MISSIONS TO MARS, THE
OUTER SOLAR SYSTEM, AND BEYOND
WITH Q-THRUSTERS
42Mars
70 days stay
90 day stay
66 days
22 days
28 days
110 days
• 90t spacecraft • 90t spacecraft
• 2MW power • 2MW power
• 0.4N/kW (800N) • 4N/kW (8000N)
• 246 day mission with 70 day stay at • 140 day mission with 90 day
Mars stay at Mars
43Jupiter
0.4 N/kW 4 N/kW
194 days 61 days
• 90t spacecraft
– 50t cargo, 20t power,
20t propulsion
• 2MW power
44Saturn
0.4 N/kW
263 days 4 N/kW
86 days
• 90t spacecraft
– 50t cargo, 20t power,
20t propulsion
• 2MW power
45Uranus
0.4 N/kW
399 days 4 N/kW
129 days
• 90t spacecraft
– 50t cargo, 20t power,
20t propulsion
• 2MW power
46Neptune
0.4 N/kW
4 N/kW
492 days
160 days
• 90t spacecraft
– 50t cargo, 20t power,
20t propulsion
• 2MW power
47Pluto
0.4 N/kW 4 N/kW
518 days 167 days
• 90t spacecraft
– 50t cargo, 20t power,
20t propulsion
• 2MW power
481000 AU
0.4 N/kW 4 N/kW
5.6 years 1.8 years
• 90t spacecraft
– 50t cargo, 20t power,
20t propulsion
• 2MW power
49PROXIMA CENTAURI
0.4 N/kW 4 N/kW
122.5 years 29.9 years
• 90t spacecraft
– 50t cargo, 20t power,
20t propulsion
• 2MW power
50Original Matthew Jeffries concept from mid
1960’s, rendered by Mark Rademaker
Matthew Jeffries is the artist that created the familiar Star Trek enterprise
look
51Updated concept based on Dr. White’s theoretical findings, rendered
by Mark Rademaker with artwork and inputs from Mike Okuda
52Updated concept based on Dr. White’s theoretical findings, rendered
by Mark Rademaker with artwork and inputs from Mike Okuda
5354
Principles of Q-thruster Operation
• Local mass concentrations, say in the form of a
conventional capacitor with a ceramic dielectric,
affect vacuum fluctuation density according to v _ local v
m _ local
m _ local v
(1)
equation 1 v
2
• Just as relativistic acceleration (Unruh radiation) can 1 1 da 1 d 2a
change the apparent relative density of the vacuum, 4 G a 2 dt a dt 2
so too can higher order derivatives according to
equation 2. 2
a
1 1 d 1 d2
4 G 2
dt dt 2 (2)
• The tools of MagnetoHydroDynamics (MHD) can be
used to model this modified vacuum fluctuation
density analogous to how conventional forms of
electric propulsion model propellant behavior.Gravitational Coupling Constant
• Consider the following thought experiment: what would an inertial observer in deep space find if
the dark energy density were to be integrated over the light horizon of the observable universe,
~13.7 billion light years?
• Starting with the Friedman Equation (and after some manipulation), the following equation can be
derived that formally captures the results of this thought experiment:
2 2 2 2 c4
Vacuum Energy
Density 0 c 4 c tH
3 G
Equation can be
rearranged into the 1
following form
G 2 2
4 tH 3 0
• Using 9.9x10⁻²⁷ kg/m3 [2] with tH of 13.7 billion years yields a predicted
value for the gravitational constant of 6.45x10⁻¹¹ m3/kg·s2
• A possible physical meaning to this rearranged equation solved for G is
that gravitation is an emergent phenomenon rather than a fundamental
force.
• To be specific, the claim could be made that the gravitational coupling
constant may be a long wavelength consequence ( =ctH) of dark energy.
Light horizon
Dr. Harold “Sonny” WhiteBohr Radius
• The vacuum perturbation equation just derived can be used to evaluate the state of the
quantum vacuum in close proximity of the proton at the center of the Hydrogen atom.
• The first step is to calculate a quasi-classical density for the hydrogen nucleus. The radius of
the hydrogen atom nucleus is given as R0=1.2x10⁻¹⁵m (R=R0·A1/3 where R0 = 1.2x10⁻¹⁵m and A is
the atomic number - these are experimentally determined by electron scattering).
• The radius can be used with the mass of a proton to calculate a quasi-classical density of the
hydrogen nucleus:
mp kg
m 3
2.31x10¹⁷
4
3 R0 m3
• Using ρv=2/3 * 9.9x10-27 kg/m3, along with this quasi-classical density m, the perturbed negative
pressure state of the quantum vacuum around the hydrogen nucleus is calculated to be:
5 kg
v _ local m v 3.90x10
m3
• The question can be asked how much volume of this perturbed state of the quantum vacuum
is needed to have the equivalent energy value as the ground state of Hydrogen (13.6eV or
2.18x10⁻¹⁸ Nm)
1
3
E
r 2
a0
v _ local c 4
3
• The calculated radius is r = 5.29x10⁻¹¹ m, which is an exact match to the given value for the
Bohr Radius, a0 = 5.29x10⁻¹¹ m.
Dr. Harold “Sonny” WhiteElectron Mass
• Frank Wilczek, Nobel laureate: “We have achieved a beautiful and
profound understanding of the origin of most of the mass of ordinary
matter, but not of all of it. The value of the electron mass, in particular,
remains deeply mysterious…”
• Consider the energy state of the perturbed quantum vacuum field around
the proton, and set this equal to the kinetic energy of the orbiting electron
at the ground state.
4 3 2 1
a0 v _ local c me v 2
3 2
• We know the speed of the orbiting electron:
v c c / 137
• We can solve for the electron mass, and using the predicted value for
-5 3 -31
v_local of 3.9x10 kg/m , we get a predicted electron mass of 9.1x10 kg.
8 3 2
a0 v _ local c
me 3
2
c
137
Dr. Harold “Sonny” WhiteMagnetic Pressure
• The first step now is to calculate the magnetic pressure around the Hydrogen
nucleus.
The magnetic field as perceived by The magnetic pressure is a
the electron is given by the 0 qv simple calculation:
following relationship. The speed of
B 2 B 2
the orbiting electron is c.
4 a0 6.25x10⁷ N
m2
2 0
• The quasi-classical plasma pressure of the perturbed quantum vacuum state
around the Hydrogen nucleus can be calculated by converting the electron velocity
to temperature using 1/2 mev2=kT, and making the assumption that the virtual
electron-positron plasma has the same effective temperature as the orbiting
electron.
• When the plasma pressure calculation makes use of a 2/3 factor, analogous to the
predicted dark energy fraction of 2/3 picked up during integration to calculate the
Gravitational constant, the values are nearly identical:
2 v _ local
P ne kT kT 6.24x10⁷ N m2
3 me
Dr. Harold “Sonny” WhiteYou can also read