WEATHERSMART NEWS - South African Weather ...
←
→
Page content transcription
If your browser does not render page correctly, please read the page content below
WEATHERSMART
         NEWS         Scientific meteorological and climatological
                      news from the South African Weather Service

February 2021
CLIMATE EXTREMES AND RECORDS IN THE NON-
STATIONARY CLIMATE OF SOUTH AFRICA

SOUTH AFRICAN WEATHER SERVICE LAUNCHES THE
REGIONAL WMO INTEGRTED GLOBAL OBSERVING
SYSTEM CENTRE (RWC-SA) ON 9 FEBRUARY 2021

AVIATION FORECASTS AS A RESULT OF TROPICAL
CYCLONE GUAMBE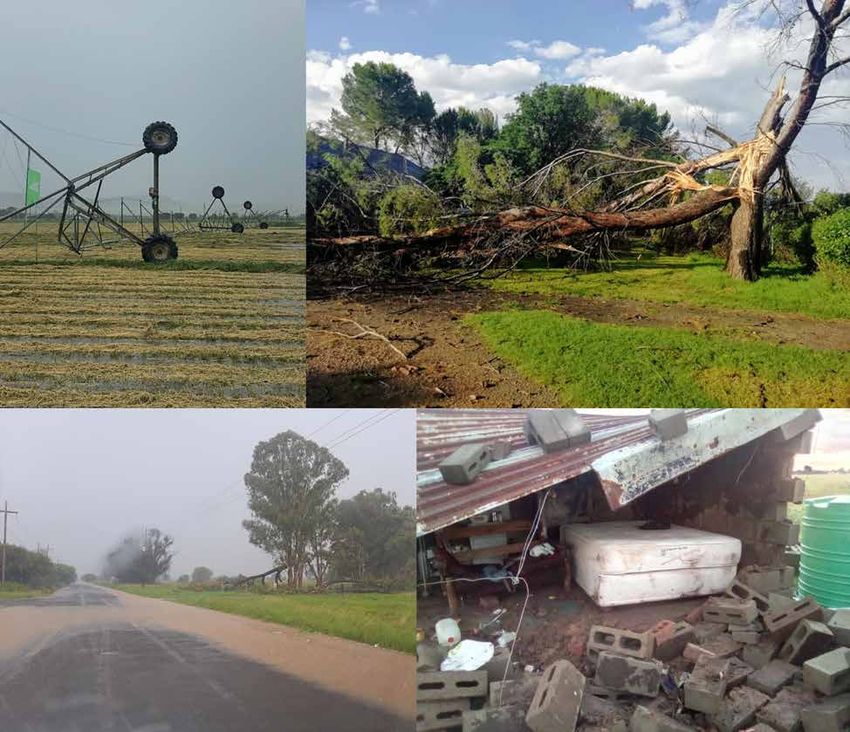
WEATHERSMART
               NEWS                            Scientific meteorological and climatological
                                               news from the South African Weather Service

                                    Impact-Based
                            Severe Weather Warning System
                                     WHAT IS IMPACT-BASED FORECASTING?

Severe weather is a regular occurrence across South Africa which often negatively affects humans. Due to the vast
distribution of vulnerabilities across the country, the same weather hazard can result in different impacts in two
areas, depending on the specific vulnerability of the area.

Impact-Based warnings combine the level of impact the hazardous weather conditions expected with the level of
likelihood of those impacts taking place

                  Moving from                                                       To

               What the weather will be:                                What the weather will do:
              (Meteorological thresholds)                                    (Impact Warnings)
          - 50mm in 24 hours - 35 knot winds                       - Roads flooded - Communities cut off

               Date of issue:
               February 2021

               Frequency:
               6 Monthly

               ISSN:                                                      Publisher:
               2414-8644                                                  South African Weather Service
                                                                          Address:
               Editorial team:                                            Eco Glades Block 1B, Eco Park,
               Hannelee Doubell (Compiler and editor)                     Corner Olievenhoutbosch and
               Musiiwa Denga (Assistant editor)                           Ribbon Grass Streets,
               Nokuthula Dhlamini (Assistant editor)                      Centurion, 0157

2           WeatherSMART News February 2021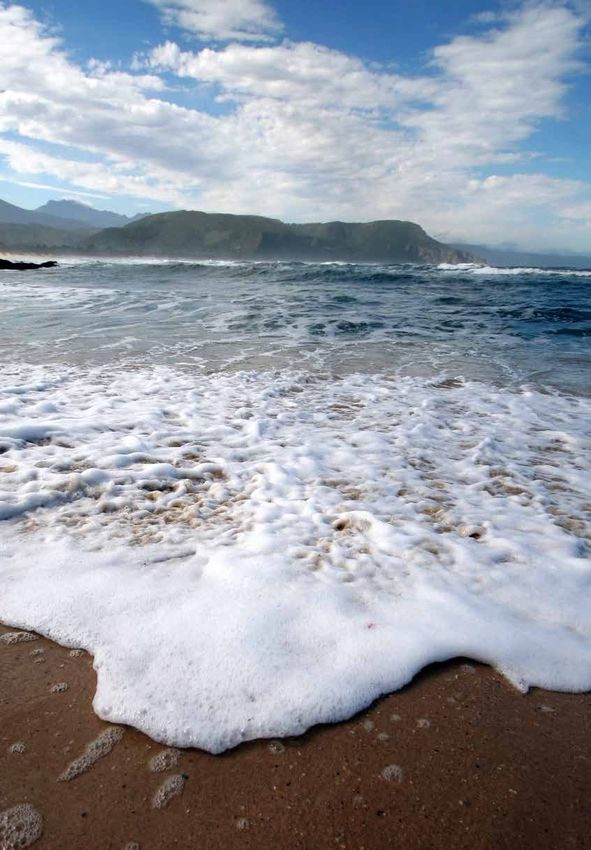
TABLE OF
CONTENTS
Message by the Acting Chief Executive Officer ................................................2

Doing our part to sustain ocean observations globally
by Tamaryn Morris............................................................................................3

Climate Extremes and Records in the Non-Stationary Climate of South Africa
by Charlotte McBride and Andries Kruger.........................................................5

Determining the type of severe thunderstorm that developed north-west of
Bram Fischer International Airport, Bloemfontein on 20 January 2021
by Elani Heyneke and Tshifhiwa Ravele...........................................................12

SOUTH AFRICAN WEATHER SERVICE LAUNCHES THE REGIONAL WMO
INTEGRTED GLOBAL OBSERVING SYSTEM CENTRE (RWC-SA) ON 9 FEBRUARY
2021
by Francis Mosetlho........................................................................................21

Aviation forecasts as a result of Tropical Cyclone Guambe
by Hetisani Oscar Shiviti - Forecaster: (Aviation Weather Center)...................22

Meet the Authors...........................................................................................29

                                                              WeatherSMART News February 2021                    1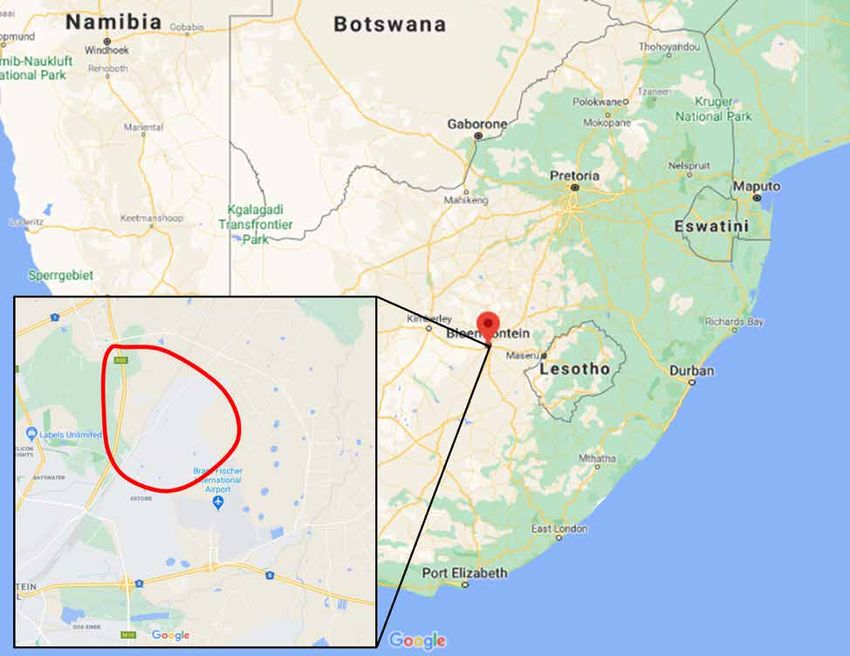
Message by the Acting Chief Executive Officer
This is the sixth year of the South African Weather Service   excess heat, they are critical natural assets in the
producing the bi-annual WeatherSMART newsletter,              mitigation of global climate change. The South African
having been incepted in 2016. We are extremely proud          Weather Service monitors and forecasts the coastal
that this initiative is still continuing.                     ocean conditions around South Africa. It also conducts
                                                              research toward better understanding coastal ocean
As World Meteorological Day is celebrated annually all        systems to aid short-term decision making and long-
over the world by countries forming part of the World         term change management.
Meteorological Organization (WMO), a Specialised
Agency of the United Nations, I thought it appropriate to     With Climate Change occurring at a rapid pace, its
give a short background on this day.                          influence on our local weather systems, as well as over
                                                              larger areas, require the South African Weather Service
The WMO was established by means of the United                to be at top performance in terms of its service delivery.
Nations Convention on the World Meteorological                This newsletter touches on our ocean meteorological
Organization in 1950, as the successor of the                 activities; Climate Extremes and Records in the Non-
International Meteorological Organization, created in         Stationary Climate of South Africa as well as the in the
1873. WMO’s mission is to support the countries of            oceans, as well as recent severe weather events.
the world in providing meteorological and hydrological
services to protect life and property from natural            I hope you find this edition of the WeatherSMART
disasters related to weather, climate and water, to           scientific newsletter informative and enjoyable.
safeguard the environment, and to contribute to
sustainable development.

Each year, the World Meteorological Day celebrations          Mnikeli Ndabambi
focus on a theme of topical interest. The theme for           Acting Chief Executive Officer
2021 - The ocean, our climate and weather – celebrates
WMO’s focus in connecting the ocean, climate and
weather within the Earth System. It also marks the
launch of the United Nations Decade of Ocean Science
for Sustainable Development (2021-2030), which will
enable us to better understand the link between ocean,
climate and weather, in order to help us understand the
world in which we live in, including the impacts of climate
change, and strengthen our ability to protect lives and
property, reduce the risk of disaster, and maintain viable
economies.

The global oceans cover 70% of the earth. They carry 90%
of world trade, constitute one of the world's largest food
sources, and host 40% of world's population along their
coastlines. The oceans drive our weather and climate,
producing frontal systems, modulating precipitation,
and influencing storm tracks and intensities. With the
oceans having taken up over 90 % of human-induced

2            WeatherSMART News February 2021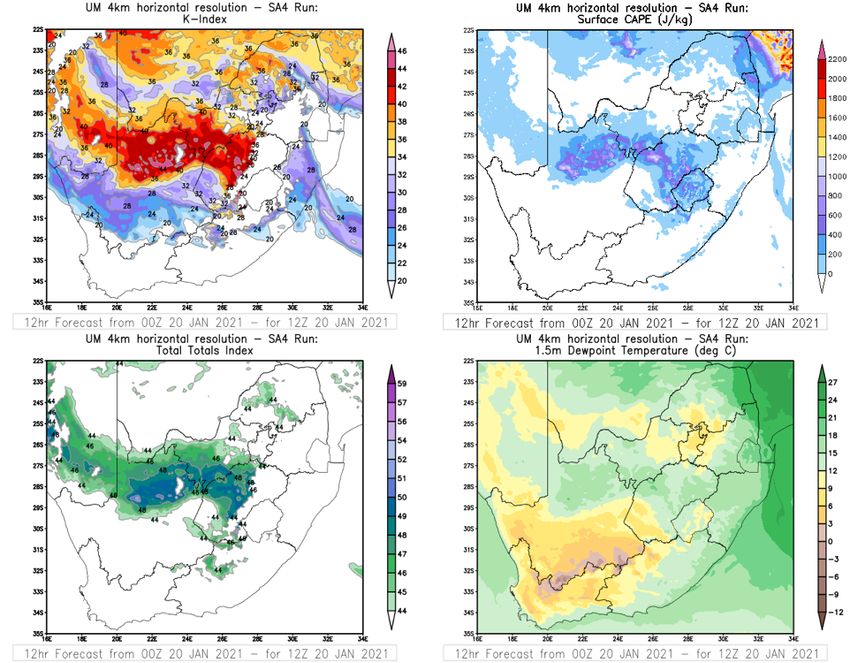
Doing our part to sustain ocean
                      observations globally
                                             by Tamaryn Morris

    “If you like your weather forecast,                 abundance of highly developed industrialised
                                                        nations. That being said, South Africa is uniquely
         thank an oceanographer”
                                                        placed globally between three major ocean
Ocean observations are critically important not         systems (Indian, Atlantic and Southern Oceans)
only for the continuous monitoring of ocean health      and on our doorstep is the gateway for warm
and the resultant implications of climate change        salty Indian Ocean water entering the cold fresh
on these vast bodies of water, but also for use in      South Atlantic. This transport of water is critical for
weather and climate forecasting systems. Every          the Northern Hemisphere climate, which brings
day, thousands of instruments deployed within           warmer conditions to the United Kingdom and
the global oceans are collecting and transmitting       Europe, without which they would exist in an almost
data to land-based stations for processing and          perpetual freeze. The SAWS Marine team members
dissemination to the Global Telecommunications          are strongly involved with a number of the ocean
System (GTS), and are used by various research and      observing platforms and the international panels
forecasting groups to produce global numerical          that monitor and encourage these continued
weather predictions. These ocean data come from         deployments globally. As such, we are ideally placed
instruments such as moored surface expression           to assist with deploying ocean observing systems as
buoys close to coastlines transmitting automatic        part of our take-over and research cruises.
weather station (AWS) data, from tide gauges, and
commercial, sailing and research vessels equipped
with data acquisition systems, both atmospheric
and oceanographic, which are transmitting
continuously along major shipping routes. Less
well-known ocean observing systems include
drifting buoys (www.aoml.noaa.gov/phod/gdp),
tethered by sea anchors to the upper 15 m of the
water column, which collect barometric pressure
and sea surface temperature, and have recently
been improved to collect wind speed and direction
and wave parameters. Similarly, Argo floats (www.
argo.ucsd.edu), autonomous ocean robots which
collect temperature, salinity and pressure, profile
the water column every ten days from depths of
2000 m to the surface. These free-floating ocean
observing systems are not constricted by shipping
lanes for data acquisition, thereby increasing the
availability of data across the world’s oceans to the
GTS system.
The Southern Hemisphere is severely understudied
owing to the reduced landmass and greater
oceanic expanse when compared to the Northern
Hemisphere, and the concentration of observing
capacity in the Northern Hemisphere, due to the
                                                        Photo 1: Bosun assisting with the deployment of a SOLO II Argo float
                                                        from the stern of the SA Agulhas II. Photo credit: Lauren Smith

                                                              WeatherSMART News February 2021                           3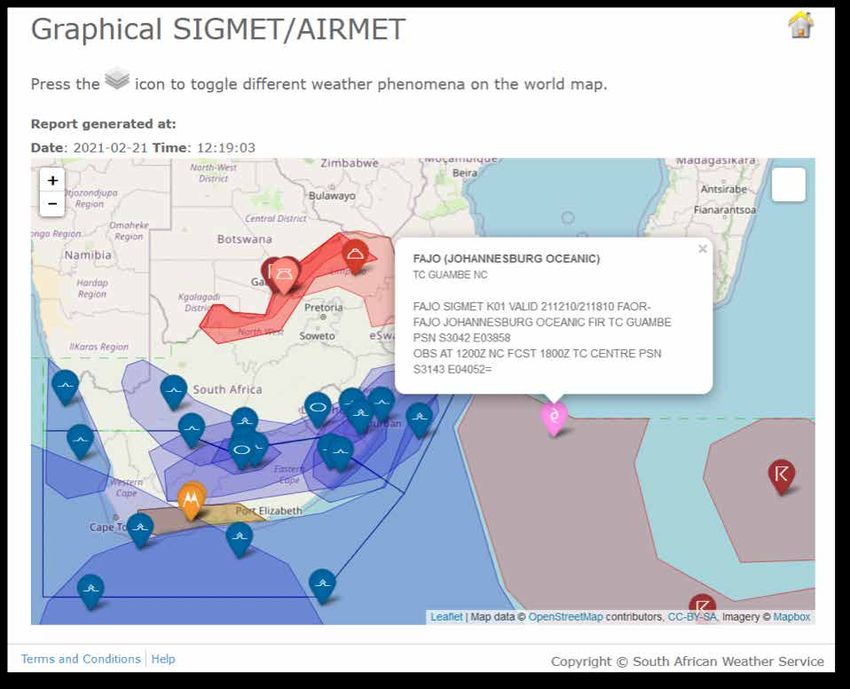
SAWS is not in a position                                                                       leg of the take-over cruise,
to procure satellite-tracked                                                                    with the rest scheduled
drifters or Argo floats, given                                                                  for deployment as the
not only the costs of the                                                                       vessel makes its way back
infrastructure itself but                                                                       to Cape Town at the end of
also the satellite data time                                                                    February 2021. Arguably,
required. However, excellent                                                                    weather systems directly
working relationships exist                                                                     south of South Africa will
between our team and                                                                            not impact our country
the National Oceanic and                                                                        directly. However, they
Atmospheric Administration                                                                      impact Marion Island, and
(NOAA), SOFAR Ocean                                                                             the valuable data these
(www.sofarocean.com), the                                                                       observations acquire close
UK Met Office, Euro-Argo,                                                                       to the Marginal Sea Ice Zone,
Woods Hole Oceanographic                                                                        and severely understudied
Institute (WHOI) and the                                                                        Southern Ocean, input to
Federal      Maritime      and   Photo 2: Lauren Smith (SAWS), Asavela Somaxaka (SAWS)          our forecasts with regards
Hydrographic Agency of           and Zinhle Shongwe (DEFF/SAWS) preparing a satellite           our MetArea VII obligations.
Germany, all of whom sent        tracked surface drifter for deployment. Photo credit: Lauren
observing platforms to           Smith                                                          Captain Craig McLean,
South Africa for deployment                                                                     NOAA’s       Acting    Chief
in our oceans. On the Gough                                                                     Scientist, said it best
(September 2020) take-over                                                                      during his opening address
cruise, six Argo floats and                                                                     at the OceanObs ’19
four satellite tracked surface                                                                  conference, “If you like
drifters were deployed as                                                                       your weather forecast,
the SA Agulhas II transited                                                                     thank an oceanographer”.
to Gough Island. This vessel                                                                    Understanding the oceans
track is critical to our own                                                                    surrounding South Africa,
                                 Photo 3: Lauren Smith (SAWS) and Zinhle Shongwe (DEFF/         and indeed the full extent
weather predictions, given       SAWS) deploying the satellite tracked surface drifter from
that     weather      systems    the stern of the vessel. Photo credit: Lauren Smith
                                                                                                of MetArea VII region
impacting the Western and                                                                       which is our responsibility,
Northern Cape develop                                                                           is critical to the work we
in the South Atlantic and                                                                       do at the SAWS. One of
Southern Ocean.                                                                                 the ways in which we do
                                                                                                this is to collaborate with
In December 2020, the SA                                                                        international teams, along
Agulhas II left Cape Town                                                                       with DEFF Antarctica and
for Antarctica on the SANAE                                                                     Islands, to deploy ocean
take-over cruise with 28                                                                        observing systems, as far
Argo floats, six satellite-                                                                     and as wide as possible.
tracked surface drifters and
15 SOFAR Ocean Spotter                                                                          This work has been
surface     buoys,     which                                                                    made possible with the
collected wave height,                                                                          deployment assistance of
along with wind speed                                                                           the scientific teams involved
and direction data, over                                                                        with the Gough 2020 and
and above tracking surface                                                                      SANAE 2020/2021 teams,
currents. Roughly half of                                                                       along with the Captain,
these instruments were
                                 Photo 4: Thando Mazomba (UCT), Menthiam Sebesho                officers and crew of the SA
                                 (SAWS) and Kelcey Maewashe (UCT) preparing an NKE Argo
deployed on the southward                                                                       Agulhas II.
                                 float for deployment. Photo credit: Kelcey Maewashe

4           WeatherSMART News February 2021
Climate Extremes and Records in the Non-
          Stationary Climate of South Africa
                                    by Charlotte McBride and Andries Kruger

                                          Department: Climate Service

1. Introduction                                           China (Zhang et al. 2016 & Pan et al. 2013) and
                                                          Australia (Alexander & Arblaster 2017). However,
  The Department: Climate Services recently               trends in weather and climate extremes have
  embarked on detailed research on the                    not been properly investigated in South Africa.
  prevalence and likelihood of new weather                South Africa is in the fortunate position that
  records, specifically daily maximum and                 it does have reliable observed data sets going
  minimum temperature and rainfall. This research         back to the early 20th century and thus using
  was firstly triggered by the increasing number          these observed data could shed light on trends
  of enquiries with regards to the perceived              in extreme values. The ability to understand
  increase in record-breaking temperatures and            extremes and the implications of these in the
  precipitation amounts measured by the SAWS              future rest on our ability to document and
  observation network. An in-depth study of the           understand these changes in extremes from
  perceived increase in climate records has not           direct observations (Zwiers et al 2013).
  been conducted in South Africa and therefore
  a scientifically validated answer to these              Cooley (2013) makes the point that changes in
  questions was not possible.                             the mean temperature record do not show a
                                                          linear pattern in the occurrence of extremes but
  It is a well-established fact that global               rather have shown “periods of rapid increases
  warming and associated climate change has               followed by plateaus”. It would be important to
  had significant local effects in many regions           determine if this holds true for South Africa and
  of the world (IPCC, 2013). While most regions           if the pattern is similar for both temperature and
  experienced significant warming since the               precipitation. This understanding of possible
  Industrial Revolution due to the increased              variability of the occurrence of extreme weather
  concentrations of greenhouse gases in the               conditions over time is important to investigate,
  atmosphere, the warming atmosphere has                  as society may find it more difficult to adapt to
  also brought about observable changes in the            nonlinear trends rather than coping with just an
  mean state of other climate parameters, such            altered mean condition (Rahmstorf & Coumou
  as precipitation. Therefore, it can be accepted         2011).
  that the climate is in a non-stationary state, with
  associated changes in its mean state as well as         One can show that the inclusion of a small
  an increase in the probabilities of extremes to         number of new extremes or climate record-
  occur. In a warming world it can be assumed that        breaking values in a long-term climate series can
  warm or hot extremes in surface temperature             change the estimated values of the associated
  will become more frequent, while cool or cold           extreme value distribution parameters. These
  extremes less so. The same argument applies             will in some instances result in an appreciable
  to observed shifts in precipitation, where              broadening of the extreme tails of the
  negative trends in precipitation could enhance          distribution. Such changes, especially where
  the probability of increased frequencies of dry         they increasingly occur due to a non-stationary
  periods and prolonged droughts. Long-term               climate, enhance the theoretical probability
  increases in precipitation can have the opposite        of extreme values to occur. The application of
  effect, where there can be an enhanced                  extreme value distributions, used to estimate
  probability for floods to occur.                        the probability of extremes over long time
                                                          periods, are integral to long-term planning to
  Most of the above observations have been                adapt to and mitigate for extreme climate events
  well-researched and documented e.g. in the              e.g. design values for the built environment.
  USA (Meehl et al. 2016 & Meehl et al. 2009),

                                                            WeatherSMART News February 2021              5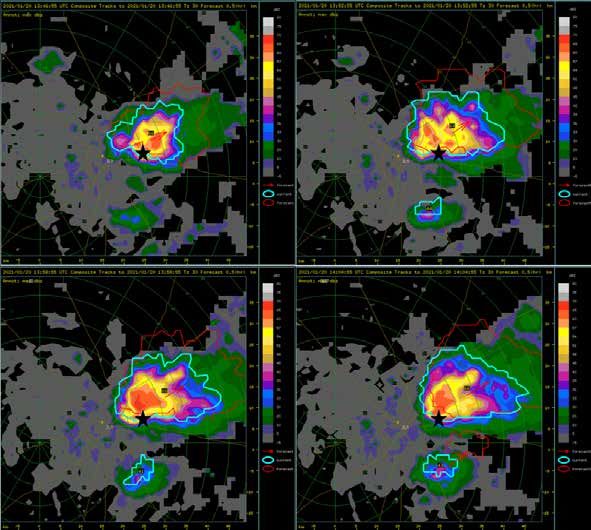
A better understanding of the possible long-            projected changes in the occurrence of climate
    term changes in the distribution parameters             extremes and records and the probable effects
    could assist the industry in adjusting to possible      of these changes on relevant socio-economic
    changes in occurrence and intensity of extreme          sectors. This objective can be subdivided into
    events.                                                 the following aims or research questions:
    In addition to the above, there is not a coherent       • Are there observed changes in climate
    picture in terms of the seasonal distribution of          extremes, and how do the definitions of
    changes in frequency and intensity of extreme             climate extremes and climate extreme
    events (Tabari & Willems 2018). Work by Sen               indices affect the assessment of climate
    Roy and Rouault in 2013 did consider the spatial          change?
    patterns of season extreme hourly precipitation
    across South Africa but the data sets used              • Following on the above, are there any trends
    were for a limited period of 1998 to 2007. The            in new climate records?
    understanding from a seasonal point of view             • Are there any historical and future changes
    could also be explored from a spatial perspective         in the probabilities of extreme climate
    as changes are in most cases region-specific. This        occurrences?
    spatial understanding is important when taking
    decisions and conducting risk assessments               • Are there spatial differences in terms of the
    (AghaKouchak, Sellars & Sorooshian 2013).                 trends in frequency and intensity of extreme
                                                              events considering South Africa’s complex
    In understanding changes or variability in extreme        climatology and can these differences be
    events policymakers, disaster managers, famers            regionalised?
    and developers of infrastructure, to name a few,
    can be in a better position to allocate resources       • Are there possible effects of future changes
    to adapt and mitigate against the effect of these         in the prevalence of climate extremes to
    extremes on society. Up to now decisions made             selected socio-economic sectors?
    in understanding the effects of extremes have
    largely been made using historical data in a         3. First results
    stable climate (Balov & Altunkaynak 2019).              The research commenced with the analysis
    However, due to climate change the assumption           of trends in daily maximum and minimum
    of a stationary climate could lead to significant       temperature records. We looked at the temporal
    underestimations of risk. Thus, the main reason         and spatial distribution of the frequency of
    to study extremes is to understand them and             breaking highest and lowest daily maximum
    then manage the consequent risks in order that          and minimum temperature records over the
    adaptive strategies can be meaningful (Sura             period of 1951 to 2019 for 25 weather stations
    2013).                                                  over South Africa. In a climate that is stationary
    Following on the above, it is widely acknowledged       (non-changing over the long-term) we would
    that adaptation measures to climate change              expect the probability to measure a record
    should take into account the increase in climate        temperature for a specific day in the year as 1/n
    extremes that could increasingly test the               where n is the year since recording began. It
    abilities of socio-economic sectors to absorb           became apparent, especially in the last decade
    the impacts of climate and weather extremes.            since 2010, that high temperature records
    Therefore the research will assist to quantify          were broken more frequently than expected,
    the changes in the probabilities of extremes to         while low temperature records were broken
    occur, which will in turn assist the planning of        less frequently. The ratio of highest maximum
    adaptation measures to climate change.                  to lowest minimum temperature records was
                                                            almost an equal 1:1 ratio near the start of the
2. Specific objectives of the research                      analysis period, but it increased substantially in
                                                            the latter years at all the weather stations, as
    The main objective of the research is to                shown in Figure 1.
    determine whether there are historical and

6           WeatherSMART News February 2021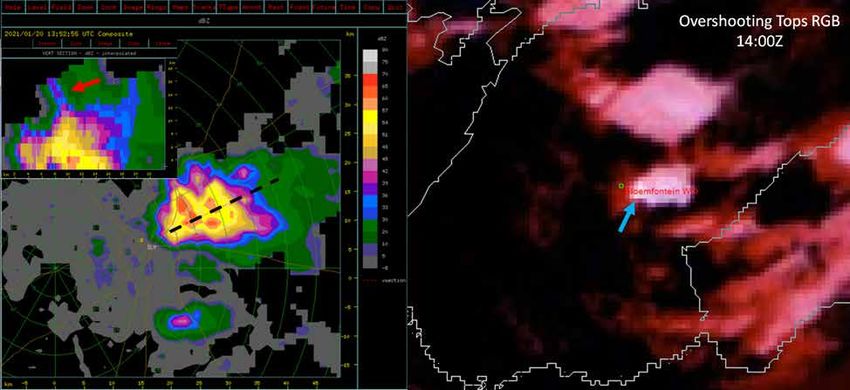
Figure 1: Ratio of high Tmax to low Tmin records for all 25 weather stations for the period 1951 to 2019.

Figure 2 presents the actual number of records for highest and lowest maximum and minimum temperatures
compared to what is expected in a stationary climate.

Figure 2. Temperature records for 25 stations over South Africa from 1951 to 2019. Yellow dashed line is the expected number of records 1/n in
a stationary climate, high Tmax: dark orange, low Tmax: light orange, low Tmin: dark blue and high Tmin: light blue.

                                                                                WeatherSMART News February 2021                           7
Previous researchers, e.g. Werner and Krug                       π = Pi and e = Euler–Mascheroni constant. The
     (2010) recognised that the estimation of the                     first term 1/n is the theoretical expected number
     expected number of records should take into                      of records in a stationary climate, the next
     account the warming trend due to climate                         expression after the addition sign is defined as
     change. So, instead of an expected probability                   the trend term or “warming term” (Wergen and
     of 1/n in a stationary climate, the probability                  Krug, 2010). When there is no trend (stationary
     of measuring a temperature record takes into                     climate) v = 0. We know that South Africa did
     account the warming trend by the addition of a                   not warm uniformly due to climate change and
     “warming term” as follows:                                       that some regions experienced more warming
                                                                      than others. Therefore, the “warming term” will
                                                                      be unique for a specific station. As an example,
                                                                      Figure 3 presents the expected number of daily
                                                           (1)        maximum temperature records over the period
                                                                      2010 to 2019. It is evident that more records are
     where n is the number of years, v = mean                         expected to occur over especially the central
     temperature trend and σ = standard deviation,                    and western interior.

Figure 3: Spatial distribution of the annual average number of expected high daily maximum temperatures records with warming trend
considered for period 2010 to 2019.

 8            WeatherSMART News February 2021
However, even taking the long-term increase in maximum temperatures into account, the observed number of
records far exceed the expected. Figure 4 presents the actual average number of observed maximum temperature
records per year for the period 2010 to 2019. Over the central interior, where eight to ten records are expected due
to warming, more than 20 were recorded in places.
Figure 4: Spatial distribution of the annual average number of observed maximum temperature records for the period 2010 to 2019.
This observation that, even taking the long-term due to an increase in the warming trend (i.e. acceleration
warming trend into account, the observed number in warming). Figure 4 shows that the 30-year mean
of daily maximum temperature records far exceeded trend in the annual average maximum temperature has
the expected, warranted further investigation. One increased since 1951. The 1951 – 1980 trend was about
of these were to investigate whether the increases 0.1 °C/decade and increased to more than 0.3°C/decade
in temperatures since 1951 were near-constant or in the last decade. This will of course have a bearing on
accelerating. This research led to the conclusion that the the validity of equation (1), which only considers the
higher-than expected number of records were indeed mean trend over the whole analysis period.
WeatherSMART News February 2021 9Figure 5: Linear trend of the 30-year trend of annual average maximum temperature with window centred on the 30 following years, e.g. the first value, for 1951, represents the linear trend over the period 1951 – 1980 and the last value for 1989, the linear trend over the period 1989 - 2019. An increase indicates acceleration in warming. We therefore deduce that the higher than expected numbers of high maximum temperature records in the latter part of the analysis period were probably due to an acceleration of the general warming trend. An additional observation is that spikes in annual record counts mostly occurred in El Niño years, contributing to the occurrence of anomalously high numbers of maximum temperature records over South Africa. Figure 6 shows that during El Nino years, quite often a much higher number of maximum temperature records are broken. These record-breaking temperatures seem to clearly contribute to the general higher-than-expected frequencies of records since the mid-1980s. Figure 6: Average number of maximum temperature records for all stations per year for 1951 to 2019. The black line is the expected number of records in a non-stationary climate. Black dots indicate El Niño year (size of dot indicate strength of the event). 10 WeatherSMART News February 2021
4. Conclusion and way forward                               Meehl, G. A., Tebaldi, C., Walton, G., Easterling, D.
                                                            & McDaniel, L., 2009, ‘Relative increase of record
   From the initial analysis it became evident that         high maximum temperatures compared to record
   even taking the general warming into account             low minimum temperatures in the U.S’, Geophysical
   due to climate change, many more temperature             Research Letters 36 (23), 1-5.
   records are broken than expected. Warming
   over South Africa is accelerating and this means         Pan, Z., Wan, B., Gao, Z., 2013, ‘Asymmetric and
   that, in all probability, high temperature records       heterogeneous frequency of high and low record-
   will be broken at a higher than expected rate.           breaking temperatures in China as an indication of
   The results warrant an investigation into how El         warming climate becoming more extreme’, Journal of
   Niño events will contribute to high temperature          Geophysicl Research: Atmospheres 118, 6152 – 6164.
   records in future, what the temperature
                                                            Rahmstorf, S. & Coumou, D., 2011, ‘Increase of extreme
   trends are predicted to be in the near and far
                                                            events in a warming world’, PNAS 108 (44), 17905–
   future and what the effects of these relatively
                                                            17909.
   frequent record-breaking temperatures will be
   in relevant socio-economic sectors, e.g. health          Sen Roy, S. & Rouault, M., 2013, ‘Spatial patterns of
   and agriculture.                                         seasonal scale trends in extreme hourly precipitation in
                                                            South Africa’, Applied Geography 39, 151-157.

              References                                    Sura, P., 2013, ‘Stochastic Models of Climate Extremes:
                                                            Theory and Observations’ in A. A. AghaKouchak, D.
AghaKouchak, A., Sellars, S., & Sorooshian, S., 2013,       Easterling, K. Hsu, S. Schubert & S. Sorooshian (eds.),
‘Methods of Tail Dependence Estimation’, in A.              Extremes in a Changing Climate Detection, Analysis and
AghaKouchak, D. Easterling, K. Hsu, S. Schubert & S.        Uncertainty, pp 181-222, Springer
Sorooshian (eds.), Extremes in a Changing Climate
Detection, Analysis and Uncertainty, pp 163-179,            Tabari, H. & Willems, P., 2018, ‘Seasonally varying
Springer.                                                   footprint of climate change on precipitation in the
                                                            Middle East’, Scientific Reports 8, (4435)1-10, viewed
Alexander, L. & Arblaster, J.M., 2017, ‘Historical and      on 18 July 2019, from https://www.nature.com/articles/
projected trends in temperature and precipitation           s41598-018-22795-8
extremes in Australia in observations and CMIP5’,
Weather and Climate Extremes, 15 , http://dx.doi.           Wergen, G. and Krug, J., 2010, ‘Record-breaking
org/10.1016/j.wace.2017.02.001.                             temperatures reveal a warming climate’, EPL (Europhysics
                                                            Letters) 92(3), 30008.
Balov, M.N. & Altunkaynak, A., 2019, ‘Frequency analyses
of extreme precipitation events in Western Black Sea        Zhang, X., Gao, Z., Pan, Z. & Huang, X., 2016,
Basin (Turkey) based on climate change projections’,        ‘Spatiotemporal variability of extreme temperature
Meteorological Applications 26(3), 468–482.                 frequency and amplitude in China’, Atmospheric
                                                            Research 185, 131-141.
Cooley, D., 2013, ‘Return Periods and Return Levels
Under Climate Change’ in A. AghaKouchak, D. Easterling,     Zwiers, F. W., Alexander, L. V., Hegerl, G. C., Knutson,
K. Hsu, S. Schubert & S. Sorooshian (eds.), Extremes in a   T. R., Kossin, J. P., Naveau, P., Nicholls, N., Schär, C.,
Changing Climate Detection, Analysis and Uncertainty,       Seneviratne, S. I. and Zhang, X., 2013 'Climate Extremes:
pp 163-179, Springer.                                       Challenges in Estimating and Understanding Recent
                                                            Changes in the Frequency and Intensity of Extreme
Meehl, G. A., Tebaldi, C & Adams-Smith, D., 2016, ‘US       Climate and Weather Events', pp. 339-389. Springer
daily temperature records past, present and future’,        Netherlands.
PNAS, 113(49), 13977-13982.

                                                                 WeatherSMART News February 2021                 11
Determining the type of severe thunderstorm that
developed north-west of Bram Fischer International
Airport, Bloemfontein on 20 January 2021
by Elani Heyneke and Tshifhiwa Ravele
A severe thunderstorm is a thunderstorm that produces Classification of a severe thunderstorm
large hail or a large amount of small hail, tornadoes,
strong, damaging winds and/or heavy downpours Severe thunderstorms can be classified as pulse
that lead to flooding. The impacts associated with severe and multicell thunderstorms, supercells, or a
severe thunderstorms can range from minor (localized mesoscale convective system (MCS) which contains
damage) to significant (damage over a larger area/ squall lines. The classification is determined by the
urban area) and all depend on the size, region where size of the thunderstorm on radar as well as the
it occurs, longevity and severity of the thunderstorm. shearing environment as seen in Figure 1. Supercells
Environmental factors associated with severe are thunderstorms that have a rotating updraft
thunderstorms are: exceptional instability, sufficient (mesocyclone) as well as a downdraft and the severe
moisture, unsaturated/dry air in the mid-levels, vertical thunderstorm can sustain itself for hours, causing
wind shear and steep low-level lapse rate to name a localized damage as it moves. Squall lines are well
few. Although severe thunderstorms are well-known organised, connected thunderstorms that can have a
and there is a broad knowledge of what causes and large spatial scale and produces a gust front; therefore,
contributes to them forming, there are still types of this type of severe thunderstorms can cause widespread
severe thunderstorms that require further study. Pulse damage. Pulse severe and multicell thunderstorms are
severe thunderstorms are one of these, therefore, isolated thunderstorms that produce severe weather
this case study will be beneficial to the meteorology for a brief period of time, but since these types of
community of South Africa. severe thunderstorms are usually slow-moving or
Determining Thunderstorm Classification
Determine spatial scale of radar echo
System Scale Storm-Scale Mesoscale
of Radar Echo: Radar Signature Radar Signature
(~ 5-50 km) (~ 5-200 km)
Shear low shear* high shear** low & high shear
Environment environment environment environments
Expected Pulse Severe Supercell Mesoscale Convective
Storm Type: and System ((MSC):
Multicell Linear Multicell
Squall Lines
Bow Echoes
* Low shear refers to the deep layer bulk shear throughout the Derechoes
lower half of the storm not exceeding the approximate value
of 15 knots
** High shear refers to the deep layer bulk shear exceding ~ 30 Assess embedded cells
knots
(Storm-Scale
Note: Increasing storm organisation due to updraft - shear Radar Signature ~ 5-50 km)
interaction occurs between the low shear pulse and high shear
supercell storm modes.
Commonwealth of Australia, Bureau of Meteorology
Figure 1: A decision tree to determine the classification of a thunderstorm. Source: MetEd
12 WeatherSMART News February 2021keep on redeveloping, localized damage could be International Airport, Bloemfontein. This thunderstorm
caused. Weather forecasters look at the following resulted in damage to houses and caused trees to break
atmospheric factors to determine whether there is and produced heavy downpour which led to localized
a possibility of severe thunderstorms: Total of total flooding. The purpose of this case study is to determine
values greater than 50; K-index values greater than the type of severe thunderstorm and the meteorological
35; Showalter index less than –3; surface CAPE values factors that contributed to its development. Further
greater than 250; directional and speed shearing; investigation will be done by making use of satellite and
sufficient moisture throughout the atmosphere and a radar data, numerical model data, and synoptic data
trigger mechanism. Supercells and squall lines usually and well as the impacts that occurred.
develop in these types of atmospheric conditions. On
the other hand, pulse severe thunderstorms are more Study Area
difficult to forecast, because they develop in a weakly Bloemfontein is the capital of the Free State, which is
sheared environment and therefore do not meet the the central province of South Africa, and is situated in
minimum requirements set out for forecasting severe the central parts as seen in Figure 2. The Free State
thunderstorms. is an agricultural province, but Bloemfontein is the
Case study exception, with a population of 567,000. Bram Fischer
International Airport is situated west of Bloemfontein
During the afternoon of 20 January 2021, a severe and the study area is north-east of the airport as seen
thunderstorm developed north-west of the Bram Fischer in Figure 2.
Figure 2: Location map of Bloemfontein, Free State with the focus area being Bram Fischer International Airport. Source: Google Maps.
WeatherSMART News February 2021 13Synoptic data or not. Therefore, certain synoptic parameters
were compared with that of the Unified Model SA4,
On 20 January 2021, there was a surface high which has a resolution of 4 km and is the numerical
pressure system over the eastern parts of South weather model that is run in-house at the South
Africa as well as a surface trough over the western African Weather Service.
parts. Good surface convergence was present
between the weather stations that are located at Comparing the 10 m winds at Bethlehem and at
the city centre of Bloemfontein and at the Bram Bloemfontein by making use of Figure 3 and Figure 4,
Fischer International Airport as seen in Figure 3. the winds over Bethlehem and Bloemfontein City
evaluated well. Even though the 10 m winds at
Numerical model data Bram Fischer International Airport do not seem to
It is necessary to determine if the model data is be reflected in the model data, which can be due
evaluating well with the real-time data, which, in to a local effect. But the model data can still be
turn will determine if the model data can be trusted trusted and used for further investigation.
Figure 3: Synoptic chart of South Africa valid for 20 January 2021 at 12:00Z (+2 hours for SAST). Source: Eumetrain.
Figure 4: Sea-level Pressure (hPa) left and 10m wind (knots) right valid for 20 January 2021 at 12:00Z. Source: SAWS.
14 WeatherSMART News February 2021Instability is an important ingredient for K-index was above 40, the Total of Totals close to
thunderstorms to develop, therefore the following 50, the surface CAPE around about 400 and the
parameters were consulted: the K-index, the Total dryline was situated west of Bloemfontein. These
of Totals, the surface CAPE and the dryline, which are all indications that there is a possibility of
will determine whether there was a trigger for thunderstorms with some of the parameters having
the thunderstorms to develop which is another thresholds that can warrant severe thunderstorms.
necessary ingredient. Referring to Figure 5, the
Figure 5: K-Index, surface CAPE, Total of Totals and Storm motion vector valid for 20 January 2021 at 12:00Z. Source: SAWS.
Thunderstorms cannot develop if there is not enough looks at to determine if severe thunderstorms are
moisture in the lower, middle and upper levels of possible. The ideal wind direction and speed at
the atmosphere. Referring to Figure 6, there was 850 hPa is a north-easterly wind of about 5 to 10
enough moisture throughout the atmosphere to knots, a northerly wind of 15 to 20 knots at 700
warrant a 30% chance of thunderstorms to develop hPa and, at 500 hPa, a north-westerly wind of 30
near and east of Bloemfontein on 20 January knots and stronger. Referring to Figure 7, there was
2021. The next step in forecasting thunderstorms weak speed shearing, but no directional shearing.
is to determine if there is a possibility of severe Therefore, it was a weak shearing environment,
thunderstorms. rather than a strong one. The steering winds for the
anticipated thunderstorms were also weak with a
A strong shearing environment is one of the speed of 20 to 30 km/h, which is classified as slow-
atmospheric conditions that a weather forecaster moving thunderstorms.
WeatherSMART News February 2021 15Figure 6: Relative humidity at 700, 600 and 500 hPa valid for 20 January 2021 at 12:00Z. Source: SAWS.
Figure 7: 850, 700 and 500 hPa winds as well as the storm motion vector (the speed and direction of the
thunderstorm) valid for 20 January 2021 at 12:00Z. Source: SAWS.
16 WeatherSMART News February 2021Satellite and radar data pulse severe thunderstorm or a multicell. To spot a
pulse severe thunderstorm on radar, one would look
Radar is one of the tools used by weather forecasters for high reflectivity of 50 dBZ and greater, a strong
to detect thunderstorms and their severity as well updraft, an overshooting top, and/or mid-altitude radial
as their movement and speed. Satellite images convergence that usually last for about 20 minutes. On
are also useful for determining the severity of a satellite images, one would also look for a dome-like
thunderstorm, especially in regions where there is protrusion above the storm, using the visual channels,
no radar coverage. It is also important to consider or by making use of the Overshooting Tops RGB where
the type of shearing environment when a possible bright white areas within a thunderstorm are where
severe thunderstorm is spotted on the radar and the overshooting top would be located. This indicates
satellite. that there is a strong updraft and can potentially be a
severe thunderstorm developing. It is noteworthy to
On 20 January 2021, around about 14:00Z, a
mention that there is a displacement issue with satellite
thunderstorm was affecting the aerodrome of the
images, the further the location is from the equator,
Bram Fischer International Airport. An overshooting
due to the curvature of the earth. This is prominent
top can be seen on the radar cross section in Figure 8
on the Overshooting Tops RGB image in Figure 8 when
as well as on the Overshooting Tops RGB. Since the
comparing the position of the severe thunderstorm on
shearing environment was weak, it could be either a
the radar image with that on the satellite image.
Figure 8: Radar image (left) valid for 20 January 2021 at 13:53Z showing a thunderstorm north-east of Bram Fischer International Airport. An
overshooting top (red arrow) can be seen on the cross-section. The Overshooting Tops RGB (right) which is a satellite product also indicates the
overshooting top (blue arrow) at 14:00Z. Source: SAWS.
This severe thunderstorm intensified quickly, had thunderstorm. Since these types of severe
high dBZ values of above 65, lasted for about 20 thunderstorms do not last very long and form in a
minutes and was slow-moving as seen in Figure weak shearing environment, it is proven that these
9. Therefore, also considering the information are some of the most difficult severe thunderstorms
above, it can be stated that it was a pulse severe to forecast and are often missed.
WeatherSMART News February 2021 17Figure 9: Radar images of the pulse severe thunderstorm that was situated north-east of Bram Fischer International Airport
(location indicated by the start) on 20 January 2021; top left corner – 13:47Z, top right corner – 13:53Z, bottom left corner –
13:59Z, bottom right corner – 14:05Z. Source: SAWS.
Impacts Conclusion
The pulse severe thunderstorm that formed Against popular believe, a weak shearing environment
north-east of the Bram Fischer International can contribute to severe thunderstorms, namely
Airport resulted in heavy downpours, which led to pulse severe thunderstorms, as identified in this
localized flooding, hail as well as damaging winds. case study, when the necessary ingredients are met.
The Bloemfontein Courant reported that damages Pulse severe thunderstorms are usually associated
occurred in Estoire, Olive Hill and Ribblersdale and with heavy downpour, leading to localized flooding,
stated that 100 mm of rain was recorded, trees large amounts of small hail and strong, gusty winds
were uprooted, power surges occurred and the and, very seldom, weak tornadoes. Therefore, it
roof of a house was blown off. See Figure 10. The is important to investigate further when dealing
Bloemfontein Weather Office, which is situated at with a weak shearing environment to determine
Bram Fischer International Airport, recorded 29 whether pulse severe thunderstorms could occur
mm due to this thunderstorm. Seeing that the core and to also keep a close eye on the radar and
of it was located north-east of the Bloemfontein satellite data to detect as soon as one develops, so
Weather Office, it is possible that heavier rainfall that a warning can be issued on time.
occurred over the study area. Considering the
types of damage that were reported, minor impacts
occurred.
18 WeatherSMART News February 2021Figure 10: Impacts that occurred north-east of Bram Fischer International Airport, Bloemfontein on 20 January 2021 between 13:30Z and
14:40Z. Source: Bloemfontein Courant.
References Miller, P.W. and Mote, T.L., 2017. Standardizing the
definition of a “pulse” thunderstorm. Bulletin of the
Allen, J.T. and Allen, E.R., 2016. A review of severe American Meteorological Society, 98(5), pp.905-
thunderstorms in Australia. Atmospheric Research, 913.
178, pp.347-366.
Sobash, R.A., Kain, J.S., Bright, D.R., Dean, A.R.,
Miller, P.W. and Mote, T.L., 2017. A climatology Coniglio, M.C. and Weiss, S.J., 2011. Probabilistic
of weakly forced and pulse thunderstorms in forecast guidance for severe thunderstorms based
the southeast United States. Journal of Applied on the identification of extreme phenomena in
Meteorology and Climatology, 56(11), pp.3017- convection-allowing model forecasts. Weather and
3033. Forecasting, 26(5), pp.714-728.
WeatherSMART News February 2021 1920 WeatherSMART News February 2021
SOUTH AFRICAN WEATHER SERVICE LAUNCHES THE
 REGIONAL WMO INTEGRTED GLOBAL OBSERVING
 SYSTEM CENTRE (RWC-SA) ON 9 FEBRUARY 2021
                                     by Francis Mosetlho

The official launch of the SADC WMO              regional WIGOS performance monitoring and
Regional WIGOS Centre took place via virtual     incident management (WIGOS Data Quality
platform on 9 February 2021. The launch was      Monitoring System).
an outcome of the South African Weather
Service’s expression of interest, in May 2019,   The RWCs liaise with relevant existing WMO
to host the Regional WIGOS Centre for SADC.      Centres, in particular with the Regional
This expression was supported by the Regional    Instrument Centres (RICs), Regional Climate
Association I (Africa) and endorsed by World     Centres (RCCs) and Regional Training Centres
Meteorological Organization (WMO).               (RTCs) regarding all WIGOS related activities in
                                                 the Region.
Regional WIGOS centres (RWCs) were
established as one of five priority areas for    Virtual Training of SADC NMHSs Focal Points on
the WIGOS pre-operational phase, 2016-2019,      WDQMS attached to RWC-SA was conducted
to advance the implementation of WIGOS           by the WMO experts in October 2020, and
within WMO regions (or sub-regions), by          thereafter the readiness of the South African
providing regional coordination, technical       Weather Service to was confirmed.
guidance, assistance and advice to Members       By hosting the RWC-SA, the South African
and Regional Associations. The RWCs work         Weather Service will further contribute to
closely with the WMO Secretariat and their       regional and national observing network
respective regional working bodies to ensure     management, support and build regional
efficient and effective implementation of        activities and assist with coordination of
WIGOS. Furthermore, they work closely with       regional and sub-regional as well as national
data providers to facilitate regional WIGOS      projects.
metadata management (OSCAR/Surface);

                                                      WeatherSMART News February 2021               21
Aviation forecasts as a result of Tropical Cyclone Guambe
by Hetisani Oscar Shiviti - Forecaster: (Aviation Weather Center)
A tropical cyclone is defined as an intense low-pressure warm core of the tropical cyclone is destroyed, resulting
system, which typically moves from east to west in an increase in pressure and weakening of winds.
following warm sea surface temperatures and occurs It is at this stage that the clockwise rotation becomes
in areas with little or no wind shear. A tropical cyclone disorganised. During the Decaying stage, there may be
has a vertical structure with a clockwise rotation in the some heavy rain as well as low-level clouds remaining.
southern hemisphere that can easily be seen on satellite
imagery. The tropical cyclones that typically affect South
Africa develop in the south-west Indian Ocean. The
There are certain conditions that are vital for the Meteorological Watch Office (MWO) is responsible for
formation of a tropical cyclone, which include: issuing any warnings relating to tropical cyclones. In
South Africa, the MWO is referred to as the Aviation
• Sea surface temperatures of at least 26.5 °C (needs Weather Centre (AWC) based at OR Tambo International
to be throughout a depth of at least 50m) Airport. For all warnings and forecasts for a tropical
• The atmosphere needs to be unstable cyclone, the MWO should always consult the Tropical
Cyclone Advisory Centre (TCAC) – based in La Reunion.
• A moist troposphere
The role of the TCAC is to inform the MWO about specific
• The development should be at least 500 km away attributes of the tropical cyclone, such as its location,
from the equator movement, forecast position and time, speed, central
pressure and maximum wind speed close to the centre
• There should be a pre-existing disturbance with of the tropical cyclone. Upon receiving this information
sufficient rotation (vorticity) and inflow (convergence) from the TCAC, the MWO then uses this information
• There needs to be very little vertical wind shear to issue the necessary Significant Meteorological
advisories/warnings (SIGMET).
The formation or development of a tropical cyclone
happens in four stages, which are named in relation to Meteo-France is responsible for tropical cyclone
the development process occurring in each stage. These forecasting and tracking over the South West Indian
are: the Formative, Immature, Mature and Decaying Ocean. Thus, making La Reunion - Tropical Cyclone
(Dissipating) stages. Each stage has characteristics that Centre - a French branch of Meteo-France, responsible
define what type of development the tropical cyclone is for forecasting tropical cyclones in areas affecting South
undergoing. Africa.
In the Formative stage the development is disorganised Tropical Cyclone forecasts can be displayed in the
and ill-defined, with the strongest winds occurring form of a significant weather chart or a Significant
away from the centre with wind speeds less than gale Meteorological Information warning (SIGMET) and
force (gale force winds have speeds between 34 and the MWO is responsible for issuing aviation-related
40 knots (KT)). In the Immature stage the convection forecasts. Upon receiving a tropical cyclone advisory
becomes more organised, the surface pressure drops to from the TCAC (La Reunion), the MWO needs to
below 1000 hPa and the centre becomes well-defined incorporate the information contained in the advisory
with the strongest winds found around the centre and into both the significant weather chart and the SIGMETs,
wind speeds reaching storm force strength (storm force provided that the tropical cyclone is within the area of
strength winds have speeds between 48 and 55 KT). In the responsibility for which the OR Tambo-based MWO is
Mature stage of development, a steady state is reached responsible.
with only a few changes in the maximum wind speeds Towards the end of February 2021 a tropical cyclone
and pressure. Notably, at this stage of development a Guambe affected the south-eastern parts of Africa.
distinct eye is present. Finally, in the Decaying stage, the
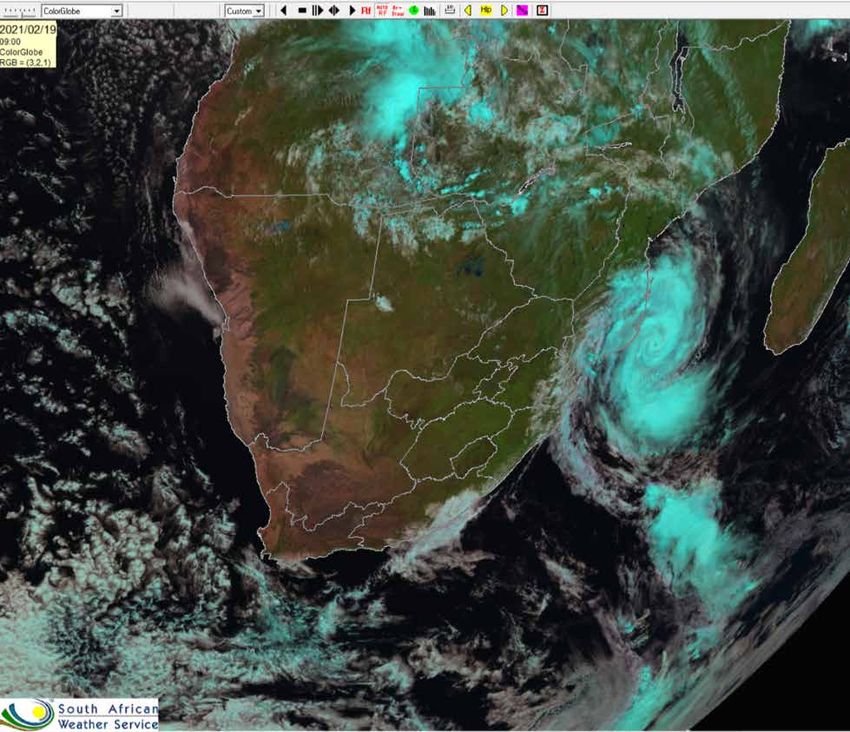
22 WeatherSMART News February 2021Subsequently, this system had an impact on the weather Accordingly, the MWO responsible for this area had to
over the said region, thus influencing the aviation include tropical cyclone Guambe into the forecast, as
forecast. This tropical cyclone was active for a total of it was within the forecast area. On 19 February 2021
5 days, from 17 to 21 February 2021. To forecast the tropical cyclone Guambe was located over the ocean
tropical cyclone effectively, the MWO had to rely on La to the east of southern Mozambique as can be seen on
Reunion Tropical Cyclone Centre. Figure 1, which clearly shows the cyclonic rotation of
tropical cyclone Guambe with a well-defined eye around
From 17 February 2021, the MWO started receiving the centre of circulation. This is an indication that tropical
advisories for a tropical cyclone called “Guambe”. cyclone had reached its Mature stage of development.
Figure 1: Tropical Cyclone Guambe and its circulation as seen on a Day Natural Colours (DNC) satellite image at 0900Z on 19-2/2021. (SAWS)
WeatherSMART News February 2021 23Furthermore, the TCAC also provides a useful forecasting tool in the form of an image. This image indicates the current
position of the tropical cyclone as well as the expected projection of its movement throughout its development. See
Figure 2 below.
Figure 2: A visual display of the location of Tropical Cyclone Guambe as well as the projected trajectory throughout all
its development stages, generated on 19 February 2021 at 10:00 am UTC La Reunion local time (08:00 am South African
standard time). (www.meteo.fr/temps/domtom/La_Reunion/webcmrs9.0/anglais/index.html)
24 WeatherSMART News February 2021On 19 February 2021 at 08:39 SAST, a tropical cyclone advisory was sent to the MWO which was incorporated into
the significant weather forecast charts, as a result of the position of the tropical cyclone being expected to be within
the significant weather chart domain (the domain for a significant weather chart is between longitudes 12.5E and
40E; and latitudes 15S and 37.5S). The tropical cyclone advisory received on 19 February can be seen in Figure 3 while
the significant weather charts into which the advisory was incorporated can be seen in Figure 4.
Figure 3: Tropical Cyclone Advisory for TC Guambe issued at 0639Z (08:39 SAST) on 19 February 2021. (http://www.meteo.fr/temps/domtom/
La_Reunion/webcmrs9.0/anglais/activiteope/bulletins/avis/liste.html# )
WeatherSMART News February 2021 25Figure 4: Significant weather charts (Additional, low and high Level) valid for 1200Z (14:00 SAST) issued on 19 February 2021. (SAWS) On 21 February 2021, tropical cyclone Guambe had moved further south and had entered the Johannesburg Oceanic Flight Information Region (FIR), therefore, a SIGMET for it could be issued by the MWO (or rather AWC). The advisory received by the MWO which was then used to issue a TC SIGMET can be seen in Figure 5. The SIGMET issued as a result of the advisory can be seen in Figure 6. 26 WeatherSMART News February 2021
Figure 5: Tropical Cyclone Advisory for tropical cyclone (TC) Guambe issued at 1205Z (14:05 SAST) on 21 February 2021. (http://www.meteo.
fr/temps/domtom/La_Reunion/webcmrs9.0/anglais/activiteope/bulletins/avis/liste.html# )

As stated earlier, tropical cyclone Guambe was active as for a total of five days but had no big impact on the weather
of South Africa. The only impact of significance was on the aviation forecast. For the whole time that tropical cyclone
Guambe was active, the MWO was constantly monitoring its movement as well as impact on the aviation forecast
until it reached its Decaying stage and moved out of the MWO’s forecast area of responsibility.

                                                                             WeatherSMART News February 2021                        27
Figure 6: Tropical Cyclone Guambe SIGMET in both a text format (top) and a graphical format (bottom) issued on 21 February 2021. (SAWS) 28 WeatherSMART News February 2021
Meet the Authors

Dr Andries Kruger
Dr Andries Kruger is a Chief
Scientist: Climate Data Analysis                                                 Ms Charlotte McBride
and Research in the Department:                                                  Charlotte McBride joined the then
Climate Service of the South African
                                                                                 South African Weather Bureau in
Weather Service. His present and
                                                                                 1998 as a meteorologist focusing
previous duties include the creation
and writing of general climate                                                   on the development of educational
publications, climate change and                                                 publications and assisting with the
variability research with historical                                             communication of weather related
data as input, ad hoc scientific                                                 topics to various stakeholders. In
projects of which the numbers have                                               2010 she moved to be Manager of
increased substantially in recent                                                Climate Data in the Climate Services
years, climate data and information      Ms Elani Heyneke                        Department which involved quality
requests, where advanced statistical     Elani Heyneke started her forecasting   controlling all climate data on
analyses are required, drought           career at the South African Weather     the SAWS main climate database.
monitoring, and assisting in the         on the 5th of January 2017 after        This includes managing a team
quality control of climate data.         completing her B.Sc and B.Sc (Hons)     who are involved in data rescue
                                         in Meteorology as well as the post      activities, quality control of weather
In 2001, Dr Kruger obtained a PhD
(Civil Engineering) degree at the        graduate certificate in Weather         data, spatial checking of data and
University of Stellenbosch on the        Forecasting at the University           archiving of climate documents.
research topic “Wind Climatology         of Pretoria. She has a passion          Over a number of years she has
and Statistics of South Africa           for severe weather forecasting,         co-author the SAWS inputs to the
relevant to the Design of the Build      especially severe thunderstorms         Bulletin of American Meteorological
Environment”. Before that, he            and is planning on completing her       Society (BAMS) State of the Climate
obtained an MSc (Environmental           Masters and P.hD before she is 40.      report. She is also involved with the
and Geographical Science) degree         She is actively involved in creating    work of the World Meteorological
at the University of Cape Town. He       a weather smart nation through
has published papers both locally                                                Organisational (WMO) as a co-chair
                                         writing short and informative           of the Expert Team on Capacity
and internationally, and authored a
                                         pieces on weather related topics        Development for Climate Services
SAWS series of publications on the
                                         and sharing it with the media (RSG      under the Standing Committee on
general climate of South Africa. He
is widely recognised, both nationally    and MedFM). She loves briefing the      Climate Services. Charlotte holds
and internationally, for his research,   public, the aviation and agricultural   a MSc in Science Education and is
which involves advanced statistical      sector and various stakeholders to      currently registered at University of
analyses and interpretation of           help with planning and preparing for    Pretoria for a PhD in Geography.
historical climate data.                 significant weather events.

                                                                   WeatherSMART News February 2021                29
Mr Francis Mosetlho
Gaobotse Francis Mosetlho, is
currently the regional manager for the
Free State and North-West. He joined
the South African Weather Service
in 1984 as a learner Meteorological
Technician stationed at the Mahikeng
Weather Office and led the former
Bophuthatswana Meteorological
Services after the departure of Ms
Gaborekwe Khambule from the time
of amalgamation of the weather
services of TVBC State with the then
South African Weather Bureau. He
joined the Bloemfontein weather
forecasting team in 1998 where
served as a forecaster until 2005
when he joined management.
Dr Tamaryn Morris
Tamaryn Morris is a Senior Scientist He represented the SAWS at various
with the SAWS Marine Unit, based in WMO sanctioned meetings. Currently
Cape Town. She oversees the SAWS he serves as the regional lead on
SANAP responsibilities and is heavily Aircraft-based Meteorological Data
involved in ocean observing networks Array (AMDAR) project and is the
and deployment of instruments chairperson of the RA I Task Team on
around South Africa. Aircraft-Based Observation (RA I-TT-
ABO). Furthermore, he serves as the
National Focal Point for the WMO
Integrated Global Observing System
(NFP-WIGOS) and is the lead of the
Regional WIGOS Centre Southern
Africa which was launched in 2021.
Trainer from 1999 to 2000.
30 WeatherSMART News February 2021You can also read