West Bletchley Council - Carbon Footprint and Energy Audit
←
→
Page content transcription
If your browser does not render page correctly, please read the page content below

West Bletchley Council

                      Carbon Footprint and Energy Audit

      07778 029912

                                                          24 July 2020

Ian Byrne, Principal, ibeccs Ltd
Suite 443, Exchange House
494 Midsummer Boulevard
Milton Keynes MK9 2EA
www.ibeccs.co.uk ian@ibeccs.co.uk
Introduction & Executive Summary
This report has been produced following a commission from Lisa Emmanuel, Environmental Projects Officer
at the Council in support of a Climate Emergency Framework, with the aim of helping to set targets for
emissions reductions and identifying areas where cost-effective action may be taken. It has been
undertaken in two linked stages:
Part 1 calculated an estimated carbon footprint for West Bletchley Council, over the two financial years
2018-19 and 2019-20. Data was mainly collated from supplier invoices (gas, electricity and water), but
supported but other records relating to mileage claims. The report is supported by a spreadsheet
containing data extracted from these invoices and other records to build up the footprint in a format that
should allow updates by West Bletchley Council staff members in future years.
West Bletchley Council was responsible for around 24.6tCO2e of scope 1 & 2 emissions (direct fuel use,
including electricity) in 2019-20, a reduction of around 8% from the preceding year.
Part 2 undertook a brief energy audit, focusing on the two main buildings and the way in which they are
used. Conscious of budgetary constraints, it has focused on the following areas:
Behavioural activities, requiring little or no financial investment, and including procurement
Energy efficiency measures, split between low-cost short-term actions, and those with higher costs
Renewable energy
Contents
Introduction & Executive Summary.............................................................................................................. 2
Part I: Carbon Footprint Report .................................................................................................................... 3
Executive Summary.................................................................................................................................. 3
Setting Targets ......................................................................................................................................... 5
Detailed Footprint calculations .................................................................................................................... 6
Components of Carbon Footprint ............................................................................................................. 6
Direct energy use – gas and electricity ..................................................................................................... 7
Direct energy use – road fuels .................................................................................................................. 9
Selected Indirect emissions (Scope 3)....................................................................................................... 9
Conclusion ..................................................................................................................................................12
Part 2: Energy Audit ....................................................................................................................................13
Key Building Characteristics ....................................................................................................................13
No cost or low-cost measures .................................................................................................................14
Basic energy efficiency improvement measures ......................................................................................16
Higher cost measures – renewables and energy efficiency ......................................................................17
Summary Table of Measures ...................................................................................................................19
Appendix 1: Electric Vans on, or forthcoming, UK market............................................................................20
Appendix 2: Oxo-biodegrading Process .......................................................................................................21
West Bletchley Council: Carbon Footprint & Energy Audit 2 ibeccs Ltd, August 2020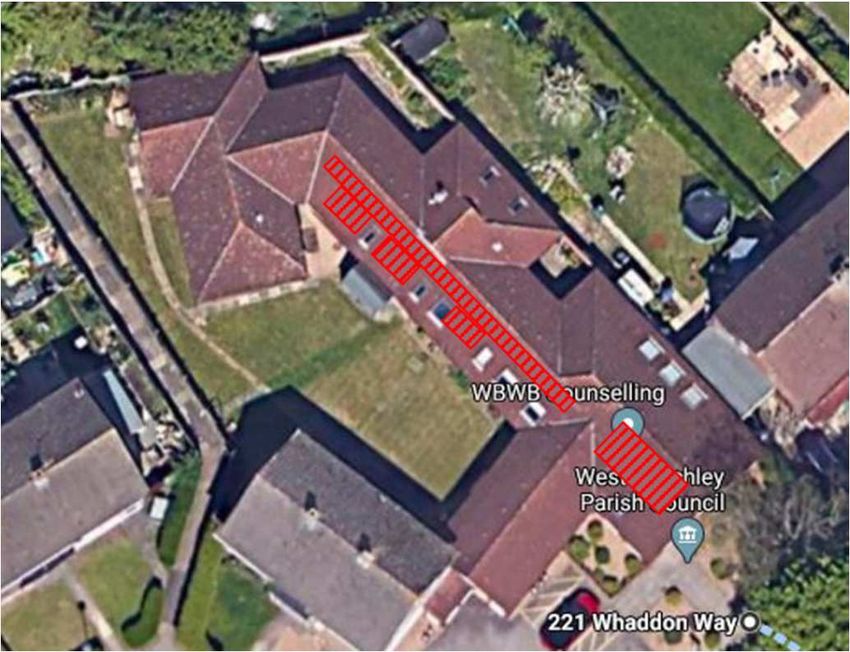
Part I: Carbon Footprint Report
Executive Summary
This Part of the work has calculated an estimated carbon footprint for the Greenhouse Gas (GHG) emissions
attributable to the operations of West Bletchley Council.

The headline figures are that West Bletchley Council was responsible for around 24.6tCO2e of scope 1 & 2
emissions (direct fuel use, including electricity) in 2019-20, a reduction of around 8% from the preceding
year. A substantial fall in emissions attributable to direct combustion of gas (for heating and hot water)
and road fuels was partly offset in a slight rise in emissions from electricity consumption, which in turn
reflected a substantial increase in its use at the 221 Whaddon Way offices:

               West Bletchley Council                              2018-19       2019-20 Change
               Carbon Dioxide Equivalent
               Electricity                                kgCO2e        7488       7512      0.3%
               Gas                                        kgCO2e       16217      14226    -12.3%
               Road fuels                                 kgCO2e        3133       2837     -9.4%

               TOTAL CO2 equivalent                       tCO2e         26.8        24.6    -8.4%

These may be shown as:

Measurable Indirect (Scope 3) emissions for 2019-20 are estimated to add a further 4tCO2e. Unusually the
largest contributor to this number is not staff travel on council business or water use, which are typically
the cases for public sector bodies like West Bletchley Council – but the purchase of dog poop bags, which
contributed more than half the Scope 3 emissions:

                               Selected Indirect emissions (Scope 3)           2019-20
                               Travel (staff cars)                 kgCO2e          307
                               Water supply & sewerage             kgCO2e          240
                               Paper (printing/photocopying)       kgCO2e          409
                               Paper (bathroom)                    kgCO2e          240
                               Dog Poop Scoop bags                 kgCO2e         2760
                               Concrete                            kgCO2e           13
                               Other (see text)
                                                         TOTAL tCO2e               4.0

West Bletchley Council: Carbon Footprint & Energy Audit            3                       ibeccs Ltd, August 2020
Adding these to the current year scope 1 and 2 emissions gives the proportions:

What does this mean?
The total emissions from direct energy use (Scopes 1 and 2) come to around 24.6 tCO2e in 2019-20. By way
of comparison, the average UK household is responsible for 14.1 tCO2e (data from the CCC Fifth carbon
report, although this will have fallen since its publication due to decarbonisation of electricity), so WBC’s
emissions are roughly the same as two average households. (Given that there are two buildings, both of a
broadly large domestic size, using domestic-type heating systems, this is not unreasonable.) Total UK
public sector emissions for 2019 are provisionally estimated by BEIS at 8.0 million tCO2e, so WBC’s
contribution is negligible at around 0.0003% of the public sector total – but this is somewhat meaningless
given the range and extent of other public sector activities.

A more sensible comparison would be to focus on just the two buildings, 221 Whaddon Way and the Frank
Moran Centre. Their gas & electricity emissions are (2019-20) are 13.4 and 7.6 tCO2e respectively. Putting
these back into energy units gives around 65,500 and 38,300 kWh; with respective floor areas of 321m2 and
162m2, gives annual consumptions of around 204kWh/m2 and 236kWh/m2. Comparing these to the –
admittedly somewhat outdated – benchmarks in ECG19 for naturally ventilated (office) buildings of
205kWh/m2 (2000), both sites use more energy than they should, as both benefit from having a recently
installed high efficiency boiler. Whaddon Way’s performance may be in part due to its built form, as a
sprawling single storey building with a large external wall area, but as noted below, it also increased its
electricity use significantly in 2019-20. Both sites have a large hall, with a high volume needing heating
compared to the floor area.

Basis of Calculation
In line with the recommendations of UK Government for organisational reporting, all direct emissions from
energy use (gas and road fuels – often known as Scope 1) and indirect emissions from electricity use (Scope
2) are reported, along with selected indirect emissions (Scope 3) where the council can exert some control
over them and sufficiently robust data is available. In practice, Scope 3 figures are only estimated for
2019-20. The work was undertaken broadly in line with the international standard ISO 14064-1:2018
“Greenhouse gases — Part 1: Specification with guidance at the organization level for quantification and
reporting of greenhouse gas emissions and removals”, as well as the WRI Greenhouse Gas Protocol.
Conversion factors from energy use to the equivalent Greenhouse Gas (GHG) emissions expressed in
tonnes of carbon dioxide equivalent (tCO2e) are taken from the 2020 edition of the BEIS/Defra workbook
“UK Government GHG Conversion Factors for Company Reporting” (published 9 June 2020).

West Bletchley Council: Carbon Footprint & Energy Audit       4                           ibeccs Ltd, August 2020
Setting Targets
West Bletchley Council has recognised the current Climate Emergency resulting from excessive GHG
emissions globally, and so wishes to minimise its own contribution. Its Sustainable Environmental Policy,
revised in July 2020, includes commitments to installing energy saving measures on its premises, where
reasonable, using sustainable energy sources, where possible, supporting renewable energy and zero-
carbon homes in its review of planning applications, and providing training & information for staff and
councillors on climate change.
The Full Council has adopted a policy of achieving carbon neutrality by 2030. It is recommended that this is
supported by establishing interim milestones for absolute emissions reductions taking into account
replacement cycles for capital items such as boilers and vehicles, as well as considering how to balance
residual emissions through measures such as the purchase of “green” electricity, offsetting, or “insetting”,
as discussed below.
One problem with any targets for a small organisation, like WBC, is that there are only a limited number of
steps than can be taken, so any changes are likely to progress in steps, rather than as a smooth annual
improvement. One solution commonly applied is purchasing offsets to make up any shortfall – however
these should only be seen as a temporary measure and not as a long term substitution for taking positive
action to reduce emissions at source. Offsets are a complex area, with numerous certification bodies, and
are generally implemented outside the UK, as Government discourages domestic offsets being counted
towards carbon savings owing to double counting at the national allocation level. Despite this, there are
domestic UK offsets available through the Woodland Carbon Code, and some organisations with spare land
are again considering tree-planting as a form of “carbon inset”.
Another common approach is to purchase “green” energy – usually electricity that has been matched with
generation from renewable energy sources, such as wind or photovoltaics. This is itself fraught with
difficulties – customers need to be assured that the green energy is not just an allocation of existing
supplies but contributes to carbon reductions or the development of new zero carbon sources
(additionality), and may wish to limit types of renewable energy (excluding older hydro-electric schemes, or
those outside the UK, for example). However, the largest barrier is that for reporting under the BEIS/Defra
guidelines, bought-in renewable electricity has to be given the same carbon factor as the UK grid average
electricity: only that generated and used onsite can be allotted zero emissions.
Assuming then that offsets and green energy are not used in the calculations, targets should take into
account incremental savings that may be made through actions such as better housekeeping or behaviour
changes, and then to look at specific measures that may make step changes.
Part 2 consider potential measures following the energy review, and in summary includes:
Building fabric improvements (especially adding insulation)
Heating and lighting controls improvements
Putting solar electric panels (PV) onto building roofs – both buildings have considerable roof areas
facing Southwest, and 221 Whaddon Way has some Southeastern ones, too
Switching to electric vans at the next replacement cycle, and installing EV charging points outside
221 Whaddon Way and in the Frank Moran centre car park, that could be shared with staff or
visitors.
In the longer term there may be opportunities for replacing gas boilers with heat pumps, but the Whaddon
Way one is only recently installed and Frank Moran’s is only 4 years old.
West Bletchley Council: Carbon Footprint & Energy Audit 5 ibeccs Ltd, August 2020
Detailed Footprint calculations
Components of Carbon Footprint
The elements of the footprint, as summarised above are calculated as:

 West Bletchley Council
 Carbon Footprint Calculations
 Emissions from direct energy use (Scopes 1 and 2)
                                                                 2018-19   2019-20 Change %
 Adjusted Consumption                      Unit           Note
 Electricity                               kWh            1       27003     29670       9.9%
 Gas                                       kWh            1       88209     77370     -12.3%
 Petrol                                    litres         2, 8
 Diesel                                    litres         2       1207.8    1114.4     -7.7%

 Conversion factor applied
 Electricity                                              3, 4    0.2773   0.25319
 Gas                                                      3, 5   0.18385   0.18387
 Petrol                                                   3, 6   2.20904   2.16802
 Diesel                                                   3, 6   2.59411   2.54603

 Carbon Dioxide Equivalent
 Electricity                               kgCO2e                  7488      7512       0.3%
 Gas                                       kgCO2e                 16217     14226     -12.3%
 Road fuels                                kgCO2e                  3133      2837      -9.4%

 TOTAL CO2 equivalent                      tCO2e          7        26.84     24.58     -8.4%

 Selected Indirect emissions (Scope 3)
 Travel (staff cars)                kgCO2e                    n/a         307
 Water supply & sewerage            kgCO2e 2                 359          240        -33.2%
 Paper (printing/photocopying)      kgCO2e                    n/a         409
 Paper (bathroom)                   kgCO2e                    n/a         240
 Dog Poop Scoop bags                kgCO2e                    n/a        2760
 Concrete                           kgCO2e                    n/a           13
 Other
                                    tCO2e                    0.36         3.97
An overview of consumption is included in the introduction and a more detailed discussion on each main
source is included below. Some of the points raised in the compilation notes are expanded further in the
more detailed discussion sections.

Compilation Notes
    1. Electricity and gas data is taken from supplier invoices. Where these span a year end, data has
       been interpolated to ensure a like for like comparison between years.
    2. Volumes are converted from payments, based on Experian Catalist monthly UK price data to Dec
       2019; IBECCS data for 2020.
    3. BEIS/Defra corporate reporting data; always latest data, so conversion factors used for 2019/20 are
       based on 2018 data and 2018/19 factors use 2017 data.

West Bletchley Council: Carbon Footprint & Energy Audit             6                    ibeccs Ltd, August 2020
4. Grid average electricity factors include all GHG gases, imports and grid losses, to reflect a typical UK
       mains supply. Supplier or regional variations, including green supplies, are not allowable under the
       BEIS/Defra methodology.
    5. Natural gas is calculated on a Gross CV basis (consistent with calorific value on bills), but excludes
       WTT (well to tank) energy associated with production and distribution.
    6. Average biodiesel or regular unleaded petrol forecourt blends (currently B7 or E5), not on a WTT
       basis (so omitting energy used in production, shipping, refining and distribution).
    7. Totals are reported in tonnes due to the level of uncertainty.
    8. Inadequate data was available for to clearly separate petrol van usage from diesel. Diesel factors
       are used as being marginally more conservative an assumption – this is discussed below.

Direct energy use – gas and electricity
Building and external lighting energy consumption and carbon equivalents are:

 By location                           2018-19            2019-20            2018-19   2019-20
                                          kWh                kWh    Change    kgCO2e    kgCO2e    Change
 221 Whaddon Way
 Electricity                              12798            18817     47.0%     3549      4764      34.2%
 Gas                                      55017            46706    -15.1%    10115      8588     -15.1%
                           Total          67815            65523     -3.4%    13664     13352      -2.3%
 Frank Moran Centre
 Electricity                               9596             7608    -20.7%     2661      1926     -27.6%
 Gas                                      33192            30664     -7.6%     6102      5638      -7.6%
                           Total          42789            38272    -10.6%     8763      7564     -13.7%
 Rickley Park
 Electricity                               4608             3245    -29.6%     1278       822     -35.7%

 TOTAL all sites                        115212            107040     -7.1%    23705     21738       -8.3%

In both years, just over 90%
of the emissions
attributable to direct
energy use came from the
buildings and external
lighting on the three main
sites (the data for 2019-20
expressed in CO2
equivalents is shown right);
within the total just under
two-thirds came from gas
consumption. Only 221
Whaddon Way has a
display energy certificate
(DEC). This relates to the 2017-18 year and shows carbon emissions of around 17 tonnes. The higher figure
reflects real savings made since then with the installation of a new higher efficiency boiler, as well as the
wider trend of the carbon intensity of electricity falling.

West Bletchley Council: Carbon Footprint & Energy Audit               7                     ibeccs Ltd, August 2020
All consumption and emissions are falling with the exception of electricity use in Whaddon Way. On a
monthly basis, that energy consumption data is:

 221 Whaddon Way                                          2018-19                           2019-20
 Electricity use (kWh)               Day          Night      Total         Day    Night        Total
 April (from 1st only)               595           145        740          886     358         1244
 May                                 755           167        922         1182     480         1662
 June                                659           180        839         1227     467         1694
 July                                517           140        657          523     152          675
 August                              629           112        741          575     154          729
 September                           596           144        740          603     158          761
 October                             666           149        815          990     349         1339
 November                            886           153       1039         1338     547         1885
 December                            808           172        980         1435     578         2013
 January                             879           245       1124         1536     660         2196
 February                           1568           581       2149         1573     664         2237
 March                               930           405       1335         1410     598         2008
 March (from April bill)             505           212        717          244     130          374
 TOTAL                              9993          2805      12798        13522    5295        18817

In each year, the April bills are apportioned between the correct accounting period by the energy supplier;
generally the consumption is to a date between 23rd and 25th of the month named are based upon actual,
not estimated, bills. The final part month runs from 19 to 31 March 2020, and is low owing to lockdown.

This is shown graphically to
highlight the increase in
consumption from September
2019 (right). It is suggested that
enquiries should be made as to
whether there is a business reason
for this increase (eg. longer
working hours), or whether it is
something about the way the
office is being used. As
consumption for the final part
period falls back below the prior
year, it suggests that the cause is
something that is actively
happening, and not an
uncontrolled background use of
energy that would continue during lockdown.

Gas consumption, and electricity consumption data for the other two sites (Frank Moran Centre and Rickley
Park), is only billed quarterly, and based on either customer readings or estimated bills. To enable better
management, it is recommended that the smart meters should be installed, and readings taken monthly.

As gas and electricity use is the largest overall contributor to WBC’s carbon footprint, it is natural to target
this area for reductions first.

West Bletchley Council: Carbon Footprint & Energy Audit              8                       ibeccs Ltd, August 2020

Direct energy use – road fuels
The final component of Scope 1 emissions is energy used in vehicles owned or controlled (leased) by the
organisation. In the case of West Bletchley Council this is limited to two vans, initially diesel-powered; one
of which was replaced by a petrol van during 2019-20.

Data has been summarised from fuel bills, but these did not quote either the volume of fuel purchased, or
the price per litre paid, or in some cases the fuel type or vehicle. As a result, fuel volumes have been
estimated based upon UK average diesel price data, which may not accurately represent pump discounts if
bought locally at Tesco or Asda – as such it is likely to slightly underestimate volumes used. No attempt has
been made to adjust for varying fuel levels in the tank at the period end, but these would be unlikely to a
material difference to CO2 emissions estimates.

Currently, it is assumed that all fuel used was diesel. However, the replacement petrol Ford Transit van
acquired in autumn 2019 showed a mileage of 2369 in July 2020. Making very broad assumptions about
the distance driven before 31 March 2020, the likely miles per gallon and costs per litre, and factoring these
into the spreadsheet, the net effect might be to lower total estimated emissions from vans for 2018-19
from 2,837kgCO2e to 2,728kgCO2e. This falls as the carbon content of petrol per pound spent on the fuel is
slightly lower than for diesel (and is not based on the carbon emitted per mile driven). This difference is
not material and within the error bounds of the current cost-based methodology.

It is recommended that fuel records showing volumes used for each fuel (and associated mileage) are kept
in future.

In the longer term, WBC may wish to consider switching to electric vans when the next one falls due for
replacement. Although the choice is currently very limited (with only a Nissan model widely available and
the Vauxhall e-Vivaro due imminently), it is understood that all main van manufacturers have a range of
models due to be launched in right hand drive models for the UK market within the next 12 months. Vans
currently appear to drive no more than around 4,000 miles per annum, so charging could easily be done
overnight using a relatively low speed charger that should be not vastly expensive, and could potentially be
made available to visitors or staff during the day.

Selected Indirect emissions (Scope 3)
When computing an organisational footprint, all indirect emissions are optional, but organisations are
encouraged to include as many as they have robust data for, and – in particular – to include sources where
there may be substitution for direct energy use, such as transport. Water consumption, as it is metered, is
also frequently included. This calculation includes both these, and has selected some further items where a
reasonable quantification can be made and the result is likely to be material to the overall footprint.

Travel (staff cars)
This is the only Scope 3 travel for which data is available – any use of public transport (eg. by rail to London)
has been omitted. Data was available for mileage from 13 vehicles in 2019-20; as a conservative
assumption – with one exception – all were assumed to be petrol unless indicated as diesel. (The exception
was a Range Rover which was designated as unknown). Cars were grouped into three size categories: small
(1.4l or less), large (2.0l or more) and medium (everything else).

                                                    Mileage claimed          Emissions kgCO2e
              Total 2019-20 (13 vehicles)                    1202.5                        306.9
Overall mileage was modest, so the total staff travel emissions represent just over 1% of organisational
emissions. Even if there were occasional rail trips to London or elsewhere, it is unlikely that they would
make a material impact to the overall footprint.

West Bletchley Council: Carbon Footprint & Energy Audit         9                            ibeccs Ltd, August 2020
Staff travel to work mileage, which can be included in Scope 3 emissions is not included.

Emissions associated with park users (parking in the car park adjacent to Rickley Park) have not been
estimated either, but it is unlikely that people would regularly drive long distances to the facility, and these
too can be omitted on grounds on immateriality.

Water & sewerage emissions
Unlike gas or electricity, these are usually computed regionally, based on the supply company – in the case
of Bletchley, Anglian Water (trading as Wave). This approach is more valid, as there is no national grid for
water, and the pattern of collection and distribution varies significantly based on the topography of the
region.

West Bletchley Council is unusual in that it has allotments that have a mains water supply but no mains
drainage, and so lack a sewerage charge (or the associated emissions with waste water disposal). Quarterly
bill data, including apportionment between financial years where necessary, is given in detail on the
spreadsheet, but can be summarised here as:

                                                       2018-19                           2019-20
                                                    Water       Sewerage              Water        Sewerage
 Volumes (cubic metres)                               845            543                570             357
 Conversion factor                                  0.257          0.262              0.257           0.262
 Emissions (kgCO2e)                                 217.2          142.3              146.5            93.6
 Combined Emissions                                  359 kgCO2e                         240 kgCO2e

                                                                                      The significant fall, of one
                                                                                      third, looks impressive, but
                                                                                      is based on what may be
                                                                                      an anomalous figure for
                                                                                      Whaddon Way in
                                                                                      September 2018. This was
                                                                                      an actual reading after an
                                                                                      estimate, and it’s not clear
                                                                                      if there had been a series
                                                                                      of estimates that had led
                                                                                      to the reading playing
                                                                                      catch-up or whether there
                                                                                      was a real problem (a leak)
                                                                                      that was subsequently
                                                                                      fixed.

Office Paper
Despite having a policy of using electronic communication and avoiding printing whenever possible, WBC
still purchases significant amounts of office paper for printing and photocopying.

 Paper (printing/photocopying)                        Qty    gsm Weight      Factor     kgCO2e
  Sheets purchased A4                         22000         80 109.77        3.73     409.4
It is assumed that all paper is standard quality white A4 copy paper, not from recycled sources; 80gsm is
the standard specification, but UK office paper can vary from a "budget" paper at 70gsm to high quality
paper at up to 120gsm. Calculations excluded energy used by the copier (part of the overall metered use)
and in printing supplies.

West Bletchley Council: Carbon Footprint & Energy Audit         10                            ibeccs Ltd, August 2020
Paper (Bathroom)
The assumptions made here are:
Paper (bathroom) Rolls Sheets/ Area/sheet Factor kgCO2e
roll m2 g/sheet
Toilet Rolls - recycled paper 440 220 0.01275 1.1 106.5
Toilet Rolls - regular paper 1.8 0.0
Hand towels - recycled paper 10000 0.05405 4.66 46.6
Blue wiping paper 48 324 0.06475 5.59 86.9
TOTAL 240.0
Exact data on emissions is, as with most other Scope 3 sources, subject to a wide range of estimates and
competing claims: the toilet paper figures are derived from 2009 data relating to Tesco own-brand toilet
rolls from the all too short period when they participated in a now defunct Carbon Trust labelling scheme.
Data for other bathroom paper types is derived from these (see the spreadsheet for full details of
calculations); there are numerous unsubstantiated claims made on the relative efficacy and efficiency of
paper towels versus hand dryers, largely provided by the hand dryer industry. These generally electric
favour hand dryers (and increasingly so as the UK electricity supply decarbonises), although may not take
into account any carbon capture benefits from paper growing trees that then end up sequestered in
landfill. However, the calculated annual emissions in the table above for hand towels (47kgCO2e) are
relatively low – roughly equivalent to those of 20 litres of petrol.
Dog poop scoop bags
These showed a surprisingly large footprint, surpassed only by gas, electricity and (just) road fuels:
Dog Poop Scoop bags Quantity
Box Box Factor kgCO2e
size weight kg /kg
HDPE oxo-degradable, 180x280x380mm 400000 2000 6 2.3 2760
Although this figure initially appears very high, 400,000 bags weigh 1.2 tonnes (including packaging). The
weight is taken from the vendor's website and includes cardboard box (less than 600g) and bags, but the
footprint factor for cardboard is not dissimilar. Again, purely for comparison, 1,114 litres of diesel weighs
around 925kg, so the dog bags weigh around 30% more than the fuel purchased by the Council.
The factor used is based on HDPE with prodegradant additive (most likely TDPA from EPI); manufacturing is
assumed to be in China with seaborne shipping to the UK. More than half the emissions come from the
production of the raw material (HDPE) with smaller components from manufacturing, shipping and end of
life disposal – this final element is open to additional uncertainty as the material is unlikely to be separated
from the content. JRB Enterprises were contacted by email to confirm some of this data, but sent a slightly
ambiguous response confirming the bags were oxo-degradable but linking to a fact sheet about oxo-
biodegradable bags: this may be due to the planned withdrawal of the former (which leave micro-plastic
grains in the soil).
Concrete
Globally concrete (and in particular the cement used in it) is estimated to be responsible for around 8% of
CO2 emissions. West Bletchley Council’s use was limited to purchase of a small number of bags of dry ready
mix; emissions from water added are accounted for elsewhere.
Concrete Qty Bag Factor kgCO2e
(dry) mix bags of ready mix concrete from B&Q 5 20kg 0.129 12.9
West Bletchley Council: Carbon Footprint & Energy Audit 11 ibeccs Ltd, August 2020This is so low as to be negligible. Although global emissions are huge, the volumes used in the construction
industry are similarly huge and 5 bags – most likely used for securing a few posts – are insignificant.
Other Scope 3 sources – not quantified
Service user emissions (equivalent to customer or product emissions for a company) were mentioned
under travel above and are unlikely to be significant.
The list of 2019-20 purchases reveals a typical variety of small purchases, none of which are likely to be
significant and many of which will occur only infrequently. Items that might have slightly higher associated
emissions include “26 cans of paint (various)” and “7 steel storage units”.
The list also includes “2 x AdBlue” which will be a recurring purchase to dose the exhaust emissions of the
diesel van. AdBlue® has a relatively low carbon footprint itself – it is 67.5% water and 32.5% urea – and
although there are emissions associated with its packaging and transport, with the quantities purchased by
WBC these will be tiny. Moreover, AdBlue converts exhaust emissions of nitrous oxide (N2O), which is a gas
that contributes to global warming, to nitrogen (which does not), and on a net calculation basis is claimed
to reduce emissions compared to vans using diesel without AdBlue.
Looking forward to 2020-21 there will be one large, non-recurring source of emissions – the resurfacing of
all the paths in Rickley Park. It is suggested that although these could be quantified, they are omitted from
any targets or tracking of long-term trends.
Conclusion
West Bletchley Council has adequate records to be able to compute an organisational carbon footprint in
line with Defra/BEIS guidelines; more detailed records of fuel purchased would improve the quality of the
estimates. Its baseline data may be taken from the table below:
West Bletchley Council 2018-19 2019-20 Change
Carbon Dioxide Equivalent tCO2e tCO2e
Scope 1: Gas 16.2 14.2 -12.3%
Scope 1: Road fuels 3.1 2.8 -9.4%
Scope 2: Electricity 7.4 7.5 0.3%
SUBTOTAL Scopes 1/2 26.8 24.6 -8.4%
Scope 3: Selected sources n/a 4.0
TOTAL FOOTPRINT 28.6
Areas of potential concern include:
the underlying growth of electricity consumption between the two years, especially in Whaddon
Way, which is largely masked by a fall in the Defra/BEIS conversion factor
the absolute level of gas consumption in Whaddon Way.
When setting a trajectory towards net zero, the council may wish to consider:
short term savings through behavioural changes and purchasing decisions
opportunities for upgrading building fabric (eg. insulation)
longer term changes, including potential for photovoltaics and heat pumps
electrification of vans when they fall due for replacement
“insetting” opportunities through tree planting on council managed property.
These are discussed further in part 2 below.
West Bletchley Council: Carbon Footprint & Energy Audit 12 ibeccs Ltd, August 2020Part 2: Energy Audit
Following the initial footprint calculation, a short energy audit visit was undertaken, visiting the two main
buildings (Frank Moran Centre and 221 Whaddon Way).
Key Building Characteristics
221 Whaddon Way Frank Moran centre
Built Form Single storey, irregularly shaped Single storey – half of rectangle (shared
building with playgroup)
Construction 1960s (?) 1990s with 2016 extension to front
Floor area 321m2 162m2
Rooms Hall (council chamber) Resource Centre
Open plan office Hall with attached kitchen
Seven meeting/store rooms Two small meeting rooms
M/F toilets, plus 2 small toilets M/F toilets
Walls Cavity – probably unfilled Cavity – filled (on construction)
Glazing Double, mainly 12mm air gap Double, 20mm air gap extension;
Double, 6mm air gap original building
Roof Pitched tiled; various orientations (SW Shallow pitch; corrugated system; SW
& NE marginally most common) and NE facing
Rockwool insulation (50-100mm) at Spray foam insulation to underside of
rear; Glass fibre (150mm in theory) at roof – ca25mm
front; Uncertain over hall
Roof lights 12 Velux windows (6 square, 6 narrow) None
Draught lobby No – lobby open to main open office Yes
Heating system Worcester Bosch Glowworm Betacom 28
47kW Gas condensing boiler (2018) 24.5kW Gas condensing boiler (2016)
Seasonal 93% efficient Seasonal 89.2% efficient
DHW From gas boiler From gas boiler
Controls Timer, two thermostats (zones); Analogue Timer, stat;
TRVs (mainly Drayton TRV4) TRVs
Secondary heating Informal use of igenix IG2600 2kW oil n/a
filled radiators
Lighting Mix of T8 fluorescent (lesser used areas) Mainly LED strips
and LEDs (strips & uplighters)
Appliances Photocopier/printer; various kitchen Photocopier/printer; large gas range; 2
items incl. microwave; small fridge; fridge/freezers; 1 fridge; hot water urn;
power tools lincat hot water boiler; toasters, etc.
The Whaddon Way building is similar in construction to a domestic bungalow, but has an unusual floor
plan, straggling from the front to rear of the plot, and the Council chamber is distinctly non-domestic in
scale. This layout is inherently inefficient as the external surface area (roof, walls and floor) is unusually
high in compared to the usable floor area – exacerbated further by the space given over to circulation (the
rear corridor) and toilets. Although the building appears to date from the 1960s, it is uncertain whether it
has been extended at any time, or whether it was initially built as seen: it is understood that at one time it
was used as a doctors’ surgery.
The Frank Moran centre is more recently constructed and had an extension added to the front of the
building in 2016 – at the same time as the new boiler was installed. Also single storey, its roof is a single
skin profiled metal roof. Both buildings have sealed unit double glazing with various air gaps, ranging from
narrow (ca4mm) on the older parts of the Frank Moran centre to 20mm on the front extension.
West Bletchley Council: Carbon Footprint & Energy Audit 13 ibeccs Ltd, August 2020Both buildings are heated by a quasi-domestic central heating system, using a modern high efficiency gas
condensing boiler supplying radiators fitted with thermostatic radiator valves (TRVs), centrally controlled by
timers and thermostats. Hot water supply for toilet basins and sinks comes from the boilers. Whaddon
Way operates on a two zone system, with a portable radio thermostat located in the main office
augmenting a fixed thermostat in the corridor. Both systems are adequate for their purpose, although it is
possible that replacing some of the older TRVs may marginally improve system performance (see under
energy efficiency section below). Some radiators are boxed in – this tends to slightly affect their
performance – mainly through making them less responsive, but in all such cases the TRV sensors were
fitted outside the boxing.
The recommendations below are split into three sections:
no-cost or very low-cost behavioural measures, including possible changes to procurement and
record keeping;
basic energy efficiency improvements
higher cost measures, mainly around renewable energy or with long payback periods.
All recommendations are generic rather specific, and for physical measures it is recommended that three
quotations from a member of a recognised trade association are obtained before commissioning the work.
Although most affect direct energy use, and hence are likely to lead to cost savings as well, those marked as
“scope 3 only” are likely only to impact the wider carbon footprint.
No cost or low-cost measures
Optimise existing loft insulation (Whaddon Way)
The existing insulation above the main office has become uneven, with some small areas becoming bare.
Although the overall thickness is acceptable (not outstanding) this could result in cold spots in the office
below and reduces its overall effectiveness:
Ideally this should be relaid completely, but someone (wearing suitable protective equipment) could also
redistribute some of the worst areas.
It was also noted that neither loft hatch was insulated, and both lacked any form of draughtstripping
around the edge. A rectangle of insulation material, preferably bagged and stapled to the top surface of the
hatch, together with inexpensive compression draughtstrip round the lip, would remove an obvious cold
spot on the ceiling.
Review heating settings and secondary heating use (Whaddon Way)
The significant increase in energy use between the two years’ electricity and gas bills has been noted
above. One possible reason is that there may have been an increase in the use of portable electric heaters;
West Bletchley Council: Carbon Footprint & Energy Audit 14 ibeccs Ltd, August 2020each uses 2kW when switched on and is not being limited by its inbuilt thermostat. Although these can be
useful for providing a short term boost in a small area, they are expensive to run, and should not be
necessary under day to day conditions. As there was also an increase in night units used, it may be that
some were being left on 24/7 – if this is the case and it was done to get the office up to an acceptable
temperature first thing in the morning, it would be worth looking at the setting times on the main central
heating system. The settings on the two zonal thermostats should also be reviewed, to ensure that heat is
available where needed within the office.
The thermostatic radiator valves (TRVs) should also be checked periodically, to ensure that they are
responding to changes in temperature and are not “stuck” in an on or off position.
It may also be with looking at desk layouts and seating plans, to see if any desks (or staff susceptible to cold
spots) are in areas subject to draughts that could be mitigated. As the reception desk is open to the lobby,
it may be worth looking at if there are ways this could be partially screened, without creating an
unwelcoming feeling for visitors.
Review employee engagement
With the recent appointment of an environmental projects officer, this would be an ideal time to review
employee engagement (and, to be honest, I am sure this is already happening). Given the relatively small
number of employees in total, scope is somewhat limited, but it could include:
appointing an energy champion for each building
displaying energy consumption for the past 3 months on the office noticeboard (and this would
require taking monthly, manual readings at Frank Moran)
organising a competition between the two buildings as to which can make the greatest savings
SSE will provide, without charge, a non-domestic smart meter for all three sites which should help keep a
closer eye on electricity use. They will also provide an online reporting package called Clarity, that may
help track energy consumption on an ongoing basis.
Review Purchasing and Procurement policy (scope 3)
It is understood that purchasing is undertaken on an “ad hoc” basis, with irregular and often small
deliveries requested from suppliers. While the emissions associated with delivery vans for items of
stationery, etc. are not recorded, these could be minimised by keeping to a more regular ordering cycle;
this might also minimise delivery charges.
Any review should also look at the goods purchased – including the origins of plant materials for the parks,
use of recycled or sustainable materials for office supplies, with an eye to keeping indirect emissions as low
as possible.
The large scope 3 emissions associated with the dog waste bags has been discussed in Part 1 – more detail
on the process is included in an Appendix. Although it might be superficially attractive to eliminate the
scope 3 emissions (and not insignificant costs) associated with providing dog waste bags to residents, on
environmental grounds this would probably not be recommended, as it might lead to more use of non-
biodegradable bags by residents in the waste stream, and in simple emissions terms would simply move the
responsibility from the Council to those residents.
Ongoing record keeping (scope 3)
Allied to procurement, there were no details apparent for volumes of fuel purchased, or distance travelled,
by the vans – records were restricted to cost. Keeping records on a simple spreadsheet should enable
greater control of energy consumption, although there is no evidence that any fuel is being used for non-
council business. Distances driven would not generally justify measures such as driver-training courses.
West Bletchley Council: Carbon Footprint & Energy Audit 15 ibeccs Ltd, August 2020Basic energy efficiency improvement measures Improve Loft Insulation The need to relay or redistribute the insulation above the main office at Whaddon Way has been noted above. Insulation to the rear of Whaddon Way is Rockwool, laid neatly between the joists (right), but only to a depth of around 50mm – it may have been more initially, but in that case has become compressed. Adding a minimum 100mm additional insulation to bring up to the top of the joists, and then, preferably, a cross layer where there is no boarding, would significantly reduce heat losses through this part of the building. Owing to the large ceiling area over rooms with limited use, payback periods would be longer than normal for insulation measures, but should still be in the range of 5-10 years. The situation in Frank Moran is very different, as insulating foam has been sprayed directly into the underside of the profiled metal roof. This should generally be adequate, but a quick review at a randomly chosen location revealed that there might be small gaps where the foam has not penetrated (highlighted in the photo below left above the office, probably from the part extended in 2016), and there may also be thermal bridging between uninsulated support beams and the main roof (below right, taken above the main hall, not the office): One possible approach may be to hire a drone with a small thermal imaging camera, and photograph (or video) the top surface of the roof on a very cold winter day when the building is being heated, to see if – and where – there are apparent thermal bridges allowing heat to escape. Despite the apparent flaws in the insulation, it may be that the total heat loses are insignificant (or could be stemmed by simply adding a little additional sprayed insulation or even mastic). Cavity Wall Insulation (Whaddon Way) 221 Whaddon Way will have initially been built with unfilled cavity walls. From an external inspection, there is no evidence that cavity wall insulation has been retrofitted – if done, there are usually small tell- tale marks in the mortar where insulation material has been blown through. It is recommended to find a local trusted installer registered with CIGA, the Cavity Insulation Guarantee Agency, be found to perform a check on this (which will typically require drilling a small hole into the wall and looking at the cavity through an endoscope) with a view to quoting on adding such insulation. Costs should be acceptable as the form of the building should avoid need for scaffolding, although the wall area needing to be treated is high in relation to the internal floor area. West Bletchley Council: Carbon Footprint & Energy Audit 16 ibeccs Ltd, August 2020
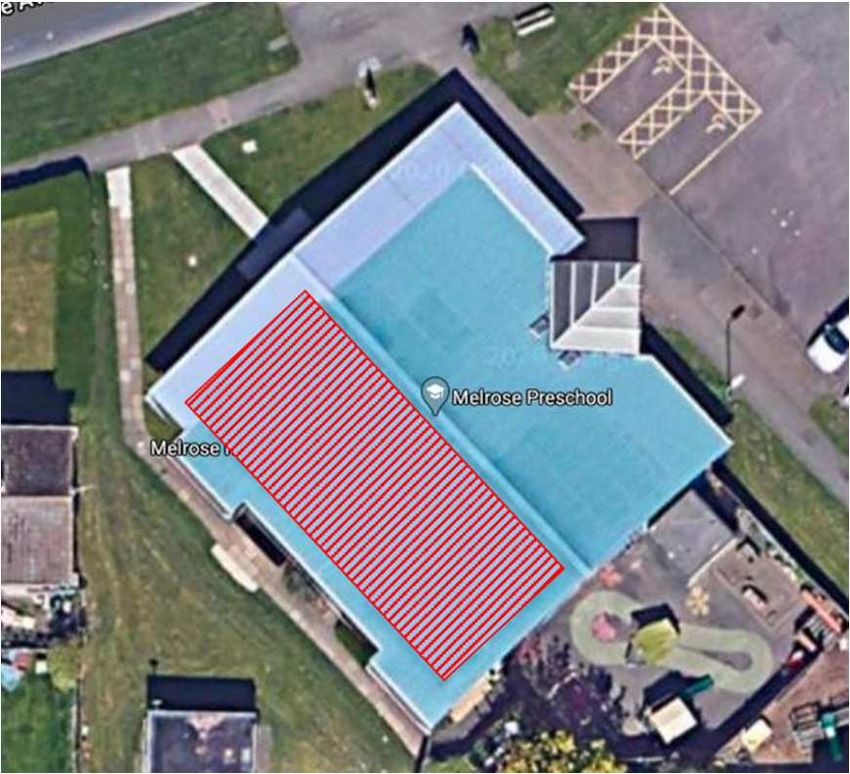
Lighting controls (Whaddon Way)
It was noted that a number of lights were on in
Whaddon Way at the time of the visit, including
some in the main office above circulation areas and
next to Velux roof lights. Although they utilise low
energy LED strips, it would be worth monitoring this,
and giving consideration to their switching
arrangements – for example by ensuring that can be
switched separately from those over the desks
nearer the reception area. If switching is to be
modified, the ones at the rear (towards the kitchen)
could potentially be linked to a motion sensor or
daylight monitor. Corridor lights, which were correctly switched off at the time of the visit, could also be
linked to motion sensors – there are emergency lights in place (and on) that would permit the main lights
to be so controlled.

It is also suggested that the external lighting be reviewed. At the time of the visit, it was uncertain whether
these are left on all night, or what type of bulbs are used – as most appear to be conventional lights, rather
than floodlights, they could be fitted with LEDs (assuming that they have not been done so to date). It may
also be possible for them to be placed on a timer or with a daylight sensor, depending in part on security
requirements.

Higher cost measures – renewables and energy efficiency
Adding photovoltaic panels
Both sites have considerable areas of SW facing roof, not subject to overshading. These are likely to be
suitable for the addition of photovoltaic (PV) panels that will generate electricity during sunny spells – for
each kilowatt-peak of panel installed, at the available orientations (SW – below) and roof inclinations (Frank
Moran is only a shallow angle), annual output of around 750-800kWh would be expected. Owing to the
Velux skylights, providing it could bear the load, the Frank Moran centre would be more appropriate.

Feed-in tariffs are no longer available for new PV installations, so simple payback periods have crept up to
around 15 to 20 years – which is still well within panel lifetimes (although inverters may need to be
replaced during this period). Maintenance costs are low, and in the UK panels do not generally need to be
cleaned – the costs of doing so exceed the slight reduction in performance from any build up of dirt on the
surface, and rain tends to keep them reasonably clean.

West Bletchley Council: Carbon Footprint & Energy Audit        17                          ibeccs Ltd, August 2020
Care would need to be taken to ensure the weight of the panels could be borne by the flatter roof at Frank
Moran, as well as the lift generated by airflow over the panels. Any fixing system, which would presumably
need to penetrate the profiled roof material, would need to be designed carefully to avoid the risk of leaks
as well as not creating thermal bridging to the heated space below. Competent installers, registered with
the Solar Trade Association, should be able to confirm suitability.
It is understood that WBC is in discussions with Wolverton Community Energy about opportunities for PV,
and these are encouraged as a way of financing the upgrades.
Upgrading vans & installation of EV charging point
When the next van is due for replacement, it is recommended that an electric van (EV) be selected. As
noted in Part 1, there are currently few models available on the UK market but this is likely to change
rapidly (see Appendix 1; almost all have ranges between charges that are adequate for WBC). Currently
vans can benefit from a grant of up to the lower of 20% of the cost or £8,000). A van would also benefit
from the installation of a dedicated charge point – this could be a fast charger, of up to 22kW, and need not
be a rapid charger (50kW plus), as vans could be charged overnight. Any charger could also be made
available for staff or visitors to use during the day, subject to a billing system. WBC could fund the charging
point itself, although there are some chargepoint providers who will install and maintain units, such as
Engenie – although they tend to prefer to install publicly accessible rapid 50kW units in order to get the
customer throughput: this would be likely to require an upgrade to the building’s electrical connections,
incurring additional costs.
Chargepoints could, of course, be installed before switching the council’s own vans to electric power; either
Whaddon Way or the Frank Moran centre parking areas could accept a chargepoint.
If future charging is to be restricted to the two vans, then a slow (domestic-type) charging system may also
be possible, with overnight charging at around 3 to 6kW.
Glazing (Frank Moran)
Generally, glazing units appeared to be of reasonable quality with reasonable air gaps. The one exception
are the windows in the main hall at Frank Moran which date from when the building was first constructed
and have a very narrow (probably 4mm) air gap. Energy savings through replacing these would not justify
the cost of doing so, but this should be kept in mind as a long-term upgrade, especially if the use of the hall
changed to more intensive occupation.
Replacement of heating boilers
Falling very much into the category of doing in the future, not now, in the long term (post 2030) when the
boilers fall due for replacement, they will most likely need to be replaced by heat pumps. Both locations
have sufficient land around them to make trench-based ground source heat pumps a viable option in
preference to air source heat pumps.
Carbon Insetting
As a final measure, West Bletchley Council may wish to consider “insetting” – planting trees on land under
its control or management. This is seen as a preferable alternative to offsetting, where organisations or
individuals purchase tradable certificates showing that carbon emissions have been reduced, usually
internationally. (The UK government does not recognise use of domestic offsets for measures undertaken
in the country as they would be double counted at the national inventory GHG accounting level.)
WBC has had contact with Earthwatch Europe about its Tiny Forest concept claiming:
600 native trees planted in a tennis court size plot.
Up to 30 times denser than conventional tree plantings per hectare of land.
West Bletchley Council: Carbon Footprint & Energy Audit 18 ibeccs Ltd, August 2020 Up to 10 times faster growing than regular forests due to the planting & management methods.
A new dense green space with low management requirements, becoming maintenance free after
three years.
Chemical and fertiliser free forest that sustains itself once established, and supports local
biodiversity.
An associated programme of community engagement.
Earthwatch calculate that an average Tiny Forest can absorb a net 0.4 to 0.65tCO2 after four years.
The Woodland Trust also work with councils to enable tree planting schemes. On a slightly larger scale,
they are encouraging the development of Community Woodlands, where councils provide land and finance
for tree planting, but the actual development is done in partnership with the local community.
Either approach would simultaneously reduce the Council’s carbon footprint and provide an additional
amenity for its residents.
Summary Table of Measures
Measure Location Cost Savings Payback
Optimise existing loft insulation WW Very low Low Under 1 year
Loft hatch insulation & draughtstripping WW Very low Low Under 1 year
Review heating settings and secondary WW None Low/medium Immediate
heating use
Check operation of TRVs/rebalance system Both Very low Low Under 1 year
Employee engagement Both None Low/medium Immediate
Install non-domestic smart meter FM None Very low Immediate
Review Purchasing and Procurement policy Scope 3 None Uncertain Immediate
Ongoing record keeping Scope 3 Very low Very low n/a
Improve Loft Insulation WW Medium Medium 2-5 years
Check/patch underroof spray foam insulation FM Low Low/medium 2-5 years
Cavity Wall Insulation WW Medium Medium 3-8 years
Lighting controls WW Medium Low 3-8 years
External lighting review WW Low None/medium 25 years
Replacement of heating boilers Both High Medium >10 years
Carbon Insetting Scope 3 High? Uncertain Varies
All data in the above table for physical measures assume typical commercial (professional) costs, with the
exception of the loft hatch insulation.
West Bletchley Council: Carbon Footprint & Energy Audit 19 ibeccs Ltd, August 2020Appendix 1: Electric Vans on, or forthcoming, UK market
Comparison of official electric van driving range:
Van name Van type/size Official driving range
Renault Zoe Van (2020) Car-derived 245 miles WLTP
van
Renault Kangoo ZE 33 Small van 143 miles WLTP
Nissan e-NV200 40kWh Small van 124 miles WLTP
Citroen Berlingo Electric (old) Small van 106 miles NEDC
Peugeot Partner Electric (old) Small van 106 miles NEDC
Maxus e Deliver 3 (2020) Small van Up to 150 miles WLTP
(depending on van and battery size)
Citroen e-Berlingo (2021) Small van To be confirmed
Peugeot e-Partner (2021) Small van To be confirmed
Toyota Proace City electric (2021) Small van To be confirmed
Vauxhall Combo-e (2021) Small van To be confirmed
Mercedes eVito (2020) Medium van 92 miles WLTP
VW eTransporter (2020) Medium van 82 miles WLTP
Vauxhall Vivaro-e electric (2020) Medium van 143-205 miles WLTP
(depending on van and battery size)
Citroen Dispatch electric (2020) Medium van 143-205 miles WLTP
(depending on van and battery size)
Peugeot e-Expert (2020) Medium van 143-205 miles WLTP
(depending on van and battery size)
Toyota Proace electric (2020) Medium van 143-205 miles WLTP - TBC
(depending on van and battery size)
Sokon / DFSK EC35 (2020) Medium van 138 miles
Morris Commercial JE (2020) Medium van 200 miles (untested claim)
VW ID Buzz Cargo (2022) Medium van To be confirmed
Renault Master ZE Large van 124 miles WLTP
LDV EV80 Large van 127 miles NEDC
Mercedes eSprinter (2020) Large van 71-93 miles (depending on battery packs)
VW e-Crafter (2021) Large van 68-71 miles WLTP
MAN eTGE (2021) Large van 68-71 miles WLTP
Ford Transit electric (2021) Large van To be confirmed
Iveco Daily Electric Large van Varies with number of battery packs
Citroen e-Relay (2021) Large van 99-140 miles
Peugeot e-Boxer (2021) Large van 99-140 miles
Fiat Ducato Electric (2020) Large van 136-223 miles
Maxus e Deliver 9 (2021) Large van To be confirmed
Source: Parkers Guide, accessed August 2020
West Bletchley Council: Carbon Footprint & Energy Audit 20 ibeccs Ltd, August 2020Appendix 2: Oxo-biodegrading Process
The Dog Poop bags purchased by West Bletchley Council are made from high density polyethylene (HDPE) and contain up to 1% of an additive using the
trade name d2w®, designed to render them “oxo-biodegradable”. In essence this means that although the bags have a reasonably long (typically two years
or more) shelf life when stored in dark, dry conditions. However, when the product is discarded in the environment, factors such as heat, UV radiation,
mechanical stress generated by wind, rain, friction and tension between layers in a landfill destroy the stabilization package incorporated in the finished
product and the plastic material is left with no protection to the degradation process.
The diagram below is reproduced with slight modifications from Symphony Environmental Ltd’s technical briefing note on the process:
STAGE 1 STAGE 2 STAGE 3
Pro-degradant: metal stearate Oxidation: oxygen/UV/heat CO2 + H2O + Biomass
Thermo- and photo-oxidant Short chain hydrophilic Biodegradation
The catalytic effect of the d2w additive The free radicals combined with the The resulting short-chain hydro peroxides
quickly breaks the long chains and generates available oxygen atoms create hydro- are now available for consumption by
free radicals. During the abiotic (chemical) peroxides. micro-organisms.
phase the polymers undergo free radical These shorter chained molecules are now The biodegradation process creates
oxidation reactions which result in short hydrophilic (attract moisture). harmless residues as CO2, H2O and
chained molecules. Biomass.
This is different from a simpler oxo-degradable process, which abiotically breaks up the chains into shorter molecules, but does not permit them to be used
as food by micro-organisms, resulting in micro-plastics that can remain in the environment for many years and enter the human food chain. Under the EU
Single Use Plastics Directive of 2019, oxo-degradable plastics are to be banned from 2021, as they lead consumers into a false belief that the products are
safe to leave in the environment. However there is some doubt as to how completely oxo-biodegradable plastics degrade under normal conditions.
The WBC footprinting calculation for the bags did not explicitly recognise any additional CO2 resulting from the biodegradation of the bags (or their
content). A calculation based on molecular formulae suggests that the bags’ CO2 residues would be approximately 3.14tCO2 for every tonne of bags.
West Bletchley Council: Carbon Footprint & Energy Audit 21 ibeccs Ltd, August 2020You can also read