Ōwhiro Bay Coastal Engineering Options Assessment - Prepared for
←
→
Page content transcription
If your browser does not render page correctly, please read the page content below
Ōwhiro Bay Coastal Engineering
     Options Assessment

           Prepared for: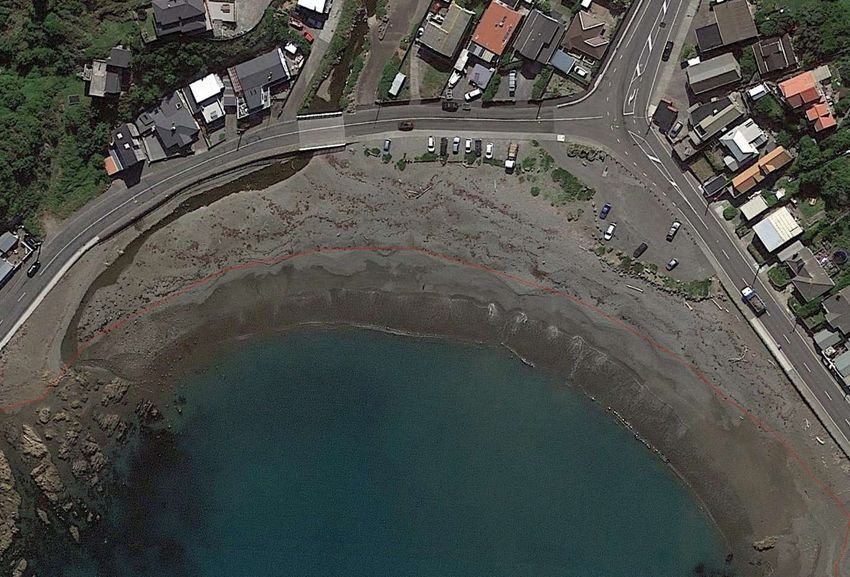
Ōwhiro Bay Coastal Engineering
            Options Assessment

                                                Report Status

Version                      Date                          Status                     Approved by
V. 1                         11 March 2021                 Final Draft                RM

        It is the responsibility of the reader to verify the version number of this report.

                                                     Authors

                                Shaw Mead BSc, MSc (Hons) and PhD

The information contained in this document, including the intellectual property, is confidential and propriety to
Ecological and Physical Coastal Consultants Limited (T/A eCoast). It may be used by the persons to whom it
is provided for the stated purpose for which it is provided, and must not be imparted to any third person without
prior written approval from eCoast. eCoast reserves all legal rights and remedies in relation to any infringement
of its right in respects of its confidential information. eCoast© 2021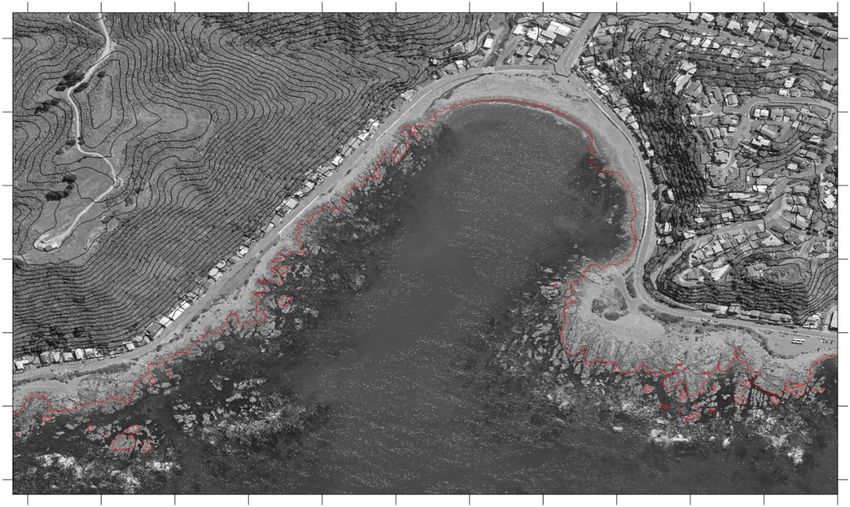
Ōwhiro Bay Coastal Engineering Options

                                                           Contents
Contents ................................................................................................................................ i

Figures ...................................................................................................................................ii

Tables ...................................................................................................................................iv

1     Background.................................................................................................................... 5

2     Physical Setting ............................................................................................................. 8

    2.1      Wave Climate ......................................................................................................... 9

    2.2      Tides ..................................................................................................................... 11

    2.3      Topography/Bathymetry ........................................................................................ 11

    2.4      Historical Imagery ................................................................................................. 13

3     Climate Change (CC) and Sea Level Rise (SLR) ......................................................... 15

4     The 15th April 2020 Extreme Over-Topping Event ........................................................ 17

    4.1      Over-Topping in Extreme Events .......................................................................... 17

    4.2      Components of the 15 April 2020 event ................................................................ 18

    4.3      April versus July Extreme Events .......................................................................... 19

5     Ōwhiro Bay Residents Association Coastal Survey...................................................... 21

6     Options Assessment .................................................................................................... 23

    6.1      Monitoring ............................................................................................................. 23

    6.2      Do Nothing ............................................................................................................ 27

    6.3      Beach Management: Reduction of the Berm Height.............................................. 27

    6.4      Dune Planting Stabilisation ................................................................................... 28

    6.5      Protect with Seawalls and Revetments ................................................................. 30

    6.6      Creation of Buffers ................................................................................................ 33

    6.7      Managed Advance/Buy Time – Offshore Structures.............................................. 35

    6.8      Hybrid Solutions –Management and Forecasting and Structures .......................... 37

    6.9      Retreat .................................................................................................................. 37

7     Recommendations ....................................................................................................... 38

    7.1      Short Term Management ...................................................................................... 38

                                                                                                                                            i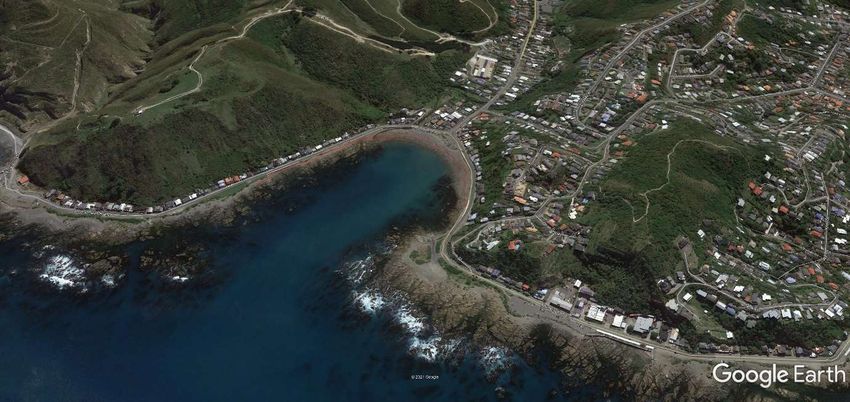
Ōwhiro Bay Coastal Engineering Options

      7.1.1         Monitoring System ......................................................................................... 38

      7.1.2         Beach Grading ............................................................................................... 38

      7.1.3         Improvement of Forecast/Warning System .................................................... 39

   7.2       Medium Term Management .................................................................................. 39

      7.2.1         Revetment Construction ................................................................................ 39

      7.2.2         Buffer Zones/Coastal Vegetation ................................................................... 40

   7.3       Long Term Management ....................................................................................... 40

References ......................................................................................................................... 43

Appendix A – Historical Imagery ......................................................................................... 45

Appendix B – Ōwhiro Bay Residents Association Coastal Survey ....................................... 53

Appendix C – Remote Video Monitoring System ................................................................. 54

                                                             Figures
Figure 1.1. Extreme over-topping at Ōwhiro Bay on 15th April 2020. .................................... 5
Figure 1.2. Community engagement is a fundamental component for the development of
successful coastal protection and adaptation and corresponds to many of the elements
required to secure and implement a long-term strategic planning and decision-making
framework for coastal areas potentially, or already, affected by coastal hazards and climate
change effects, such as sea-level rise. (Source: MfE, 2017. Coastal Hazards and Climate
Change: Guidance for Local Government). ........................................................................... 6
Figure 2.1. Location of Ōwhiro Bay. ...................................................................................... 8
Figure 2.2. Ōwhiro Bay is a shingle pocket beach with platform reefs along the eastern and
western sides and is constrained by seawalls and a coastal road around the entire bay (Figure
2.1). ...................................................................................................................................... 9
Figure 2.3. Wave roses of significant wave height (Hs) and peak period (Tp) for the location
shown (42 S, 175 E)............................................................................................................ 10
Figure 2.4. Tides in Wellington Harbour (top), which the tide tables are based on (Table 2.2),
have a larger range than tides on the open coast at Ōwhiro Bay (bottom). ......................... 11
Figure 2.5. LiDAR topography of Ōwhiro Bay. Top) Contours from zero (red) in 5 m
increments. Bottom) The embayment levels from zero (mean sea level) to 5 m high; note the
lowest area in the NW of the bay. ....................................................................................... 12
Figure 2.6. Ōwhiro Bay is a relatively shallow and narrow embayment, which is 8-9 m deep
at the entrance, shoaling to 2 m deep at the head of the bay. ............................................. 13

                                                                                                                                            ii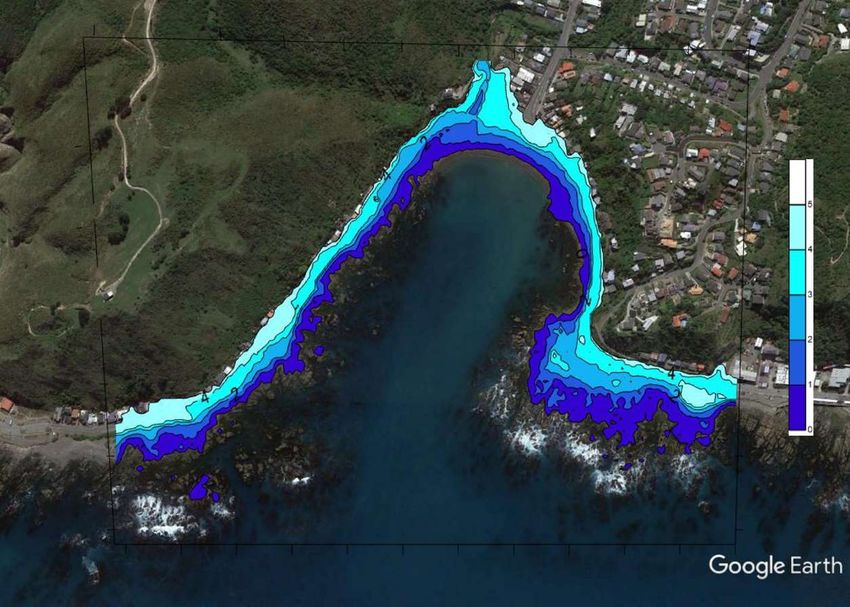
Ōwhiro Bay Coastal Engineering Options

Figure 2.7. Replacement of the circa 1930’s mortared brick seawall on the eastern side of
Ōwhiro Bay. ........................................................................................................................ 14
Figure 3.1. Four scenarios of New Zealand-wide regional sea level rise projections to 2150
based on Kopp et al. (2014) cited in MfE (2017). ................................................................ 15
Figure 3.2. Based on RCP 8.5, in 30 years’ time, extreme water levels with a now day 1 in
200 year return period could have a 1 in 2.5 year return period. The sea level is projected to
rise 0.3 m in the next 30 years (blue arrow). At present, a 1 in 200 year return period event
results in an extreme water level 0.3 m higher than the usual mean level of the sea (amber
arrows). With an addition of 0.3 m water level, the same extreme water level that occurs once
every 200 years on average will occur every 2.5 years on average (red arrows)................. 16
Figure 4.1. The metocean components that lead to wave over-topping in extreme events. 17
Figure 4.2. Significant wave height (top) and peak wave period (bottom) at the extraction
location for the April 15, 2020 event at Ōwhiro Bay. The date marks are in UTC, which means
they are at noon NZST, meaning that the peak of the event coincided with the noon high tide,
allowing for approximately 1 hour for 14.7 second period waves to propagate from the
extraction location (these waves were moving at ~20 m/s over a distance of ~ 70 km – Figure
2.3). .................................................................................................................................... 18
Figure 4.3. Barometric pressure data from Wellington airport. ............................................ 18
Figure 6.1. A remote monitoring camera installation at Lyall Bay (Atkin et al., 2017). ......... 24
Figure 6.2. Over-topping example images at Manu Bay breakwater, Raglan, taken from the
11th April 2019 at high tide during inclement conditions (multi-direction incident swells,
northerly winds, low pressure) (Mead, 2020). ...................................................................... 24
Figure 6.3. Rectification of the Whaingaroa Bar to determine breaker locations and sand bars
(Harrison and Bryan, 2014) ................................................................................................. 25
Figure 6.4. (Top) Ōwhiro Bay is well suited to remote video monitoring due to the elevated
topography. (Middle) There are several potential powered sites on the eastern side of the
bay, (Bottom) as well as the option for a remote system on the top hill country on the western
side of the bay..................................................................................................................... 26
Figure 6.5. Results from the Overtopping Neural Network calculator simulations from (Top)
40 to 70 Ōwhiro Bay Parade where there is no reef platform and from (Bottom) 80 to 92 Ōwhiro
Bay Parade where there is a reef platform present, for present day and with 0.5 m of SLR. 28
Figure 6.6. Dune planting has significantly increased the width of the dune buffer zone at Lyall
Bay (Mead and Phillips, 2016). ........................................................................................... 29
Figure 6.7. Left) Dune stabilization at Island Bay, and Right) the gravel beach at Ōwhiro Bay.
........................................................................................................................................... 29
Figure 6.8. Top Left) The re-curved wall at Island Bay. Both Left and Right) The seawall and
revetment along the Esplanade near the Victoria University Coastal Ecology Laboratory. .. 30

                                                                                                                                           iii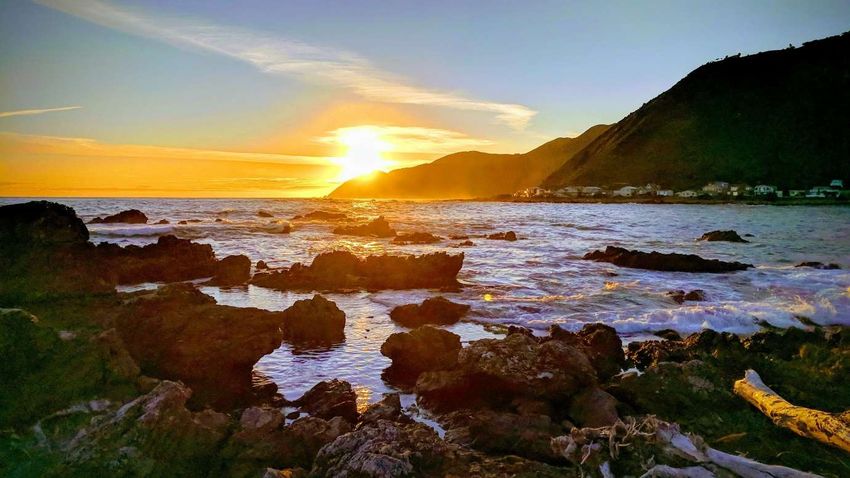
Ōwhiro Bay Coastal Engineering Options

Figure 6.9. The shingle beach is presently almost level with the footpath on the eastern side
of the bay where some of the worst over-topping occurred in April 2020. ............................ 31
Figure 6.10. Waves at the beach during the 15 April 2020 extreme event. ......................... 32
Figure 6.11. Potential rock revetment for Ōwhiro Bay to reduce wave run-up onto the road
and threatening properties during extreme events. ............................................................. 33
Figure 6.12. A buffer zone of coastal plants along The Esplanade. At Ōwhiro Bay it is
envisaged that there would be a lower wall/planting above a graded berm as to reduce any
impact on views across the bay. ......................................................................................... 34
Figure 6.13. Potential planted buffer zone above graded berm to reduce/prevent extreme
over-topping. ....................................................................................................................... 35
Figure 6.14. The submerged reef at Oriental Bay is designed to maintain beach sand along
the eastern part of the beach through wave rotation (Mead and Black, 2001).
(https://satellites.pro/New_Zealand_map#-41.290467,174.795637,19). .............................. 36
Figure 6.15. Waves breaking before entering Ōwhiro Bay on 15 April 2020. As can be seen
in Figure 2.6, the entrance to Ōwhiro Bay is relatively shallow, and so with the application of
the rule of thumb depth to wave height at breaking ratio of 0.78, a 6.7 m wave (i.e., the peak
significant wave height) will break in 8.6 m of water, with the largest waves of the 15 April
event likely breaking in water depths of ~15 m. ................................................................... 36
Figure 7.1.        Options to reduce or prevent over-topping at Ōwhiro Bay.                                      The immediate
recommendations include establishing a monitoring system (red star) and beach grading
(orange lines). Medium term management could include upgrade and extension of the rock
revetment (blue line) and the creation of buffer zones (green line). In the longer term, there is
potential that submerged breakwaters could be beneficial, although the efficacy, size and
location of these is presently unknown. ............................................................................... 42

                                                            Tables
Table 2.1. Return period wave heights. ............................................................................... 10
Table 2.2. Tidal ranges for Wellington. Elevations refer to chart datum. .............................. 11
Table 3.1. Comparison of metocean components during the extreme over-topping event on
15 April 2020 and the warning date of 1 July 2020. ............................................................. 19

                                                                                                                                     iv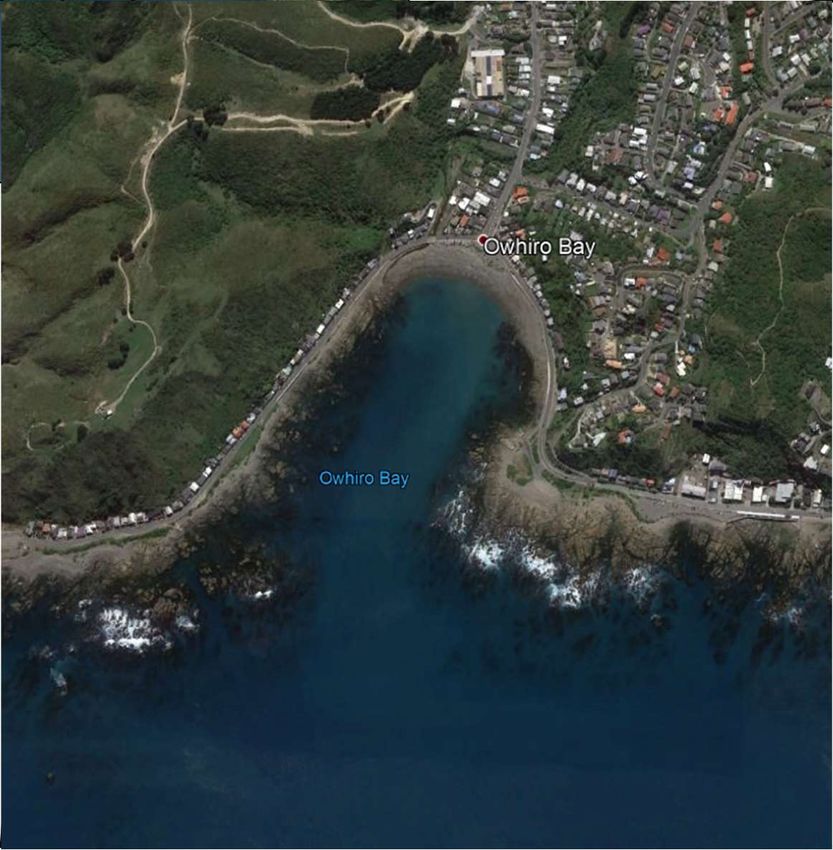
Ōwhiro Bay Coastal Engineering Options

1 Background
Ōwhiro Bay is vulnerable to over-topping during storm events. On 15th April 2020, a particular
extreme event occurred (discussed in Section 3 of this report), which resulted in extensive
damage and the commissioning of this investigation into coastal engineering options to
address the over-topping hazard by the Wellington City Council.

                   Figure 1.1. Extreme over-topping at Ōwhiro Bay on 15th April 2020.

The process undertaken to consider engineering options to mitigate the over-topping hazard
at Ōwhiro Bay was similar to that undertaken at Lyall Bay in 2016 (Mead and Phillips, 2016),
although more focussed and at a smaller scale. The approach was a compressed MfE (2017)
methodology that follows the 10-step decision cycle where community engagement is central
to the process (Figure 1.2).

                                                                                              5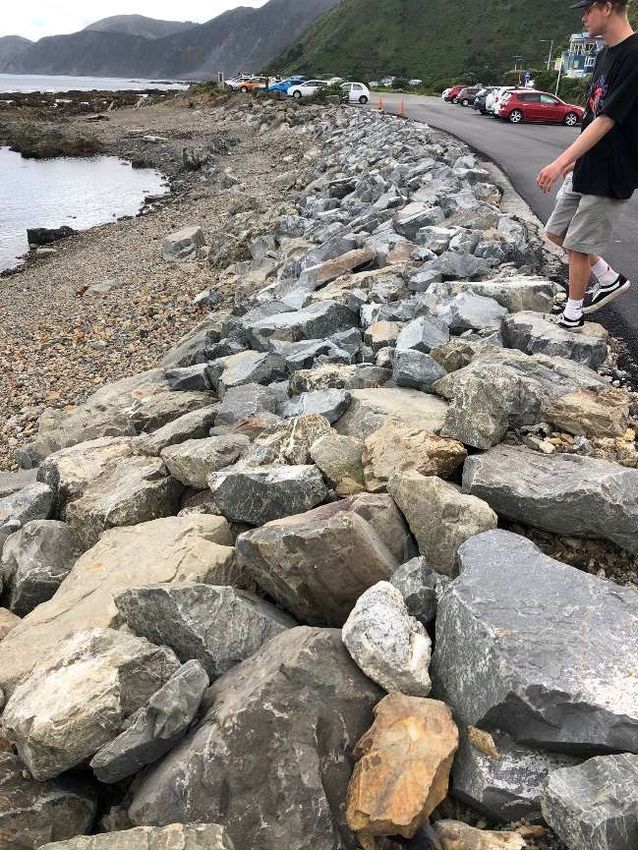
Ōwhiro Bay Coastal Engineering Options

  Figure 1.2. Community engagement is a fundamental component for the development of successful coastal
 protection and adaptation and corresponds to many of the elements required to secure and implement a long-
  term strategic planning and decision-making framework for coastal areas potentially, or already, affected by
 coastal hazards and climate change effects, such as sea-level rise. (Source: MfE, 2017. Coastal Hazards and
                              Climate Change: Guidance for Local Government).

The project included the following steps:

   1. Initial Stakeholder Consultation and Site Visit. Due to Covid-19 and the second
        Auckland lock-down (mid-August), the initial stakeholder meeting was undertaken
        remotely as a virtual meeting. This was to go through the issues and the aspects of
        the bay that are valued by the stakeholders (i.e., Questions 1 and 2 in Figure 1.2). This
        also included the development of a stakeholder questionnaire to collate detailed
        information form the stakeholders with respect to values, issues such as over-topping,
        erosion, etc.. A site inspection of Ōwhiro Bay and the various engineered structures
        around it was undertaken in late September 2020. The information gained from the
        initial stakeholder meeting, questionnaire and site visit have been incorporated into the
        options study to develop a set of viable options to address the issues existing at Ōwhiro
        Bay

   2. Collation and review of existing reports, literature and data pertaining to the site. This
        has included any existing survey data (in order to determine elevations of areas above
        the beach), historical aerial photography, and a variety of world-wide metocean

                                                                                                                 6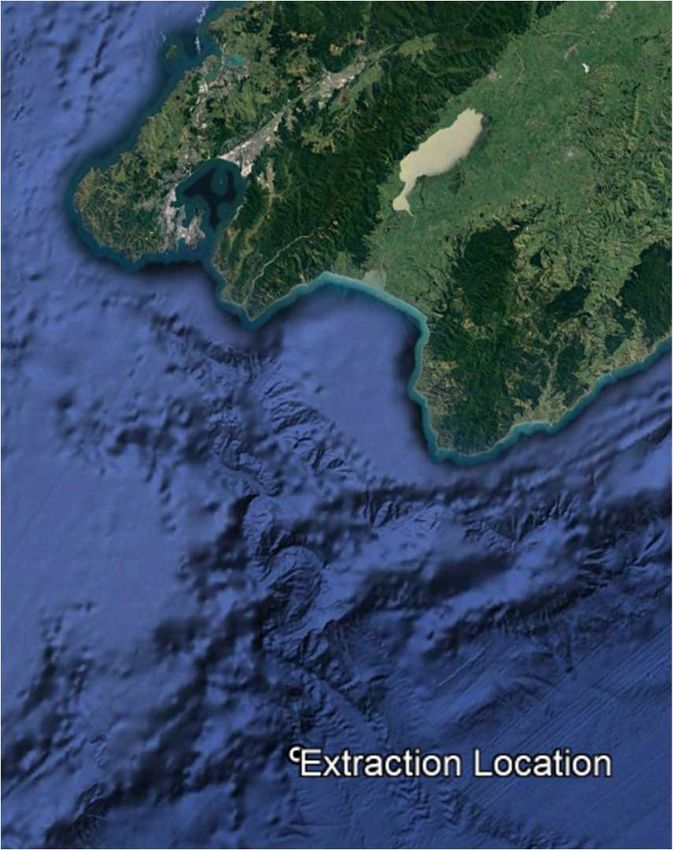
Ōwhiro Bay Coastal Engineering Options

   datasets (e.g. waves, winds, bathymetry, air pressure, etc), dating back to 1979 and
   earlier, which is updated each month. eCoast’s MDI (Metocean Data Interface) was
   accessed to provide long-term offshore wave data, regional bathymetry, nautical
   charts, wind data and tide data. Along with the information collected during the site
   visit and stakeholder meeting, these data were used to build up an understanding of
   the physical make-up of the site and the surrounding area, and the coastal hazards
   that it is subject to.

3. Identification and Evaluation of Options. A range of options were then developed
   based on the results of 1 and 2 above, that is, options that are viable for the location.
   Each option was then evaluated with respect to its applicability and the pros and cons
   (Question 3 of Figure 1.2).

4. Stakeholder Presentation.      The options evaluation then presented back to the
   stakeholders at Ōwhiro Bay on 21 February 2020, including recommendations on the
   best options to apply for this location. This provided further stakeholder input, and an
   opportunity to answer questions on the options

5. Reporting, graphics and specifications. This report includes concise descriptions of all
   of the above tasks and recommended implementation plan and monitoring/adaptive
   management (i.e. Questions 4 and 5 of Figure 1.2).

                                                                                          7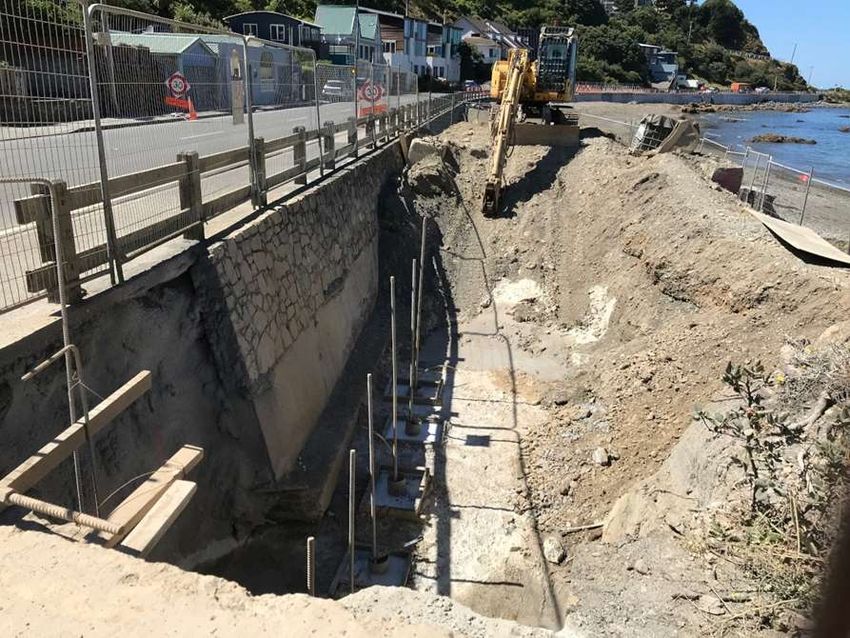
Ōwhiro Bay Coastal Engineering Options

2 Physical Setting
Ōwhiro Bay is a relatively small embayment on Wellington’s south coast (Figure 2.1).
Enclosed by steep headlands either side, the small sandy pocket beach faces south-
southwest and is backed by the coastal road. The coast here is characterised by an uplifted,
eroding rock platform reefs and shingle beach, and is considered an exposed and energetic
environment due to its exposure to large Southern Ocean swells.

                                Figure 2.1. Location of Ōwhiro Bay.

Comprising the western limit of Wellington’s residential south coast, the shoreline is developed
around the bay with the most significant modification being the road and its associated
seaward protection structures above the shingle beach (Figure 2.2).

                                                                                              8
Ōwhiro Bay Coastal Engineering Options
Figure 2.2. Ōwhiro Bay is a shingle pocket beach with platform reefs along the eastern and western sides and is
constrained by seawalls and a coastal road around the entire bay (Figure 2.1).
The geomorphology of the region is typical of a shore platform that has developed along an
actively uplifting coastline, with the most recent abrupt uplift event being the 1855 AD
earthquake (MM 8.1 – 8.2) associated with the Wairarapa Fault to the east of Wellington
Harbour. This thrusted the peninsula upward by about 1.5 m and contributed to an overall
uplift of 8 m (± 1 m) since 6500 BP (Pillans and Huber, 1995). Thickly bedded, Late Triassic
Greywacke dominates the geology of the region. The rocks are medium to coarse grained
quartzofeldspathic sandstone, occasionally interbedded with argillite and all dip steeply to the
west (Kennedy and Beban, 2005).
2.1 Wave Climate
A long-term time series of wave conditions dating back to 1979 was extracted from the
National Oceanic and Atmospheric Administration Wave Watch 3 (NOAA WW3) global wave
model. The Ōwhiro Bay offshore wave climate is summarised in the wave roses in Figure 2.3.
9Ōwhiro Bay Coastal Engineering Options Figure 2.3. Wave roses of significant wave height (Hs) and peak period (Tp) for the location shown (42 S, 175 E). A statistical analysis was carried out on the time series of wave heights in a directional bin from the southeast to southwest (i.e. the directions from which waves can approach Ōwhiro Bay, >140⁰ and
Ōwhiro Bay Coastal Engineering Options

2.2 Tides
The spring tidal range for Wellington Harbour is ~1.4 m (Table 2.2). However, Tides in
Wellington Harbour have a larger range than tides on the open coast at Ōwhiro Bay (Figure
2.4).

                     Table 2.2. Tidal ranges for Wellington. Elevations refer to chart datum.

                             MHWS        MHWN        MLWN         MLWS           MSL
                               1.8         1.4         0.7          0.4          1.13

Figure 2.4. Tides in Wellington Harbour (top), which the tide tables are based on (Table 2.2), have a larger range
                              than tides on the open coast at Ōwhiro Bay (bottom).

2.3 Topography/Bathymetry

Ōwhiro Bay has very steep topography with an intertidal rocky shore platform (Figure 2.5).
The embayment is constrained by steep cliffs from ~5 m above mean sea level (MSL), with
the fringing road being at 3-4 m above MSL, except in the NW corner of the bay (Figure 2.5)

                                                                                                              11
Ōwhiro Bay Coastal Engineering Options
Figure 2.5. LiDAR topography of Ōwhiro Bay. Top) Contours from zero (red) in 5 m increments. Bottom) The
embayment levels from zero (mean sea level) to 5 m high; note the lowest area in the NW of the bay.
The nautical chart of Ōwhiro Bay shows that it is a relatively shallow and narrow embayment,
which is 8-9 m deep at the entrance, shoaling to 2 m deep at the head of the bay (Figure 2.6).
12Ōwhiro Bay Coastal Engineering Options
Figure 2.6. Ōwhiro Bay is a relatively shallow and narrow embayment, which is 8-9 m deep at the entrance,
shoaling to 2 m deep at the head of the bay.
2.4 Historical Imagery
Appendix A contains a suite of historical aerial imagery of Ōwhiro Bay dating back to 1938.
The rocky shore has remained very stable in this period, with the road in the same location as
it was in 1938 and the main changes being the increased housing and other buildings around
the embayment. As noted on the WCC website, in 2010, the Council identified structural
deficiencies in the 159 metre length sea wall – a circa 1930’s mortared brick structure – on
[the eastern side of] Ōwhiro Bay Parade, and initiated a programme to replace the entire length
(which is nearing completion Figure 2.7).
13Ōwhiro Bay Coastal Engineering Options
Figure 2.7. Replacement of the circa 1930’s mortared brick seawall on the eastern side of Ōwhiro Bay.
14Ōwhiro Bay Coastal Engineering Options
3 Climate Change (CC) and Sea Level Rise (SLR)
Figure 3.1 illustrates four scenarios of New Zealand-wide regional sea level rise (SLR) to the
year 2150 from the IPCC AR5 cited in MfE (2017), which is being driven by climate change
(CC)/global warming. The most extreme scenario (NZ RCP1 8.5 H+) indicates that in 100
years the sea level will rise by 1.34 m with the medium projections indicating SLR values in
100 years of 0.55, 0.67, 1.06 m for RCP2.6 m, RCP4.5 m and RCP8.5 m, respectively. The
projections include a New Zealand-wide regional offset, with a small additional SLR above the
global mean projections. For more information on RCPs refer to MfE (2017), Tables 10 and
11.
Figure 3.1. Four scenarios of New Zealand-wide regional sea level rise projections to 2150 based on Kopp et al.
(2014) cited in MfE (2017).
The four sea-level rise scenarios are based around three RCPs (RCP2.6, RCP4.5 and
RCP8.5). Three of the scenarios are derived from the median projections of global sea-level
rise for the RCPs presented by the IPCC in its Fifth Assessment Report (AR5) (Church et al,
2013). These have been extended to 2120, to meet the minimum requirement of assessing
1RCP refers to representative concentration pathways, which are scenarios based on how human CO2
emissions will change in the future, with RCP 8.5 being ‘business as usual’ and continued increasing
consumption.
15Ōwhiro Bay Coastal Engineering Options
risk over at least 100 years, as required by the NZCPS 2010. A further extension to 2150,
using the rates of rise from Kopp et al. (2014), provides a longer view over 130 years (with a
gap shown in Figure 3.1 between the two sets of projections). It is also a reminder that sea
level will keep rising after 100 years, irrespective of actual future greenhouse gas emissions
(MfE, 2017).
While there is still uncertainty around projected SLR rates, we can get some indication on how
it will impact on extreme events. For example, based on RCP 8.5, in 30 years’ time extreme
water levels with a present day 1 in 200 year return period could have a 1 in 2.5 year return
period. This is demonstrated in Figure 3.2, where the sea level is projected to rise 0.3 m in
the next 30 years. At present, a 1 in 200 year return period event results in an extreme water
level 0.3 m higher than the usual mean level of the sea (Figure 3.2). With an addition of 0.3 m
water level, the same extreme water level that occurs once every 200 years on average will
occur every 2.5 years on average (Figure 3.2). Therefore, over-topping events at Ōwhiro Bay
are expected to occur more frequently and be more extreme with SLR.
Figure 3.2. Based on RCP 8.5, in 30 years’ time, extreme water levels with a now day 1 in 200 year return period
could have a 1 in 2.5 year return period. The sea level is projected to rise 0.3 m in the next 30 years (blue
arrow). At present, a 1 in 200 year return period event results in an extreme water level 0.3 m higher than the
usual mean level of the sea (amber arrows). With an addition of 0.3 m water level, the same extreme water level
that occurs once every 200 years on average will occur every 2.5 years on average (red arrows).
16Ōwhiro Bay Coastal Engineering Options
4 The 15th April 2020 Extreme Over-Topping Event
To provide some insight into what drove the extreme over-topping event on 15th April 2020,
the various metocean components were analysed. In addition, this event was compared to
the 1 July 2020 event, when due to the extreme event in April a wave warning system was
brought in to alert councils and civil defence and residents were warned to prepare in case
they need to evacuate their homes (“Ōwhiro Bay residents warned to be ready to evacuate”2).
However, extreme over-topping did not occur on 1 July.
4.1 Over-Topping in Extreme Events
Over-topping at Ōwhiro Bay occurs during extreme events when a series of factors occur
coincidentally. That is, a combination of:
High tide (spring or King tides will exacerbate the event);
Storm surge due to low atmospheric pressure (1 cm of increased water level for
every millibar below average pressure);
Onshore winds causing wind set-up;
Wave set-up, with longer period waves increasing the amount of set-up, and;
Large waves.
When these factors all occur at the same time, the potential for over-topping is increased
(Figure 4.1).
Figure 4.1. The metocean components that lead to wave over-topping in extreme events.
2 https://www.rnz.co.nz/news/national/420286/owhiro-bay-residents-warned-to-be-ready-to-evacuate.
17Ōwhiro Bay Coastal Engineering Options
4.2 Components of the 15 April 2020 event
Large waves washed over the road at Ōwhiro Bay on 15/04/2020 leading to one
hospitalisation, several evacuations and damage to property. The offshore wave conditions
during this event can be seen in Figure 4.2 below. The peak was 6.71 m at 14.7 seconds at
11:00 at the hindcast offshore extraction site (Figure 2.3), which results in the peak of the
event reaching Ōwhiro Bay at approximately noon.
Figure 4.2. Significant wave height (top) and peak wave period (bottom) at the extraction location for the April 15,
2020 event at Ōwhiro Bay. The date marks are in UTC, which means they are at noon NZST, meaning that the
peak of the event coincided with the noon high tide, allowing for approximately 1 hour for 14.7 second period
waves to propagate from the extraction location (these waves were moving at ~20 m/s over a distance of ~ 70 km
– Figure 2.3).
Barometric pressure was approximately 8 millibars below average, resulting in some 8 cm of
increased water level above the predicted tide level (Figure 4.3). High tide of 1.8 m also
occurred at noon; i.e. the same time as the peak of the event occurred in Ōwhiro Bay. An
onshore southerly wind of 25-30 kmph was blowing at noon on 15th April.
Figure 4.3. Barometric pressure data from Wellington airport.
18Ōwhiro Bay Coastal Engineering Options
Although the swell on 15th July 2020 peaked at only 0.2 m above the annual return period
wave height (Table 2.1), it had a long period of 14.7 seconds, which is not usual for the south
coast of Wellington3, and as noted above, the longer the period, the higher the water level due
to wave set-up. The onshore winds, lower than average barometric pressure, and a spring
tide all coincided with the peak of the 6.7 m swell arriving at the bay at noon. This resulted in
the ‘perfect storm’ for an extreme over-topping event.
4.3 April versus July Extreme Events
As noted above, a large south swell was forecast to arrive on 1 July 2020 by the wave warning
system, just a couple of months after the extreme event of 15 April 2020. It is unknown if any
over-topping occurred due to the second event, partly since it occurred in the middle of the
night, however, it is known that the extreme over-topping and damage associated with the
April event did not occur. The various metocean components for the 2 events are presented
in Table 4.1.
Table 4.1. Comparison of metocean components during the extreme over-topping event on 15 April 2020 and
the warning date of 1 July 2020.
15-Apr-20 1-Jul-20
Hs (significant wave height) (m) 6.71 6.42
Tp (peak wave period) (seconds) 14.7 11.32
Direction (degrees true) 199.8 195.1
Peak time 1200 2400
High tide time 1200 0200
High tide level (m) 1.8 1.7
Barometric pressure 1005 1004
Wind speed (kmph) 22 18.5
Wind direction (degrees true) 190 214
Comparison of the events in Table 4.1 indicates that although the wave heights were relatively
similar (the July event was some 0.29 m smaller), the tide was of a similar height (0.1 m smaller
in July), and the swell was from a similar direction, the wave periods and timings of the event
were quite different. The wave period in April was some 3.4 seconds longer resulting in
increased wave set-up (Figure 4.1), and the peak of the event coincided with the time of the
3The mean wave height a period for the Wellington South Coast is 1.2 m at 9 seconds (Mead and
Phillips, 2016).
19Ōwhiro Bay Coastal Engineering Options
high tide, while it was 2 hours later in July. They were not ‘freak waves’4 rather a coincident
combination of parameters that resulted in an extreme over-topping event.
The important point to realise from this comparison is that it is the combination of factors that
result in the extremity of an over-topping event in Ōwhiro Bay (indeed in any location), and so
a warning system must consider all the parameters of a potential over-topping event and not
only the predicted size of the waves. A warning system in order to allow residents to prepare
for events will be an important management system going forwards, since these events will
occur more frequently due to sea level rise (SLR). Along with utilising a range of metocean
statistics to develop a reliable warning system, a remote monitoring system can also greatly
improve a warning system’s reliability by recording extreme over-topping events so that the
metocean conditions that lead to the events can be incorporated into the predictive parameters
for warnings.
4Freak or rogue waves are single unusually large, unpredictable and suddenly appearing surface
waves that can be extremely dangerous to ships, even to large ones.
20Ōwhiro Bay Coastal Engineering Options
5 Ōwhiro Bay Residents Association Coastal Survey
Due to Covid-19 and the second Auckland lock-down (mid-August 2020), the initial
stakeholder meeting was undertaken remotely as a virtual meeting to go through the issues
and the aspects of the bay that are valued by the stakeholders and provide insight to over-
topping events. This also included the development of a stakeholder questionnaire to collate
detailed information form the stakeholders with respect to values of the area, issues such as
over-topping, erosion, etc.. The survey and results are attached as Appendix B, and are
summarised here stating the general trends in the responses:
1. There were 51 respondents.
2. Does over-topping occur at your property?
34 residents responded Yes
3. How often does it occur?
Infrequently, it only happens when there is a significant weather or wave event
4. When wave topping does occur what is your most frequent experience?
Varying degrees of inundation
5. How frequently are you using the South Coast area and what do you use it for?
Daily I use it every day – wide range of uses.
6. What’s important to you?
A wide and varied ranged of responses from safety to recreation to the environmental
values.
7. What changes have you observed?
Erosion and movements of the beach
Gravel ramping
Loss of vegetation in some areas, growth in others
Damage to structures:
o Footpaths
o Bridge
o Safety barriers
o Vehicles
o Carpark
o etc., etc.
8. Acceptability of Potential Options:
Natural defences – Yes
Beach/gravel management – Yes
Groynes – Mixed views
21Ōwhiro Bay Coastal Engineering Options
Seawalls – mostly Yes, some No
Loss of coastal footpath – No5
Loss of coastal parking – Yes/Neutral
Reduce to one lane – Mixed Views
Homeowner self-protection – Mixed Views
Offshore breakwater(s) – Yes
Do nothing – No (unanimous)
While it is clear that at some point in the future retreat is inevitable due to SLR, a general
sentiment is:
“I am willing to have some fairly major changes in order for us to safely live here in the decades
to come.”
5Note, during the final stakeholder meeting it was conveyed that as long as there was a footpath on
one side of the road, then loss of some footpath to make space for structural responses would be
acceptable.
22Ōwhiro Bay Coastal Engineering Options
6 Options Assessment
A range of options were developed based on the results of the investigations described above,
that is, options that are viable for the location. The options evaluation was presented to the
Ōwhiro Bay Residents Association on 21 February 2020 at Ōwhiro Bay School. The following
options were considered and discussed:
1. Do Nothing.
2. Beach Management: Reduce the Berm Height.
3. Dune Planting Stabilisation
4. Protect with Seawalls.
5. Create Buffers.
6. Advance/Buy Time – Offshore Structures.
7. Hybrid Solution – Structures and Management and Forecasting.
8. Retreat – When?
6.1 Monitoring
In order to better understand the combination of metocean parameters that lead to extreme
over-topping events at Ōwhiro Bay, as well as to ascertain the efficacy of any implemented
interventions and adaptively manage the responses, a critical component of the strategy is
monitoring. Monitoring comes in many forms, with more sophisticated and cost-effective
methodologies being developed in recent years. Given the kind of information that requires
monitoring at Ōwhiro Bay (i.e., over-topping events, movement of shingle around the beach,
efficacy of options to mitigate the over-topping, etc), remote video monitoring is likely the most
efficient and cost-effective methodology.
Figure 6.1 shows a remote monitoring camera set-up that is being used to monitor the surf
breaks at Lyall Bay; eCoast has a network of cameras for this purpose (Atkin et al., 2017), and
a similar unit is being used to monitor over-topping of the breakwater at Manu Bay boatramp,
which is a health and safety issue (Mead, 2020). In these cases, the systems are connected
to a domestic power supply, although solar powered units can be used where the electricity
grid is not available.
The monitoring records can be set-up to capture at any frequency, interval and the house
micro-processor can undertake a variety of statistical analyses before saving the data to the
Cloud for security. To consider over-topping at Ōwhiro Bay, a set-up that records a 20 minute
block of images every 1 hour (1,200 images at 1 Hz) during daylight hours, with continuous
23Ōwhiro Bay Coastal Engineering Options
20 min blocks for an hour either side of high tide is a potential monitoring set-up. Each cube
is time-stacked and mean, minimum and maximum events are determined (via colour
recognition) and are sent to the Cloud with images. These data can then be post-processed
in a number of ways to consider the locations and extent of over-topping, the level of beach
material around the bay, etc., including rectification of the images to provide a ‘bird’s-eye’ view
of the bay (Figure 6.3). Appendix C provides a detailed description of the camera system.
Figure 6.1. A remote monitoring camera installation at Lyall Bay (Atkin et al., 2017).
Figure 6.2. Over-topping example images at Manu Bay breakwater, Raglan, taken from the 11th April 2019 at
high tide during inclement conditions (multi-direction incident swells, northerly winds, low pressure) (Mead, 2020).
24Ōwhiro Bay Coastal Engineering Options
Figure 6.3. Rectification of the Whaingaroa Bar to determine breaker locations and sand bars (Harrison and
Bryan, 2014)
Ōwhiro Bay, and indeed much of the southern Wellington coast, is well suited to remote video
monitoring due to the elevated topography (e.g. Figure 2.5). There are several potential
powered sites on the eastern side of the bay, as well as the option for a remote system on the
top hill country on the western side of the bay (Figure 6.4).
25Ōwhiro Bay Coastal Engineering Options
Figure 6.4. (Top) Ōwhiro Bay is well suited to remote video monitoring due to the elevated topography. (Middle)
There are several potential powered sites on the eastern side of the bay, (Bottom) as well as the option for a
remote system on the top hill country on the western side of the bay.
26Ōwhiro Bay Coastal Engineering Options
6.2 Do Nothing
‘Do nothing’ is a traditional option, although given the investigations presented here, and the
resounding ‘No’ to this option from the Ōwhiro Bay Residents Association, this option is not
being considered. The outcomes of doing nothing can be related to Section 3 above, that is,
over-topping events at Ōwhiro Bay are expected to occur more frequently and be more
extreme with SLR.
6.3 Beach Management: Reduction of the Berm Height.
It is understood that the berm height against the seawalls within Ōwhiro Bay was traditionally
reduced/removed with a digger by the quarry in order to prevent/reduce over-topping. The
specifics of these works are not well-known; e.g. how often (yearly has been put forward), to
what depth, in what areas, where was the material removed to, etc? In the absence of verified
specifics, and while there are some obvious areas where berm reduction is required (e.g. the
north western corner of the bay), monitored trials will provide information on the efficacy of
this approach, and guidance on how to modify as required (i.e. adaptive management).
In order to provide some indication that this approach would be of value to reduce over-topping
in Ōwhiro Bay, wave run-up and over-topping were considered using the LiDAR data (Figure
2.5) and photographs to approximate the beach slopes. Predictions of mean wave over-
topping discharge were undertaken for i) no berm reduction, ii) 1 m of berm reduction, and iii)
2 m of berm reduction using the Overtopping Neural Network calculator developed by Deltares
Hydraulics. This prediction tool is underpinned by a dataset of physical model tests and does
carry some small inaccuracies due to scale effects, model effects and measurement errors.
However, it is considered a robust tool and gives a good estimate of over-topping discharge.
Details of the methodology followed, and the development process of this calculator, are
described in van Gent et al. (2007) and the EuroTop (2007) manual.
Simulations were undertaken from 40 to 70 Ōwhiro Bay Parade where there is no reef platform
and from 80 to 92 Ōwhiro Bay Parade where there is a reef platform present, for present day
and with 0.5 m of SLR. As can be seen from Figure 6.5, significant reductions in over-topping
discharge can be gained by reducing the height of the berm against the seawall, which strongly
supports the historical observations.
It is known that the south coast of Wellington is accreting (Carter and Lewis, 1995), and so
removal of beach shingle may also become a component of this management option,
especially if monitoring demonstrates that the material removed from in front of the seawalls
cannot be moved to other parts of the beach without compromising the strategy. However, it
27Ōwhiro Bay Coastal Engineering Options
is also known that if the water depth is increased (e.g. by removal of material and/or due to
SLR), then higher waves can approach the beach increasing over-topping discharge, and so
pushing material down the beach may prove to be a better option.
Figure 6.5. Results from the Overtopping Neural Network calculator simulations from (Top) 40 to 70 Ōwhiro Bay
Parade where there is no reef platform and from (Bottom) 80 to 92 Ōwhiro Bay Parade where there is a reef
platform present, for present day and with 0.5 m of SLR.
Beach push-ups are used around New Zealand to provide increased coastal protection against
erosion. Reduction of the berm height at Ōwhiro Bay is very similar to beach push-ups, moving
beach material up/down the beach slope. Even so, resource consent will be required to get
permission to undertake this kind of beach management.
6.4 Dune Planting Stabilisation
Widening the beach to create a buffer zone to reduce over-topping through dune stabilisation
with native dune species has proven successful along other parts of the southern coast of
28Ōwhiro Bay Coastal Engineering Options
Wellington. For example, dune planting has significantly increased the width of the dune buffer
zone at Lyall Bay (Mead and Phillips, 2016), and provided increased resilience to erosion6
(Figure 6.6). Similar creation of a buffer zone has also been achieved at Island Bay, however,
the mobile shingle beach material at Ōwhiro Bay is not conducive the propagation of native
dune species (Figure 6.7). In addition, this method to reduce over-topping could not be applied
in combination with berm height reduction, it would be either one or the other.
Figure 6.6. Dune planting has significantly increased the width of the dune buffer zone at Lyall Bay (Mead and
Phillips, 2016).
Figure 6.7. Left) Dune stabilization at Island Bay, and Right) the gravel beach at Ōwhiro Bay.
6Regular maintenance is still required at the Surfer’s Corner end of Lyall Bay due to the abrupt interface
of the airport reclamation built in the 1950’s, which reclaimed almost 1/3rd of the bay.
29Ōwhiro Bay Coastal Engineering Options
6.5 Protect with Seawalls and Revetments
Seawalls and revetments are also common around the south coast of Wellington (Figure 6.8),
and have been present in Ōwhiro Bay since at least the 1930’s (Figure 2.7). Re-curved
seawalls (top left Figure 6.8) are designed specifically to redirect over-topping discharge back
towards the sea, and seawalls and rock revetments can both reduce wave run-up and over-
topping discharge.
Figure 6.8. Top Left) The re-curved wall at Island Bay. Both Left and Right) The seawall and revetment along
the Esplanade near the Victoria University Coastal Ecology Laboratory.
There is potential for further revetments/seawalls and/or heightening revetments/seawalls to
mitigate over-topping in Ōwhiro Bay, although there are some factors that indicate that these
structures may not be the best solution. It is noted that the results of the community
questionnaire indicated that there was some opposition to seawalls, presumably due to loss
of visual amenity (not being able to see the sea/beach) and having a concrete structure
between the footpath and the beach having a negative impact both the aesthetics and beach
access.
An additional issue is the ramping effect of the shingle berm, which is currently to the level of
the footpath where the worst of the over-topping occurs on the eastern side of the bay (Figure
30Ōwhiro Bay Coastal Engineering Options
6.9). This indicates that should the seawalls be heightened in these areas, there is the
potential for the shingle slope to accumulate to the top of the new seawall, and only a relatively
small reduction in over-topping discharge will be gained due to waves still propagating up the
ramp. This could be addressed by maintaining a reduced berm against the seawall (i.e.,
Section 6.3), which has the potential to provide a successful mitigation method without the
addition of a seawall. The same effect could also occur with the establishment of revetments,
however, the placement of revetments would also negate the option to maintain a reduced
berm height because of the potential to undermine the revetment toe and cause failure.
Figure 6.9. The shingle beach is presently almost level with the footpath on the eastern side of the bay where
some of the worst over-topping occurred in April 2020.
At this stage, seawalls/revetments are not considered a useful option for reducing over-topping
at Ōwhiro Bay, although they may be in the long term. An area of the bay that is an exception
to this is the at the carpark in the centre of the beach, which is relatively set back from the high
tide mark, has a wide area between the road and the high tide, is of relatively high elevation
(>4 m above mean sea level Figure 2.5), and already has some rock revetment protection
(bottom left image Figure 2.2). Rocks along the seaward edge of the carpark were found to
be 700-800 mm diameter during the site visit. To determine the design size/weight of armour
units at the site, depth-limited wave heights at the beach were considered (Figure 2.6), as well
as the wave heights at the beach captured on a video of the 15 April 2020 event (Figure 6.10),
while the LiDAR data and photographs were used to estimate the beach slope.
The size/weight of armour units for revetments are calculated to ensure that they are stable
under design conditions (i.e. 100-year return period wave heights during an extreme water
level event), with an acceptable failure ofŌwhiro Bay Coastal Engineering Options
Engineers’ (2006) method for determining stable stone size for particular wave heights relies
on the Hudson formula which is expressed as:
W = rH3 / KD (r/w – 1)3cot
where,
W = weight of the outer layer armour unit
r = unit weight of armour
unit H = design wave height
KD = stability coefficient from armour size, shape and material
w = unit weight of water
= angle of structure slope
Where KD is a stability coefficient taking into account all the other variables. KD values in the
literature are for “no damage” conditions defined so that up to 5% of the armour rock may be
displaced. H in the equation being taken as H1/10 i.e., the highest 1/10th of all waves. Here
“breaking” means wave breaking directly onto the armour rocks. KD levels of 2 are
recommended for angular rock armour under breaking waves, and 3-4 where waves are
surging (e.g. in a marina).
For this site, basalt rock and a KD value of 2 was applied to the Hudson formula. This resulted
in a recommended rock size with a nominal diameter (D50) of 0.9 m; a mix of rocks ranging
from 0.7 to 1.1 m are considered suitable for the site.
Figure 6.10. Waves at the beach during the 15 April 2020 extreme event.
32Ōwhiro Bay Coastal Engineering Options
The existing rock in front of the carpark falls within the calculated rock size/weight for the site,
although these calculations are considered preliminary and a more accurate assessment
should be undertaken to better determine the beach slope, potential wave height at the beach
and the type of rock to be used (the density of the rock determines the size/weight required),
and to develop drawings and specifications. To reduce wave run-up onto the road and
threatening properties during extreme events, approximately 120 m of rock revetment can be
placed along the top of the beach, which includes strengthening some 40 m of rocks already
present on the western side of the beach (Figure 6.11). Access through the revetment would
be in the form of angled gaps, much the same as angled beach access points to reduce the
loss of sand.
Figure 6.11. Potential rock revetment for Ōwhiro Bay to reduce wave run-up onto the road and threatening
properties during extreme events.
6.6 Creation of Buffers
As noted in Section 6.4 above, even if the mobile shingle beach were to be conducive to the
establishment of a native planted dune buffer zone, it could not be done in conjunction with
reduction of the berm against the seawalls. However, creation of buffer zones using coastal
33Ōwhiro Bay Coastal Engineering Options
plants (e.g. harakeke, taupata, mingimingi, etc.) planted between the existing seawalls and
setback into the foreshore can feasibly increase resilience to over-topping discharge and work
in combination with berm grading. Similar buffer zones are present along The Esplanade at
Oriental Bay (Figure 6.12), although a lower wall/planting above a graded berm could be
applied at Ōwhiro Bay to reduce any impact on views across the bay (Figure 6.13).
Figure 6.12. A buffer zone of coastal plants along The Esplanade. At Ōwhiro Bay it is envisaged that there
would be a lower wall/planting above a graded berm as to reduce any impact on views across the bay.
34Ōwhiro Bay Coastal Engineering Options
Figure 6.13. Potential planted buffer zone above graded berm to reduce/prevent extreme over-topping.
As noted above, Ōwhiro Bay is constrained by seawalls, roads and footpaths, and so there is
a need to create space to create buffer zones (e.g. the footpath has been replaced by coastal
plants in Figure 6.13).
6.7 Managed Advance/Buy Time – Offshore Structures
A potential solution to reduce wave run-up, set-up and over-topping in Ōwhiro Bay is the
construction of offshore submerged breakwaters (e.g. Figure 6.14). As noted in Section 4,
wave set-up is one of the components that leads to extreme over-topping, which increases
with increasing wave period. An aspect of offshore submerged breakwaters is that because
the waves are breaking on the offshore structure (natural or manmade), there is set-up at the
breakpoint, and set-down at the beach in the lee of the structure (e.g. Black and Mead, 2003;
Ranasinghe et al., 2006). Utilising both the breaking of waves offshore to decrease the wave
height in the bay, as well as wave set-down at the beach has the potential to lead to decreased
water level and wave height in the bay; i.e. could buy some time by turning back SLR by
several decades.
35Ōwhiro Bay Coastal Engineering Options
Figure 6.14. The submerged reef at Oriental Bay is designed to maintain beach sand along the eastern part of
the beach through wave rotation (Mead and Black, 2001). (https://satellites.pro/New_Zealand_map#-
41.290467,174.795637,19).
At present, it is unknown how effective this approach would be. For example, waves were
breaking before entering Ōwhiro Bay on 15 April 2020 (Figure 6.15). As can be seen in Figure
2.6, the entrance to Ōwhiro Bay is relatively shallow, and so with the application of the rule of
thumb depth to wave height at breaking ratio of 0.78, a 6.7 m wave (i.e., the peak significant
wave height) will break in 8.6 m of water, with the largest waves of the 15 April event likely
breaking in water depths of ~15 m. Therefore the location of submerged structures within the
surf zone needs to be considered (both due to the volume/cost and because the waves will
have already broken).
Figure 6.15. Waves breaking before entering Ōwhiro Bay on 15 April 2020. As can be seen in Figure 2.6, the
entrance to Ōwhiro Bay is relatively shallow, and so with the application of the rule of thumb depth to wave height
at breaking ratio of 0.78, a 6.7 m wave (i.e., the peak significant wave height) will break in 8.6 m of water, with the
largest waves of the 15 April event likely breaking in water depths of ~15 m.
36Ōwhiro Bay Coastal Engineering Options
To determine whether structural intervention to reduce wave height in the bay and create wave
set-down at the beach is feasible, in depth investigations are required (e.g. field data collection
and numerical modelling). In addition, marine construction within the Marine Reserve would
need to be considered.
Similar to lowering water levels within th bay during extreme events, increasing the level of
the land/road around the perimeter of the bay is an option which is being seriously looked at
in some Pacific Island nations. This is a long term solution that would at present be a very
unlikely option – unlike some Pacific Island nations that have nowhere to retreat to, New
Zealand has an abundance of high ground.
6.8 Hybrid Solutions –Management and Forecasting and Structures
Hybrid solutions are a form of nature based solutions that combine structural engineering with
natural features (e.g. marsh–levee systems; dune–seawall systems; mangrove-revetment
systems) (Pontee et al., 2016). At Ōwhiro Bay, hybrid solutions that incorporate the following
aspects have the potential to reduce and/or prevent over-topping during extreme events, as
well as to be prepared in advance of them:
1. Monitor
2. Reduction of Berm
3. Revetments
4. Buffer Zones/Coastal Vegetation
5. Knowing What’s Coming – Preparedness by informing the forecasting system with the
knowledge gained by monitoring.
6.9 Retreat
SLR will continue beyond 2100, the height/extent of which is unknown, and similar to the rate
at which SLR will occur, this is partly due to how humans react with respect to reducing CO2
emissions, with several larger scale uncertainties such as land-based ice. This means that
retreat from Ōwhiro Bay will be required in the future, although through continued monitoring
and adaptive management of measures to combat over-topping, it is expected that the aim to
safely live in the bay in the decades to come can be achieved.
37Ōwhiro Bay Coastal Engineering Options
7 Recommendations
The following recommendations are directed at short (now), medium (in the next decade), and
future (50 years and beyond) options to reduce/prevent over-topping during extreme wave
events in Ōwhiro Bay.
7.1 Short Term Management
In the short term, the application of ‘no regrets’ options is recommended, that is, options that
are relatively low cost and do not require large scale construction and/or permanent changes
to Ōwhiro Bay.
7.1.1 Monitoring System
A monitoring system should be put in as soon as possible in order to develop an understanding
of the dynamics of the beach system, over-topping events and any management options that
are applied.
Monitoring comes in many forms, with more sophisticated and cost-effective methodologies
being developed in recent years. Given the kind of information that requires monitoring at
Ōwhiro Bay (i.e., over-topping events, movement of shingle around the beach, efficacy of
options to mitigate the over-topping, etc), remote video monitoring is likely the most efficient
and cost-effective methodology.
Ōwhiro Bay is well suited to remote video monitoring due to the elevated topography, and
there are several potential powered sites on the eastern side of the bay, as well as the option
for a remote system on the top hill country on the western side of the bay. The type of system
and its operating capacity is provided in Appendix C.
7.1.2 Beach Grading
Mechanically removing the shingle ramp from in front of the seawalls where over-topping
occurs and redistributing the material lower down the beach has the potential to reduce the
impacts of over-topping at Owhiro Bay, and could become an important component of the
beach management options – anecdotal evidence indicates that it was successful in the past.
The monitoring system will be an important aspect of this option in order to determine its
efficacy, how the beach responds to grading (i.e. movement of shingle around the beach,
conditions that lead to the return of the shingle ramp, locations of over-topping, etc.).
38Ōwhiro Bay Coastal Engineering Options
As noted in Section 6.3, beach push-ups are used around New Zealand to provide increased
coastal protection against erosion. Reduction of the berm height at Ōwhiro Bay is very similar
to beach push-ups, moving beach material up/down the beach slope. Even so, resource
consent will be required to get permission to undertake this kind of beach management, which
will require an assessment of environmental effects, including investigations into the designs
of the existing seawalls (i.e. depth and stability of the toe of the structures) and how these
works impact on the marine reserve.
7.1.3 Improvement of Forecast/Warning System
In order to provide confident forecasts to allow Ōwhiro Bay residents to prepare for extreme
over-topping events, a better understanding of the combination of metocean parameters that
lead to extreme over-topping events is required. A critical component of developing a robust
warning strategy is monitoring to determine the extent, locations, and other factors associated
with over-topping events, which can then be related back to the metocean parameters; e.g.,
as done in Section 4 to consider the 15th April 2020 extreme event. These parameters can be
catalogued so that when the forecast system identifies the combination of a set of parameters
that have historically led to an over-topping event, an appropriate warning can be issued. As
the database of known over-topping events increases, so will the efficacy of the warning
system.
7.2 Medium Term Management
Medium term management options over the coming decade can be considered for
implementation based on the success (or not) of the short term options above, which is also
linked to monitoring. For example, beach grading may effectively significantly reduce or
prevent over-topping and mean that buffer zones are not required. Another scenario may be
that the beach grading is successful for the areas in front of the seawalls, however, run-up
and over-topping still occurs along the carpark area meaning the revetment requires upgrading
and extending. Medium term options can be integrated with short term options to develop
hybrid solutions (Section 6.8).
7.2.1 Revetment Construction
As noted in Section 6.5, at this stage, seawalls/revetments are not considered a useful option
for reducing over-topping at Ōwhiro Bay (although they may be in the long term), with the
exception of the carpark in the centre of the beach, which is relatively set back from the high
39You can also read