OPPORTUNITIES FOR REDUCING GREENHOUSE GAS EMISSIONS THROUGH EMERGING NATURAL GAS DIRECT-USE TECHNOLOGIES
←
→
Page content transcription
If your browser does not render page correctly, please read the page content below

Opportunities for Reducing Greenhouse Gas Emissions
Through Emerging Natural Gas Direct-Use Technologies

                                                                December
                                                                2019

OPPORTUNITIES FOR REDUCING
GREENHOUSE GAS EMISSIONS
THROUGH EMERGING NATURAL GAS
DIRECT-USE TECHNOLOGIES

                                An American Gas Foundation Study Prepared by:

                                                       0
Opportunities for Reducing Greenhouse Gas Emissions
Through Emerging Natural Gas Direct-Use Technologies

Legal Notice
This report was prepared for the American Gas Foundation, with the assistance of its contractors, to be
a source of independent analysis. Neither the American Gas Foundation, its contractors, nor any
person acting on their behalf:
    • Makes any warranty or representation, express or implied with respect to the accuracy,
        completeness, or usefulness of the information contained in this report, or that the use of any
        information, apparatus, method, or process disclosed in this report may not infringe privately-
        owned rights,
    • Assumes any liability, with respect to the use of, damages resulting from the use of, any
        information, method, or process disclosed in this report,
    • Recommends or endorses any of the conclusions, methods or processes analyzed herein.
References to work practices, products or vendors do not imply an opinion or endorsement of the
American Gas Foundation or its contractors. Use of this publication is voluntary and should be taken
after an independent review of the applicable facts and circumstances.
Copyright © American Gas Foundation, 2019.

American Gas Foundation (AGF)
Founded in 1989, the American Gas Foundation (AGF) is a 501(c)(3) organization focused on being an
independent source of information research and programs on energy and environmental issues that
affect public policy, with a particular emphasis on natural gas. When it comes to issues that impact
public policy on energy, the AGF is committed to making sure the right questions are being asked and
answered. With oversight from its board of trustees, the foundation funds independent, critical
research that can be used by policy experts, government officials, the media and others to help
formulate fact-based energy policies that will serve this country well in the future.

Enovation Partners
Founded in 2013 by energy practice leaders from top management consulting firms. Enovation
Partners was created to bring innovative thinking and analytics to an increasingly complex energy and
infrastructure sector, and to deliver exceptional results. In August 2019, Enovation's consulting team
joined Roland Berger, a leading global strategy consultancy, and now serves an expanded base of
clients in the US and internationally to help accelerate the energy transition.

                                                       1
Opportunities for Reducing Greenhouse Gas Emissions
Through Emerging Natural Gas Direct-Use Technologies

Table of Contents
Legal Notice ............................................................................................................................................................... 1
American Gas Foundation (AGF) ............................................................................................................................... 1
Enovation Partners .................................................................................................................................................... 1
List of Figures ............................................................................................................................................................ 4
List of Tables ............................................................................................................................................................. 6
Abbreviations ............................................................................................................................................................ 7
Executive Summary ................................................................................................................................................... 8
     A. Key Take-Aways ............................................................................................................................................... 8
     B. Role of Natural Gas in Meeting Residential Energy Needs .............................................................................. 9
     C. Innovation in Natural Gas Direct-Use Technologies....................................................................................... 11
     D. Study objectives: Assessing Opportunities for Achieving Meaningful and Cost-Effective Emissions
     Reductions through Emerging Natural Gas Technologies ................................................................................... 11
     E. Analytical approach ........................................................................................................................................ 12
     G. Study conclusions: Less costly, quicker, deeper emission reductions .......................................................... 13
     F. Key Findings .................................................................................................................................................... 13
1.        Introduction and Background ......................................................................................................................... 15
2.        Results ............................................................................................................................................................. 16
     2.1. National Results ........................................................................................................................................... 16
     2.2. Regional Results ........................................................................................................................................... 21
     2.3. Quantifying the Impact of Incentives ........................................................................................................... 26
3.        Conclusions ..................................................................................................................................................... 28
4.        Methodology and Key Assumptions................................................................................................................ 30
     4.1.        Baseline (AEO 2019 Outlook) .................................................................................................................. 30
     4.2.        Scenarios and Selected Technologies...................................................................................................... 34
     4.3.        Incentives and Cost of Emission Reductions ........................................................................................... 35
     4.4.        Complementary Technologies................................................................................................................. 39
Appendix ................................................................................................................................................................. 40
     A.      Geographical Regions .................................................................................................................................. 40
     B.      Baseline Detail ............................................................................................................................................. 40
     C.      Consumption Drivers................................................................................................................................... 42
     D.      Commodity Pricing Forecast ....................................................................................................................... 42
     E.      Selection and Modeling of Equipment ........................................................................................................ 44
     F.      Selected Equipment Cost ............................................................................................................................ 46

                                                                                         2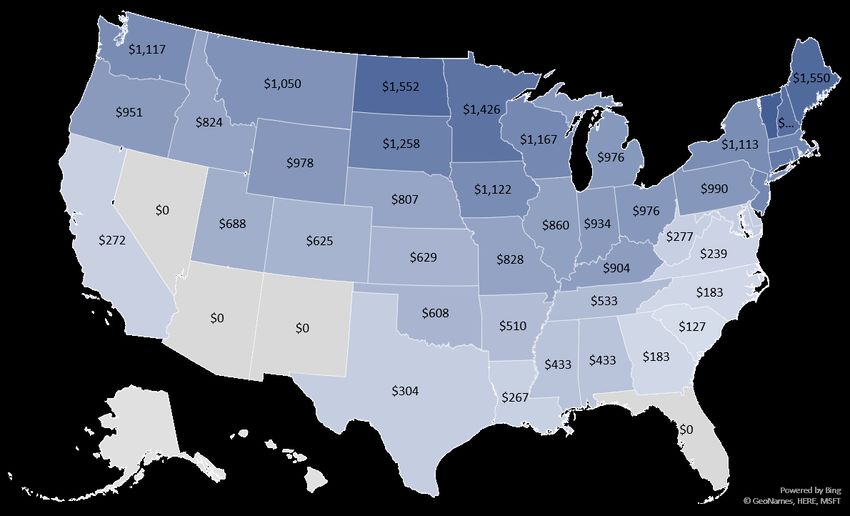
Opportunities for Reducing Greenhouse Gas Emissions
Through Emerging Natural Gas Direct-Use Technologies

   G.     Equipment Cost Decline .............................................................................................................................. 47
   H.     Model Description ....................................................................................................................................... 48
   I.     Electric Emission Intensity by Region .......................................................................................................... 52
About the Authors................................................................................................................................................... 54

                                                                                  3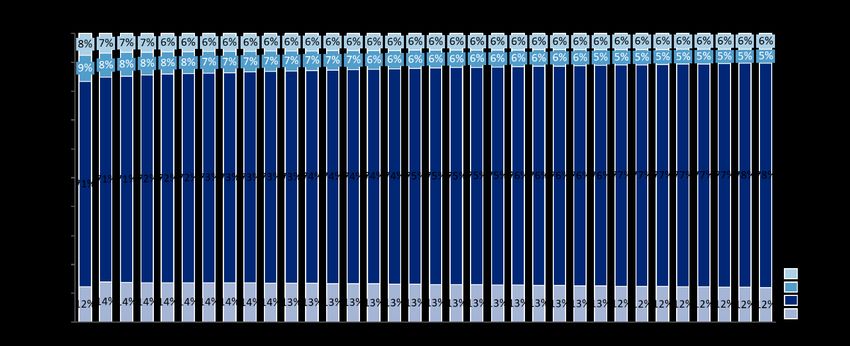
Opportunities for Reducing Greenhouse Gas Emissions
Through Emerging Natural Gas Direct-Use Technologies

List of Figures
Figure 1 Natural Gas Share of Total Residential Energy Consumption for Space and Water Heating
in 2018 ...................................................................................................................................................... 9
Figure 2 Trends in Total U.S. Residential Weather Normalized Natural Gas Consumption vs. Gas
Customer Count ...................................................................................................................................... 10
Figure 3 Natural Gas Utility Investments in Energy Efficiency Programs ................................................ 10
Figure 4 CO2 Emissions from Residential Natural Gas Use (MMT of CO2 per year) ................................. 14
Figure 5 CO2 Emissions from Residential Natural Gas Use in Space Heating (MMT of CO2 per year) ..... 18
Figure 6 Additional Penetration of Space Heating Heat Pumps at the National Level in High
Penetration Scenario (millions of units) .................................................................................................. 18
Figure 7 CO2 Emissions from Residential Natural Gas Use in Water Heating (MMT of CO2 per year) .... 19
Figure 8 Additional Penetration of Water Heating Heat Pumps at the National Level in High
Penetration Scenario (millions of units) .................................................................................................. 19
Figure 9 CO2 Emissions from Residential Natural Gas Use in Clothes Drying (MMT of CO2 per year) ... 20
Figure 10 Additional Penetration of Energy Star Dryers at the National Level in High Penetration
Scenario (millions of units) ...................................................................................................................... 20
Figure 11 Cumulative Emission Reduction 2020-2050 (MMT) in High Penetration Scenario,
Relative to 2020 Baseline ........................................................................................................................ 21
Figure 12 Regional Annual New Installments of Heat Pumps for Space Heating Under the High
Penetration Scenario............................................................................................................................... 22
Figure 13 CO2 Emission Reduction Percentage by 2050 for Space Heating by Scenarios ....................... 22
Figure 14 CO2 Emission Abatement Cost/Ton for Space Heating............................................................ 23
Figure 15 Regional New Annual Installations of Heat Pumps for Water Heating by 2050 Under
High Penetration Scenario ...................................................................................................................... 23
Figure 16 Emission Reduction Percentage by 2050 for Water Heating by Scenarios ............................. 24
Figure 17 Emission Abatement Cost/Ton for Water Heating .................................................................. 24
Figure 18 Regional New Annual Installations of Dryers by 2050 Under High Penetration Scenario....... 25
Figure 19 Emission Reduction Percentage by 2050 for Dryers by Scenarios .......................................... 25
Figure 20 Regional Customer Savings from Space Heating, Water Heating and Drying by Region in
2035 (2020$) ........................................................................................................................................... 26
Figure 21 Impact of Incentives on Emission Reductions (% reduced relative to 2020 Baseline) ............ 27
Figure 22 CO2 Annual Emission Reduction 2020-2050 (MMT/year) Relative to 2020 Baseline .............. 28
Figure 23 Cumulative Emission Reduction under High Penetration Scenario 2020-2050 (MMT)
Relative to 2020 Baseline ........................................................................................................................ 28
Figure 24 2020 and 2050 Natural Gas Use in Residential Sector (Quads of Natural Gas)....................... 30
Figure 25 Fuel Mix in Space Heating Consumption Over Time ............................................................... 31
Figure 26 Stock Average Equipment Efficiency 2020-2050 for Space Heating (EIA Baseline)................. 32
Figure 27 Snapshot of Emission Intensity in 2020 and 2050 ................................................................... 33
Figure 28 EIA 2019 AEO Reference Case Residential Sector Natural Gas Emission Forecast by End-
Uses (MMT) ............................................................................................................................................. 34
Figure 29 Example of Regional Differences in Incentives – Snapshot of Incentives in 2020 for
Space Heating in Moderate Penetration Scenario ($ per heat pump) .................................................... 36
Figure 30 Average Incentive for Space Heating Heat Pump 2020-2050 in High Penetration
scenario ................................................................................................................................................... 37
Figure 31 Defined Regions in the Model ................................................................................................. 40

                                                                                      4
Opportunities for Reducing Greenhouse Gas Emissions
Through Emerging Natural Gas Direct-Use Technologies

Figure 32 Total US CO2 Emissions by Sector in 2020 (percent of total and MMT) .................................. 41
Figure 33 Natural Gas Rate Forecast by Region ...................................................................................... 43
Figure 34 Electricity Rate Forecast by Region ......................................................................................... 44
Figure 35 Forecasted Installed Appliance Cost Decline Curve (2020 $/unit) .......................................... 47
Figure 36 Methodology at a Glance ........................................................................................................ 48
Figure 37 Baseline for Space Heating ...................................................................................................... 49
Figure 38 Equipment Usage Module ....................................................................................................... 50
Figure 39 Penetration Module ................................................................................................................ 52

                                                                              5
Opportunities for Reducing Greenhouse Gas Emissions
Through Emerging Natural Gas Direct-Use Technologies
List of Tables
Table 1 Technology Penetration Levels Achieved by 2050 in Each End-Use (percent of total units
installed)..................................................................................................................................................... 12
Table 2 Emerging High-Efficiency Natural Gas-Fired Technologies Selected for the Study ....................... 12
Table 3 Scenario Descriptions .................................................................................................................... 16
Table 4 Summary of Assumed Incentives by Scenario and End-Use ($/Unit) ............................................ 37
Table 5 List of Complementary Technologies Examined and Selected ...................................................... 39
Table 6 List of Emerging Technologies Considered .................................................................................... 45
Table 7 Select Equipment Performance and Cost Characteristics ............................................................. 46
6Opportunities for Reducing Greenhouse Gas Emissions
Through Emerging Natural Gas Direct-Use Technologies
Abbreviations
AEO Annual Energy Outlook
AGA American Gas Association
AGF American Gas Foundation
Annual Fuel Utilization Efficiency is a metric for combustion-based equipment
AFUE
(furnace)
BTU British Thermal Unit is a unit of heat
CDD Cooling Degree Days
CEF Combined Energy Factor is the energy performance metric for clothes dryers
CO2 Carbon Dioxide
CO2e Carbon Dioxide equivalent
Energy Factor is a metric used to compare energy conversion efficiency of
EF
residential appliances and equipment
EIA Energy Information Administration
EPA Environmental Protection Agency
GHG Greenhouse Gases
GTI Gas Technology Institute
HDD Heating Degree Days
IECC International Energy Conservation Code
IoT Internet of Things
kBtuh 1000 British Thermal Units per Hour
kW Kilowatt is a unit of power
kWh Kilowatt hour is a unit of energy
MicroCHP Micro combined heat and power system – CHP less than 50kWh
MMT Million metric ton
MT Metric tons
MWh Megawatt hour is a unit of energy
NREL National Renewable Energy Laboratory
O&M Operation and Maintenance
RNG Renewable Natural Gas
Uniform Energy Factor is a metric used to compare energy conversion efficiency
UEF
of residential and commercial water heaters
7Opportunities for Reducing Greenhouse Gas Emissions
Through Emerging Natural Gas Direct-Use Technologies
Executive Summary
A. Key Take-Aways
This study demonstrates how widespread adoption of emerging natural gas direct-use technologies
can contribute significantly to achieving public goals of deep reductions in greenhouse gas (GHG)
emissions in the U.S. residential sector, with much lower costs than other options under
consideration. It's low hanging fruit that should be a core element considered for any responsible
emissions reduction plan.
• U.S. residential natural gas emissions can be reduced by 24 percent through the advancement
of more efficient emerging technologies, with average net savings (negative costs) of $51 per
metric ton of CO2 equivalent ("ton" or "MT" as used in this report). With higher levels of
incentive support for emerging technologies, GHG emissions can be reduced by 40 percent, at
the modest average cost of $66 per ton.
• No technological miracles are required. The natural gas direct-use technologies modeled in this
study are either available now or are expected to roll out to market within three years.
• No policy mandates were assumed, e.g., bans of specific technologies or required levels of GHG
emission reductions. The savings can be achieved by offering cost-effective incentives and
allowing customers to make choices. Customers can consider the superior resiliency and
comfort of highly efficient natural gas equipment in their buying decisions. Incentives can be
removed once the gas technologies have achieved economic scale and equipment costs are
competitive on their own.
• Higher direct-use efficiencies on the demand side can be complemented by increased use of
carbon-neutral biogas and hydrogen (collectively "renewable gas") on the supply side, plus
continued reductions in methane emissions along the gas delivery chain, to produce very deep
cuts to residential GHG emissions from natural gas usage
• In the long-term world of deep decarbonization, direct use of natural gas and renewable gas
can serve more intense energy uses more efficiently and effectively than all-electric solutions,
which may be technically feasible but are much costlier and can require vast amounts of new
infrastructure.
• There is no "one size fits all" solution to reducing GHG emissions. This study demonstrates how
natural gas can be a core component of an integrated approach for achieving U.S. emissions
reduction goals while providing options that allow gas utilities and their customers to choose
what works best in their circumstances (resource base, types of energy demands, demographic
mix).
8Opportunities for Reducing Greenhouse Gas Emissions
Through Emerging Natural Gas Direct-Use Technologies
B. Role of Natural Gas in Meeting Residential Energy Needs
Natural gas contributes more to meeting energy needs than many people realize. Maybe that's
because furnaces, heat pumps and water heaters are out of sight and out of mind, just doing their job.
Nonetheless, 58 percent of U.S. homes have natural gas service. Natural gas currently meets 68
percent of total U.S. residential space and water heating demands. That market share varies widely by
region, as shown in Figure 1. Natural gas delivers more than 83 percent of annual heating energy to
households in the East North Central, West North Central, Mountain North, Mountain South and
Pacific regions. Replacing all that gas energy with electricity would require vast investments to
increase production and delivery capacity. Meanwhile, the gas infrastructure to meet those demands
is already in place. It can be a very valuable set of assets for delivering clean energy.
Figure 1 Natural Gas Share of Total Residential Energy Consumption for Space and Water Heating in 20181
7% 2% 1% 9%
5%
0% 10% 1%
11%
West East
Mountain
North North
1% North
Central Central 12%
12% 3%
79% 40%
90% 85%
New
Pacific
England
39%
84% 9%
5%
3%
14% 0% 18%
Middle
Mountain Atlantic
South 8%
68%
83%
1% 12% 7% 4%
6% 1% 8% 3%
24% 37%
West East
South Natural Gas
South South 52% Florida
28% Atlantic Electricity
Central Central 58%
35% Fuel Oil
69% 56%
Propane
This report focuses on space heating, water heating and clothes drying in the residential sector. Space
and water heating together account for 91 percent of residential gas consumption. Clothes drying
amounts to less than 1 percent of gas use but has some impactful emerging technology. Cooking adds
another 3 percent but has no major energy efficiency technologies for the residential market. The
remaining demand is attributable to hot tubs, fireplaces, patio warmers and a variety of smaller
volume uses. Due to their lower level of materiality, the GHG emissions reduction potential in these
smaller direct uses was not assessed.
While emerging natural gas direct-use technologies offer step function gains in efficiency, natural gas
direct-use efficiency has continued to improve in recent years. Innovations such as efficient burner
1
Sourced from EIA.
9Opportunities for Reducing Greenhouse Gas Emissions
Through Emerging Natural Gas Direct-Use Technologies
designs and heat recapture technologies have successfully penetrated the market and delivered energy
and emissions savings. Improvements in complementary technologies that reduce energy demands
(tighter building envelopes, better insulation, smarter controls etc.) have also cut into residential gas
consumption. Figure 2 shows the declining trend in natural gas consumption per household, with the
trend in total residential natural gas consumption falling slowly while gas customer count grows
robustly.
Figure 2 Trends in Total U.S. Residential Weather Normalized Natural Gas Consumption vs. Gas Customer Count
(Source: American Gas Association)
6 75
Residential Customers (Millions)
Residential Consumption (Tcf)
5
70
4
65
3
60
2
55
1
0 50
1997
1998
1999
2000
2001
2002
2003
2004
2005
2006
2007
2008
2009
2010
2011
2012
2013
2014
2015
2016
2017
2018
Residential Customers (Millions) Residential Consumption (Tcf)
Figure 3 Natural Gas Utility Investments in Energy Efficiency
Programs (Millions)2
The historical penetration of more efficient heating
and water heating technologies was accelerated by
the efforts of natural gas utilities. Their investments
in energy efficiency programs, which typically take
the form of incentive payments to customers who
buy more efficient equipment and other forms of
energy efficiency support, has grown steadily over
the years (See Figure 3). Given the ambitious GHG
emission reduction targets that have been adopted
in many states, and the relatively low cost of
achieving such reductions through more rapid
adoption of more efficient direct-use technologies,
that upward trend for natural gas utility spending on energy efficiency programs is expected to
continue.
2
Consortium for Energy Efficiency. State of the Efficiency Program Industry: Budgets, Expenditures, and Impacts 2018.
http://www.cee1.org/annual-industry-reports, posted May 2019. © Copyright 2019 Consortium for Energy Efficiency. All
rights reserved.
10Opportunities for Reducing Greenhouse Gas Emissions
Through Emerging Natural Gas Direct-Use Technologies
C. Innovation in Natural Gas Direct-Use Technologies
The pace of innovation in more efficient natural gas direct-use technologies has been accelerating in
recent years. A predecessor study to this study, conducted for the American Gas Association in 2018,
identified more than 120 different technology innovations that could significantly improve gas end use
efficiency. These technologies are in various places along the research, development and
demonstration spectrum. Some are still in the laboratory or early development. Some are in
demonstration and almost ready for market. Some are ready for market but not yet penetrated.
These emerging natural gas direct-use technologies are quite diverse, as shown in list of identified
technologies in the Appendix of the 2018 report.3 Research facilities operated by several prominent
gas industry players and universities or government agencies4 will play important roles in developing,
testing and commercializing these technologies.
The 2018 study concluded that, on a per customer basis, energy savings from deploying the most
promising natural gas emerging technologies could reduce household natural gas consumption and
GHG emissions by 20-45 percent, depending on the technology. That conclusion is broadly consistent
with the findings below from this study.
D. Study objectives: Assessing Opportunities for Achieving Meaningful and Cost-Effective
Emissions Reductions through Emerging Natural Gas Technologies
The intent of this American Gas Foundation report is to:
• provide factual information on how faster penetration of more efficient emerging natural
gas direct-use technologies could contribute to meeting emissions reduction goals; and to
• compare the volume, timing and cost of such GHG emission reductions to other potential
pathways.5
The following key questions are addressed in this study:
• How much could U.S. CO2 emissions be reduced with current and emerging residential
direct-use gas technologies by 2050?
• What is the expected unit cost of achieving these reductions?
• What savings or costs would customers see?
• What type and level of financial support would be needed to realize the full benefits of
these technologies?
3
See pages 28-30 of the 2018 report. https://www.aga.org/globalassets/research--insights/reports/ghg-reduction-
pathways_phase-1-report.pdf
4
For example, Gas Technology Institute, Research and Innovation Center for Energy (owned by Engie), Gas and Heat
Institute (Germany), Osaka Gas, Tokyo Gas, Korea Gas, University of California – Irvine, European Research Institute for Gas
& Technology Innovation, National Renewable Energy Laboratory, to name a few.
5
"Pathway" as used in this report is a combination of energy sources and technologies that over time can meet defined
goals for reducing GHG emissions.
11Opportunities for Reducing Greenhouse Gas Emissions
Through Emerging Natural Gas Direct-Use Technologies
E. Analytical approach
The study modeled two scenarios with moderate and high levels of penetration of emerging natural
gas direct-use technologies for space heating, water heating and clothes drying applications. Within
the overall residential sector, natural gas use is mainly concentrated within two end-uses: space
heating and water heating. These two end-uses are responsible for 91 percent of all residential sector
natural gas consumption. Clothes drying end-use is responsible for less than percent and was also
analyzed in both scenarios. The levels of penetration in each scenario were determined by the level of
incentives introduced to accelerate the penetration of these technologies and summarized in the Table
1 below.
Table 1 Technology Penetration Levels Achieved by 2050 in Each End-Use6 (percent of total units installed)
End-Use Moderate Penetration scenario High Penetration scenario
74% (furnace)
Space heating 75% (heat pump)
10% (heat pump)
Water heating 64% 92%
Clothes drying 22% 69%
The study results shown in the Introduction section below are attributable to the deployment of
emerging natural gas direct-use technologies that are projected to be commercially available before
2023 (listed in the figure below). These technologies were selected from a long list of considered
technologies forecasted to be commercially available before 2030. Even greater emissions reductions
could be realized through even higher efficiency technologies commercially available after 2030. A
high potential of emission reductions also exists in the commercial sector based on our review of the
emerging technologies. However, only residential emissions are considered in this study. Overall
results in both scenarios are highly sensitive to the levels of incentives provided, first costs and
technology cost reduction over time. Additional details on scenario specific assumptions are further
discussed in Section 4.2 of the report.
Table 2 Emerging High-Efficiency Natural Gas-Fired Technologies Selected for the Study7
End-Use Moderate Penetration scenario High Penetration scenario
Natural gas furnace (AFUE 97%) Gas absorption heat pump (AFUE 1.4)
Space heating
Gas absorption heat pump (AFUE 1.4)
Water heating Gas heat pump water heater (1.3 UEF) Gas heat pump water heater (1.3 UEF)
Standard Energy Star certified dryer (CEF Standard Energy Star certified dryer (CEF
Clothes drying
3.49) 3.49)
6
In addition to equipment turnover forecasted in the Baseline
7
See additional discussion on technologies considered and selected for the study in Appendix E and F
12Opportunities for Reducing Greenhouse Gas Emissions
Through Emerging Natural Gas Direct-Use Technologies
G. Study conclusions: Less costly, quicker, deeper emission reductions
Less costly. This report concludes that advancing the penetration of emerging natural gas direct-use
technologies for major end uses is a more cost-effective way to reduce GHG emissions in the
residential sector than other options currently being considered by states and cities. The pathway
including natural gas emerging technologies has a much higher volume of accessible low-cost options
for GHG emissions reduction.
Quicker. Because these emission reductions can be delivered by equipment in the market now or
within three years, and would not require expensive and very time-consuming rebuilding of electric
generation, transmission and distribution infrastructure (as would be the case for electrification
solutions), they could be achieved earlier than with other options and could, over time, avoid higher
cumulative amounts of emissions.
Deeper. A third advantage is that the GHG emissions reductions from emerging natural gas direct-use
technologies could be deeper in the near term and medium term (through 2035-2040) in regions
where substantial portions of electricity supplies will continue to come from coal or natural gas fired
generation. Emissions reductions from reduced natural gas use will all count directly toward emissions
reduction goals, while electrification solutions may actually increase GHG emissions in places where
the grid has a high carbon footprint that reflects fuel mix and large thermodynamic losses of energy in
converting fuel to electricity.
In the longer term, higher natural gas direct-use efficiencies on the demand side can be complemented
by increased use of carbon-neutral renewable natural gas and hydrogen on the supply side, plus
continued reductions in methane emissions along the gas delivery chain. This natural gas pathway
could provide meaningful and cost-effective contributions towards reducing U.S. GHG emissions.
F. Key Findings
Under the High Penetration scenario, the residential sector could reduce overall annual CO2 emissions
by 101 million metric tons/year (MMT/year) by 2050 relative to the 2020 Baseline representing a 40
percent reduction in total residential natural gas emissions. With the Moderate Penetration scenario,
60 MMT of CO2 or a 24 percent reduction in residential emissions could be reduced relative to the
2020 baseline. The reductions in residential emissions for the two scenarios relative to the Baseline
emissions in 2020 and 2050 are shown in Figure 4.
13Opportunities for Reducing Greenhouse Gas Emissions
Through Emerging Natural Gas Direct-Use Technologies
Figure 4 CO2 Emissions from Residential Natural Gas Use8 (MMT of CO2 per year)
In the High Penetration scenario, the 101 MMT of annual CO2 reductions are achieved at a net cost of
$66 per MT of CO2 reduced. Under the Moderate Penetration scenario, 60 MMT of annual CO2
reductions are achieved at a net savings of $51 per MT of CO2 reduced. Under either scenario, the CO2
reductions are significant on a national scale, and at costs per ton that are low relative to other
potential options for reducing emissions such as electrification at $572-806 per MT and atmospheric
removal of CO2 at $94-232 per MT9.
These levels of CO2 emission reductions are achieved despite the overall increase in number of
equipment units in each end-use analyzed. For example, in space heating the total number of
equipment units increases by 36 percent from 2020 to 2050, in water heating by 35 percent, and in
clothes drying by 53 percent.
From the consumer perspective, the High Penetration scenario achieves considerable savings.
Nationally, for an average consumer in 2033 that installs the high-efficiency technology for space
heating, water heating, and clothes drying could expect to save $271 each year over the lifetime of the
equipment (levelized savings in 2020$).
8
Emission reduction in High Penetration scenario includes reductions from complementary technologies (e.g. insulation,
smart thermostats) in the amount of ~4 MMT of CO2 per year
9
Cost estimates are from Implications of Policy-Driven Residential Electrification, AGA, 2018 study. While the cost estimates
are not fully "apples-to-apples" comparison as the scope boundary of the referenced study is different from this report, it
nevertheless serves as an important comparison point.
14Opportunities for Reducing Greenhouse Gas Emissions
Through Emerging Natural Gas Direct-Use Technologies
1. Introduction and Background
Greenhouse gas emissions reductions have been a central topic of modern-day environmental and
political dialogue. Since 1990, the natural gas industry and gas utilities, in particular, have made
significant contributions to reducing U.S. greenhouse gas emissions. Natural gas distribution system
methane emissions declined 73 percent between 1990 and 2017 due in large part to the
modernization of the gas distribution pipeline system.10 The natural gas utility industry spent more
than $22 billion annually to help enhance the safety of more than 2.4 million miles of natural gas
distribution and transmission systems11. It also reduced emissions from distribution pipeline by 16
percent.12
Today, there are 69 million residential natural gas households in the United States. Since 1970,
residential natural gas consumption has been essentially flat with only relatively small variations in
annual residential gas demand each year due to weather. In turn, delivered gas volumes to residential
consumers—and therefore residential gas CO2 emissions— has remained virtually unchanged for
nearly fifty years despite there being more than 32 million more residential customers than in 1970.
The dynamic of a growing number of customers using the same amount of natural gas is the direct
result of energy efficiency improvements, including tighter building envelopes, more efficient
appliances and equipment, the effectiveness of natural gas utility efficiency programs, and behavior
changes in energy consumption.
States that switched to natural gas from other high CO2-intensity fuels such as heating oil and propane
achieved greater emission intensity reduction. With these past accomplishments, this study examines
how advancing and deploying highly efficient, emerging natural gas technologies could achieve
meaningful emissions reductions over the next thirty years.
This study uses the Energy Information Administration’s (EIA) Annual Energy Outlook (AEO) 2019
Reference Case as its Baseline and focuses on demand-side innovation for natural gas in the residential
sector. Therefore, it assesses how emerging direct-use technology deployment and other
complementary technologies could reduce the overall residential demand for natural gas through
higher efficiency product offerings. The study does not contemplate other emissions reductions
opportunities in the residential sectors such as the use of renewable natural gas (RNG) or hydrogen,
fuel switching from more carbon-intensive fuels, or other approaches beyond what is already
embedded as part of the EIA Reference Case.
10
Reported by EPA
11
Spending reported by AGA 2014 playbook
12
Spending reported by AGA 2014 playbook
15Opportunities for Reducing Greenhouse Gas Emissions
Through Emerging Natural Gas Direct-Use Technologies
The boundary of the emission analysis is drawn around the burner tip. Therefore, methane emissions
associated with natural gas production and transportations are not considered. Methane emissions at
the burner tip are assumed to be minimal. In cases where the introduction of the new natural gas
direct-use technology incurs additional electricity consumption, emissions associated with this
incremental amount of electricity are included in the analysis.
2. Results
2.1. National Results
The study compared two modeled scenarios (see scenario descriptions in Table 3 below) with the 2020 Baseline
based on the EIA's AEO 2019 Reference Case. The Moderate Penetration scenario models a moderate level of
penetration of emerging, high-efficiency natural gas-fired technologies driven by moderate levels of incentives.
The High Penetration scenario models a more accelerated but still realistic level of penetration of the same
technologies supported by higher incentives that would likely pass energy efficiency program cost-effectiveness
screens. The level of penetration of emerging, high-efficiency natural gas-fired technologies is driven by rational
economic decision making on the part of the end-users (households)—not by policy mandates. Additional details
on the model are specified in Appendix H. Discussion on selection of technologies and associated incentives
assumed in the analysis is presented in Section 4.3 and Appendix F respectively.
Table 3 Scenario Descriptions
Key
Baseline Moderate Penetration scenario High Penetration scenario
assumptions
Description AEO2019 Moderate level of incentives Higher level of incentives
accelerates penetration of emerging, accelerates the penetration of
high-efficiency natural gas-fired emerging, high-efficiency natural
technologies: gas-fired technologies:
• Condensing furnace (AFUE 97%) • Space heating heat pump (AFUE
• Space heating heat pump (AFUE 1.4)
1.4) • Water heating heat pump (1.3
• Water heating heat pump (1.3 UEF)
UEF) • Energy Star gas dryer (CEF 3.49)
• Energy Star gas dryer (CEF 3.49)
Policies Only The same as baseline The same as baseline
(i.e. energy currently
efficiency implemented
standard and policies
mandates) considered
Incentives No new • Incentives vary by equipment • Incentive available for space and
incentives type, state, and year water heating heat pumps only
• Amount of incentives is • Amount of incentives is a higher
proportional to the avoided city portion of the avoided city gate
gate cost of gas cost of gas relative to Moderate
Penetration scenario
Under High Penetration scenario, by 2050, total U.S. residential natural gas emissions could be reduced by 101
MMT relative to 2020 Baseline, representing a 40 percent reduction. Under Moderate Penetration scenario,
16Opportunities for Reducing Greenhouse Gas Emissions
Through Emerging Natural Gas Direct-Use Technologies
residential natural gas emissions could be reduced by 60 MMT, representing a 24 percent reduction relative to
the 2020 Baseline. These emission reduction results for the two scenarios are shown in Figure 4 below.
Figure 4 CO2 Emissions from Residential Natural Gas Use (MMT of CO2 per year)
It is important to note that the results of High Penetration scenario include emissions reductions attributable to
complementary energy-efficiency technologies that could accompany the emerging, high-efficiency natural gas-
fired equipment. Complementary technologies include water pipeline insulation and Internet-of-Things (IoT)
devices like smart thermostats. These complementary technologies account for ~4 MMT of emissions
reductions, representing 1.7 percent of the 2020 Baseline emissions. The methods to incorporate the
complementary technologies ensure there was no double counting of any building efficiency-related measures
that are already included as part of the EIA Baseline. Additional details on complementary technologies are
summarized in Section 4.
Within the overall residential sector, natural gas use is mainly concentrated within two end-uses: space heating
and water heating. In the 2020 Baseline these two end-uses are responsible for 91% of all residential sector
natural gas consumption (space heating is responsible for 70% of consumption and water heating for 21%).
Clothes drying end-use is responsible for less than 1% and was also analyzed in both scenarios. Other minor end-
uses like cooking and cooling were not included in the scope of this study due to their relatively minor
consumption volume and emission footprint or small emission reduction potential near term (before 2030).
Emissions are reduced over the 2020-2050 timeframe in both scenario despite the absolute level of installed
equipment units increasing significantly over the same period. Number of space heating unit increases by 36
percent, water heating units increase by 35 percent, and clothes drying units increase by 53 percent.
From the consumer perspective, High Penetration scenario achieves considerable savings. For example,
nationally, an average consumer in 2035 that installs the space heating heat pump, water heating heat pump,
and Energy Star clothes dryer could expect to save $271 each year over the lifetime of the equipment (levelized
savings in 2020$). These results vary considerably by region which is further explored in the next section.
17Opportunities for Reducing Greenhouse Gas Emissions
Through Emerging Natural Gas Direct-Use Technologies
Space Heating
By 2050, using highly efficient condensing furnaces and heat pumps for space heating in Moderate Penetration
scenario and space heating heat pumps in High Penetration scenario reduces emissions by 51 and 82 MMT (28
and 46 percent reduction relative to 2020 Baseline) respectively. The emission reduction results for the two
scenarios are summarized in Figure 5 below.
Figure 5 CO2 Emissions from Residential Natural Gas Use in Space Heating (MMT of CO2 per year)
Nationally, under High Penetration scenario, natural gas heat pumps reach a 75 percent penetration by 2050.
The associated costs of up to $3,200 per heat pump (in the form of the first cost incentive) for achieving these
reductions result in a $66/ton cost of emissions reduction. The rate of penetration is shown in Figure 6 below.
Regionally the penetration levels vary significantly. These differences are discussed in the next section.
Figure 6 Additional Penetration of Space Heating Heat Pumps at the National Level in High Penetration Scenario (millions of units)
18Opportunities for Reducing Greenhouse Gas Emissions
Through Emerging Natural Gas Direct-Use Technologies
Water Heating
By 2050, using highly efficient heat pumps for water heating reduces CO2 emissions by 9 and 19 MMT (18 and 36
percent reduction relative to 2020 Baseline) in Moderate Penetration and High Penetration scenarios
respectively. The emission reduction results for the two scenarios are summarized in Figure 7 below.
Figure 7 CO2 Emissions from Residential Natural Gas Use in Water Heating (MMT of CO2 per year)
Nationally, under High Penetration scenario, heat pump water heaters achieve a 92 percent penetration by
2050, at the cost of $62/ton. The relatively low first cost differential between the Baseline water heater (see
detail discussion on equipment cost in Appendix F) and the heat pump water heater used in Moderate and High
Penetration scenarios, along with the widespread use of water heating equipment throughout the country,
allows this technology to achieve high levels of penetration and emissions reductions at a relatively low cost per
ton. The rate of penetration is shown in Figure 8 below. The differences in regional levels of penetration levels
are discussed in the next section.
Figure 8 Additional Penetration of Water Heating Heat Pumps at the National Level in High Penetration Scenario (millions of units)
19Opportunities for Reducing Greenhouse Gas Emissions
Through Emerging Natural Gas Direct-Use Technologies
Clothes Drying
By 2050, measuring relative to 2020 Baseline results in a small increase in emissions from cloths drying end-use.
This is because the number of clothes drying units increases by 53% in the EIA Baseline. The associated
emissions increase more due to number of units than reductions achieved due to the higher efficiency dryers.
Relative to 2050, high efficiency dryers can reduce emissions by 0.2 and 0.5 MMT (6 and 17 percent reduction
relative to 2050 Baseline) in Moderate Penetration and High Penetration scenarios respectively. Relative to 2020
Baseline, Moderate Penetration scenario results in a 37 percent increase and High Penetration scenario results
in a 20 percent increase in emissions due to the inherent increase in emissions between 2020 and 2050. The
emission reduction results for the two scenarios are summarized in Figure 9 below.
Figure 9 CO2 Emissions from Residential Natural Gas Use in Clothes Drying (MMT of CO2 per year)
Nationally, under High Penetration scenario, the penetration of standard Energy Star certified dryer
achieves a 69 percent penetration. The rate of penetration is shown in Figure 10 below. The
differences in regional levels of penetration levels are discussed in the next section.
Figure 10 Additional Penetration of Energy Star Dryers at the National Level in High Penetration Scenario (millions of units)
Overall, across the three end-uses, High Penetration scenario achieves a cumulative 2,286 MMT of CO2
emissions reductions by 2050 at an average reduction of 76 tons each year between 2020 and 2050
20Opportunities for Reducing Greenhouse Gas Emissions
Through Emerging Natural Gas Direct-Use Technologies
with almost half the total volume of reductions (1,143 MMT) achieved by 2040 (as show in Figure 11).
By 2050, these reductions are achieved at a cost of $66/ton (relative to 2020), which is significantly less
than other CO2 abatement options, including electrification for residential end-uses estimated at $572-
806 per MT and atmospheric removal of CO2, estimated at $94-232 per MT13.
Figure 11 Cumulative Emission Reduction 2020-2050 (MMT) in High Penetration Scenario, Relative to 2020 Baseline
2.2. Regional Results
At a regional level, significant differences in penetration levels and the cost of emissions reduction exist
between the three end-uses analyzed. These differences are discussed below.
Space Heating
In terms of penetration, regions with higher space heating requirements like New England, East North Central
and Middle Atlantic have higher levels of penetration, while regions with lower heating requirements like
Florida, West South Central, and Mountain South have lower levels of penetration. Figure 12 shows the level of
penetration as percentage of new annual installations by year and region over time under the High Penetration
scenario.
13
Cost estimates are from Implications of Policy-Driven Residential Electrification, AGA, 2018 study. While the cost
estimates are not fully "apples-to-apples" comparison as the scope boundary of the referenced study is different from this
report, it nevertheless serves as an important comparison point.
21Opportunities for Reducing Greenhouse Gas Emissions
Through Emerging Natural Gas Direct-Use Technologies
Figure 12 Regional Annual New Installments of Heat Pumps for Space Heating Under the High Penetration Scenario
Levels of emissions reductions are directly linked to the level of penetration. Consequently, regions with higher
penetration also have higher levels of emissions reductions as shown in Figure 13.
Figure 13 CO2 Emission Reduction Percentage by 2050 for Space Heating by Scenarios14
The cost of abatement is the costs of providing incentives to consumers to offset the first cost of equipment.
The amount of incentives varies widely by region due to the different levels of savings seen by consumers from
installing high-efficiency gas-fired equipment. In general, if the cost savings during the lifetime of such
equipment are high, the level of needed incentives is lower. Figure 14 below provides the regional distribution
of abatement costs. As can be observed, colder climates need the least amount of incentives due to high cost
saving achieved during the lifetime of equipment.
14
Introduction of high-efficiency gas-fired technologies in low heating requirements regions such as Florida produces only
low level of energy cost savings (or no cost saving in the first cost are considered) making the adoption of these
technologies harder even with incentives which are limited to the avoided natural gas cost. Therefore, no incentives were
introduced in Florida as the incentive cost would not be as cost beneficial for CO2 reduction in comparison to other regions.
22Opportunities for Reducing Greenhouse Gas Emissions
Through Emerging Natural Gas Direct-Use Technologies
Figure 14 CO2 Emission Abatement Cost/Ton for Space Heating8
While emissions are reduced over the 2020-2050 timeframe, the absolute level of installed equipment for space
heating grew by 36 percent over the same period. As a result, the emissions reduction per unit of equipment is
an important metric. At a national level, furnaces in the Baseline produce ~3 tons of CO2 while natural gas heat
pumps in the scenarios modeled produce 1.8 tons15 of CO2 which represents a 42 percent decline.
Water Heating
Regional levels of penetration and emission reductions are less pronounced in water heating in comparison to
space heating because the water heating requirements are less dependent on climate and more dependent on
the ground water temperatures. Nearly all regions achieve significant levels of penetration, as shown in Figure
15 below.
Figure 15 Regional New Annual Installations of Heat Pumps for Water Heating by 2050 Under High Penetration Scenario
Based on the levels of penetration, most regions achieve high rates of emissions reductions. Even regions like
Mountain South and Florida, which had lower levels of penetration for space heating, achieve robust levels of
penetration for water heating resulting in emissions reductions of over 30 percent. Regional water heating
emissions reductions are summarized in Figure 16 below.
15
Baseline emissions are estimated from EIA average space heating unit emissions, average space heating heat pump
emissions are estimated from the GTI's Energy Planning Analysis Tool (EPAT).
23Opportunities for Reducing Greenhouse Gas Emissions
Through Emerging Natural Gas Direct-Use Technologies
Figure 16 Emission Reduction Percentage by 2050 for Water Heating by Scenarios
These reductions translate to a regional cost of emissions reductions ranging between -$272/ton (savings) to
$301/ton. The following figure summarizes these regional differences.
Figure 17 Emission Abatement Cost/Ton for Water Heating
While emissions are reduced over the 2020-2050 timeframe, the absolute level of installed equipment
for space heating grew by 35 percent over the same period. On a national per unit basis, the baseline
water heater produces 0.9 tons of CO2 while the heat pump water heater produces 0.5 tons of CO2,
representing a 44 percent improvement16.
Clothes Drying
In 2020 the Baseline, most clothes dryers are electric. Therefore, share of emissions associated with
natural gas dryers is relatively small. According to the EIA 2019 AEO, the total number of natural gas
dryers grows by 53 percent from 2020 to 2050, and associated emissions increase by 45 percent in the
Baseline during this timeframe. As discussed in previous section, relative to 2050, high efficiency dryers
can reduce emissions by 0.2 and 0.5 MMT (6 and 17 percent reduction relative to 2050 Baseline) in
Moderate Penetration and High Penetration scenarios respectively. However due to large increase in
the overall number of drying units there is still an increase in natural gas clothes dryer emissions
relative to the 2020 Baseline by 37 and 20 percent in the Moderate and High Penetration scenarios.
16
Baseline emissions are estimated from EIA average water heating unit emissions, average water heating heat pump
emissions are estimated from the GTI's Energy Planning Analysis Tool (EPAT).
24Opportunities for Reducing Greenhouse Gas Emissions
Through Emerging Natural Gas Direct-Use Technologies
The differences in penetration by region are attributable to the initial distribution of gas-fired clothes
dryers. After 2035, once most regions achieve high levels of penetration, the level of incentive support
is reduced, resulting in a small decline in the number of new installations from that point onwards.
Figure 18 below shows the regional penetration of clothes dryers.
Figure 18 Regional New Annual Installations of Dryers by 2050 Under High Penetration Scenario
Based on these levels of penetration, Figure 19 summarizes the regional level of emissions reductions.
Figure 19 Emission Reduction Percentage by 2050 for Dryers by Scenarios17
On a per-unit basis, the standard efficiency clothes dryer used in the Baseline produce 0.15 tons of CO2
while the clothes dryers in the two scenarios produce 0.12 tons of CO2, a 20 percent reduction18.
Customer Impact
From a customer perspective, the level of savings varies considerably by the climate where the equipment is
used. The more severe the heating season a location experiences (and therefore the more energy is needed for
17
Negative values indicate emission increase due to the emission increase in the Baseline outpacing efficiency savings
18
Baseline emissions are estimated from EIA average natural gas dryer emissions, average Energy Star certified dryer
emissions are estimated from the GTI's Energy Planning Analysis Tool (EPAT).
25Opportunities for Reducing Greenhouse Gas Emissions
Through Emerging Natural Gas Direct-Use Technologies
heating) the more savings the customer would realize. Figure 20 shows the regional distribution of customer
savings in the sample year 2035.
Figure 20 Regional Customer Savings from Space Heating, Water Heating and Drying by Region in 2035 (2020$)
2.3. Quantifying the Impact of Incentives
Like with all energy efficiency cost-effectiveness evaluations, the role of incentives in accelerating the
penetration of emerging natural gas technologies and resulting emissions reductions is apparent.
However, since even Moderate Penetration scenario contains moderate levels of incentives, it is not
possible to completely isolate the impact of such support. In addition, there is an iterative relationship
between incentive levels and the rate at which technology costs decline due to learning curve and
scale effects. Therefore, to accurately quantify the impact of incentives, the technology cost decline
rate must also be adjusted to reflect the absence of incentives and the lower volumes of equipment
installed. Additional details on the learning curve and scale effects and impact on technology cost
decline rates is provided in Appendix G.
Based on the cumulative impact of no incentives, and associated technology cost curve decline rate
(less rapid decline compared to the scenarios with incentives), this standalone analysis estimated the
emission reductions and cost per ton of abatement. Under High Penetration scenario, a 40 percent
reduction in emissions is achieved at a cost of $66/ton. Without incentives and associated scale effects,
only a 10 percent reduction in emissions is achieved, but at a net savings of $51/ton. This is
summarized in Figure 21.
26You can also read