Towards a process-based model to predict dune erosion along the Dutch Wadden coast
←
→
Page content transcription
If your browser does not render page correctly, please read the page content below

Netherlands Journal of Geosciences — Geologie en Mijnbouw | 91 – 3 | 357 - 372 | 2012

              Towards a process-based model to predict dune erosion along
              the Dutch Wadden coast

              B.G. Ruessink1,*, M. Boers2, P.F.C. van Geer2, A.T.M. de Bakker1, A. Pieterse1,
              F. Grasso1 & R.C. de Winter1

              1 Department of Physical Geography, Institute for Marine and Atmospheric Research Utrecht, Faculty of Geosciences, Utrecht University,
                  P.O. Box 80115, NL-3508 TC Utrecht, the Netherlands.
              2 Deltares, P.O. Box 177, NL-2600 MH Delft, the Netherlands.
              * Corresponding author. Email: b.g.ruessink@uu.nl.

              Manuscript received: May 2011, accepted: December 2012

              Abstract

              An equilibrium dune-erosion model is used every six years to assess the capability of the most seaward dune row on the Dutch Wadden islands to
              withstand a storm with a 1 in 10,000 probability for a given year. The present-day model is the culmination of numerous laboratory experiments
              with an initial cross-shore profile based on the central Netherlands coast. Large parts of the dune coast of the Wadden islands have substantially
              different dune and cross-shore profile characteristics than found along this central coast, related to the presence of tidal channels, ebb-tidal deltas,
              beach-plains and strong coastal curvature. This complicated coastal setting implies that the predictions of the dune-erosion model are sometimes
              doubtful; accordingly, a shift towards a process-based dune-erosion model has been proposed. A number of research findings based on recent
              laboratory and field studies highlight only few of the many challenges that need to be faced in order to develop and test such a model. Observations
              of turbulence beneath breaking waves indicate the need to include breaking-wave effects in sand transport equations, while current knowledge of
              infragravity waves, one of the main sand transporting mechanisms during severe storm conditions, is strongly challenged by laboratory and field
              observations on gently sloping beaches that are so typical of the Wadden islands. We argue that in-situ and remote-sensing field observations,
              laboratory experiments and numerical models need to be the pillars of Earth Scientific research in the Wadden Sea area to construct a meaningful
              process-based dune-erosion tool.

              Keywords: dunes; dune erosion; storm waves; equilibrium model; beach-plain; field measurements; laboratory experiments

                Introduction                                                                          empirical equilibrium rules (e.g., Van de Graaff, 1977; Vellinga,
                                                                                                      1983, 1986), through analytical wave-impact models (e.g.,
              For many coasts wind-blown dunes form the last line of natural                          Overton et al., 1994; Larson et al., 2004) to complicated process-
              defense against high waves and water levels during storms. The                          based numerical models that aim to explicitly describe the
              assessment whether dunes are sufficiently safe to withstand a                           interaction between the water motion (turbulence, waves,
              storm with a particular frequency of occurrence is top priority                         mean flows), sand suspension and transport, and the eroding
              for coastal communities where the overtopping or breaching                              dune (e.g., Roelvink et al., 2009). The main advantage of an
              of dunes would result in serious coastal flooding and in the                            equilibrium or a wave-impact model is its simplicity: it is easy
              associated loss of life and property. Reliable methods to predict                       to apply, it requires only a few, often simplified input parameters
              the impact of a storm on a dune, for example, in terms of erosion                       and it can be set realistically in a probabilistic setting to relate
              volume, post-storm erosion profile, or recession distance, are                          dune erosion to frequency of occurrence. Its simplicity is also
              thus of utmost importance. Current methods range from simple                            its main drawback. Typically, an equilibrium or wave-impact

              Netherlands Journal of Geosciences — Geologie en Mijnbouw | 91 – 3 | 2012                                                                                     357
Downloaded from https://www.cambridge.org/core. IP address: 46.4.80.155, on 04 Jan 2022 at 07:14:35, subject to the Cambridge Core terms of use, available at https://www.cambridge.org/core/terms.
https://doi.org/10.1017/S0016774600000494
model is a local model that describes the evolution of a single,                        modes of wave attack lead to dune failure by means of various
              often idealised cross-shore profile. Yet, observations have                             types of mass movement, including avalanching, overturning,
              indicated that coastal erosion is often surprisingly variable on                        sliding and rotational slumping (e.g., Carter and Stone, 1989;
              a regional scale (e.g., McNinch, 2004; Schupp et al., 2006), related                    Nishi and Kraus, 1996). Yet, we are just beginning to see the
              to offshore variable morphology such as outcrops, channels or                           full complexity of breaking waves, turbulence, infragravity
              ebb-tidal deltas. To handle such complicated coastal settings, a                        waves, mean flows, sand suspension and transport, and the
              regional-scale process-based approach may be more appropriate                           eroding beach and dune. Consequently, process-based storm-
              (e.g., Roelvink et al., 2009; McCall et al., 2010).                                     impact models are at their infancy and not yet ready to be
                  The breaking of the incident storm waves lies at the core of                        embedded in the practical assessment of dune safety.
              the many interacting hydrodynamical and sediment transport                                  The Netherlands form a prime example where the assess-
              processes that ultimately result in dune erosion. From a fluid-                         ment of dune safety is thoroughly embedded in coastal-zone-
              mechanics point-of-view, this breaking implies a complete                               management policy. Approximately 70% of the approximately
              transformation of the organised wind-generated waves into                               350-km long Dutch coast consists of high, yet narrow dunes that
              motions at both smaller and larger scales. The small-scale                              protect vast, low-lying, densely populated areas against coastal
              motions comprise breaking-induced turbulence that is likely to                          flooding. The existing standards for coastal flood protection
              be the primary mechanism to suspend sand from the eroding                               date back to the 1970s and were motivated by the 1953 storm
              beach into the water column (e.g., Nadaoka et al., 1988). The                           surge disaster. A dune is considered to be safe when it will not
              large-scale motions include 20-200 s waves – infragravity waves –                       breach during a storm with an occurrence probability of 1 in
              that are related to the grouped structure of the incident wind                          10,000 for a given year. The Netherlands are also a prime
              waves, and mean flows, such as the cross-shore undertow. Both                           example where simple and complicated dune-erosion models
              large-scale motions are assumed to be crucial to the seaward                            must work in concert. On the one hand, the approximately
              transport of the suspended sediments (e.g., Russell, 1993; Van                          120-km long central Holland coast is a relatively uniform coast
              Thiel de Vries et al., 2008). The nature of wave attack on the                          (e.g., Short, 1992) for which an equilibrium model is nowadays
              dunes can be in the form of wave run-up, when incident                                  applied to assess dune safety (e.g., TAW, 1995; ENW, 2006). On
              breaking waves (bores) and infragravity waves hit the base of                           the other hand, the Delta area in the southwestern part of the
              the dune, or in the form of direct impact on the dune face. Both                        Netherlands and the Wadden islands in the north (Fig. 1) have

              Fig. 1. Geomorphological map of the barrier island coast in the northern part of the Netherlands (adapted from Van Alphen and Damoiseaux, 1987). The
              dots labeled TN, B12, B22 and PTs are locations of instruments referred to in the Field Studies section of this paper.

                    358                                                                      Netherlands Journal of Geosciences — Geologie en Mijnbouw | 91 – 3 | 2012
Downloaded from https://www.cambridge.org/core. IP address: 46.4.80.155, on 04 Jan 2022 at 07:14:35, subject to the Cambridge Core terms of use, available at https://www.cambridge.org/core/terms.
https://doi.org/10.1017/S0016774600000494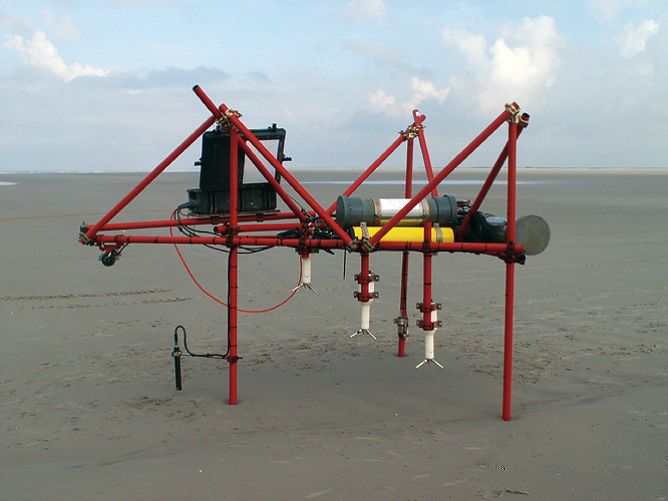
a complicated coastal setting with tidal channels and ebb-tidal
              deltas, spatially extensive beach-plains, and strongly curved
              coastlines. The aim of this paper, as part of the theme ‘Earth
              Scientific Research in the Wadden Sea Area’, is to provide insight
              into how the complicated coastal setting of the Wadden islands
              affects the applicability of the current Dutch dune-erosion
              assessment tool and to highlight a number of research findings
              that are meant to support a shift from an equilibrium to a
              process-based assessment tool.
                  This article is structured as follows. We start off with a
              non-exhaustive, historical overview of the Dutch dune-erosion
              assessment methodology, from the Provisional Guideline                                  a.
              adopted in the 1970s to the DUROS+ concept applied since
              2006. Then we provide glimpses of results of laboratory and
              field measurements that were specifically designed with some
              of the unique characteristics of the Wadden-island beaches
              in mind: their very low slope in the intertidal area (typically,
              1:80, as opposed to 1:20-1:30 along the Holland coast) and the
              up to 500-m wide supratidal beach-plain that in some places
              separates the dunes from the intertidal beach. The final section
              summarises the paper.

                Dune-erosion policy

              Provisional Guideline

              The first Dutch tool to assess the capability of dunes to withstand                     b.
              a severe storm was constructed in the early seventies based on                          Fig. 2. Schematic diagram of a. the Provisional Guideline; and b. DUROS
              dune-beach profile observations collected along the central                             (after Vellinga, 1982 and ENW, 2006, respectively).
              Dutch Holland coast in the aftermath of the 1953 storm-surge
              disaster (Van de Graaff, 1977; Vellinga, 1982). The 1953 surge                          DUROS
              caused the dune front to recede by 10 to 20 m (e.g., Ruessink
              and Jeuken, 2002), corresponding to a dune erosion quantity of                          Because the first tool was provisional, it was decided to further
              some 60 to 150 m3/m. The observations resulted in the concept                           investigate dune erosion during design conditions by means of
              that the erosion profile seaward of the new steep (typically, 1:1)                      physical (laboratory) experiments. Although a process-based
              dune front was of constant (i.e., equilibrium) form and could                           model approach was recognised to be potentially more
              be approximated by a simple relationship:                                               meaningful, it was considered to be impracticable because of a
                                                                                                      lack of fundamental knowledge on the water motion, sand
                  z = 0.415(x + 4.5)0.5 – 0.88                                              (1)       suspension and sand transport during severe breaking-wave
                                                                                                      conditions (Van de Graaff, 1977). Results of the laboratory
              where z is the depth below the maximum water level during the                           tests can be found in Van de Graaff (1977) and Vellinga (1982,
              storm surge and x is the distance from the intersection of the                          1983). The initial coastal profile in prototype, termed the
              beach profile and the maximum water level (Fig. 2a), positive                           reference profile, is provided in Fig. 3. It is highly schematised,
              in the seaward direction. This profile is applicable from the post-                     comprising a gently sloping profile (1 : 180 to 1 : 20) with a steep
              storm dune front (x = 0 m, z = 0 m) up to a water depth below the                       (1 : 3) dune with its crest level at 15 m above mean sea level
              storm-surge level that was set to 1.28 Hs br, where Hs br is the                        (MSL). The reference profile was considered to be representative
              significant breaker height. By assuming that the equilibrium                            of the Holland coast. The laboratory experiments were carried
              profile given by Eq. (1) is also present after the 1:10,000 storm-                      out as two-dimensional tests, implying that dune erosion is
              surge and by applying a cross-shore mass balance, it is possible                        assumed to be a two-dimensional problem with offshore-directed
              to reconstruct the cross-shore profile after the design storm-                          sand transport. In a series of tests in a 30 × 30 m wave basin,
              surge. From this profile, the total dune erosion and dune-crest                         Vellinga (1982) found no noteworthy alongshore variations in
              recession distance can be computed.                                                     dune erosion and concluded that two-dimensional tests were
                                                                                                      fully acceptable. In the design and analysis of the laboratory

              Netherlands Journal of Geosciences — Geologie en Mijnbouw | 91 – 3 | 2012                                                                                     359
Downloaded from https://www.cambridge.org/core. IP address: 46.4.80.155, on 04 Jan 2022 at 07:14:35, subject to the Cambridge Core terms of use, available at https://www.cambridge.org/core/terms.
https://doi.org/10.1017/S0016774600000494
immediately after dune erosion (e.g., Carter and Stone, 1989).
                                                                                                      As with the Provisional Guideline, the amount of erosion follows
                                                                                                      from a cross-shore mass balance of erosion and sedimentation.
                                                                                                      As is obvious from Fig. 2b, the erosion profile is less steep than
                                                                                                      the initial profile. The general lowering of the beach slope as a
                                                                                                      storm is progressing will cause more profound wave breaking
                                                                                                      seaward of the dune and, accordingly, lessen the rate of dune
                                                                                                      erosion with time. This is confirmed by the laboratory experi-
                                                                                                      ments (Fig. 4a, blue line).

              Fig. 3. Reference profile (black) in prototype used in the laboratory
              experiments that resulted in DUROS and DUROS+. The green line is a
              modified reference profile used in the Laboratory Experiments section of
              this paper to examine the effect of a beach-plain (here, 400 m wide and at
              2 m +MSL) on dune erosion volumes.

              tests, considerable effort was devoted to construct scaling laws
              to appropriately relate dune erosion volumes in small- and                              a.
              large-scale laboratory settings to prototype. A recent overview
              of the scaling laws for dune erosion processes can be found in
              Van Rijn et al. (2011) and is not reiterated here.
                 The laboratory tests that resulted in the scaling laws were
              based on time-invariant wave- and surge-conditions. Based on
              a large-scale test with a realistic North-Sea hydrograph with a
              peak at 5 m +MSL (Fig. 4b), Vellinga (1986) observed that the
              cumulative erosion with time-varying conditions was reached
              after approximately 5 hours (in prototype) with time-invariant,                         b.
              maximum wave and waterlevel conditions (offshore significant                            Fig. 4. a. Temporal evolution of the erosion volume above storm surge
              wave height H0s of 7.6 m and a water level of 5 m +MSL), see                            level during a small-scale laboratory test with (in blue) constant water level
              Fig. 4a. Ultimately, the small- and large-scale tests with time-                        and (in red) time-varying water level. Panel (b) shows both water level
              invariant conditions resulted in a new guideline, called DUROS,                         series. The dashed black line in (a) indicates that the erosion volume in the
              in which Eq. (1) was replaced by (Vellinga, 1983, 1986; see                             test with time-varying water levels is reached after about 5 hours with
              Fig. 2b)                                                                                constant maximum water level (after Vellinga, 1986).
                                                                                  0.5
                                                  1.28            0.56
                    7.6                    7.6              w
                         z = 0.47                                        x + 18    – 2.00 (2)            DUROS signifies that the amount of dune erosion depends
                    H 0s                   H 0s          0.0268
                                                                                                      on the hydraulic load on the dunes (significant offshore wave
                                                                                                      height and the maximum surge level) and on dune strength
              Here, w is the sediment fall velocity. ‘Offshore’ is taken as the                       (sediment characteristics and, by means of the cross-shore mass
              location with a bed elevation of 20 m below MSL. The erosion                            balance, the initial bed profile). Van de Graaff (1986) argued that
              profile stretches from the new dune foot (x = 0 m, z = 0 m) to a                        the amount of erosion will additionally depend on the storm
              transition point at a distance of                                                       surge duration and the occurrence of short-period variations in
                                          1.28             0.56                                       surge levels related to, for example, the passage of showers or
                                   H 0s          0.0268
                  x max = 250                                                               (3)       fronts. Uncertainties in all these factors will cause the estimated
                                   7.6             w
                                                                                                      amount of erosion to differ from the ‘true’ amount of erosion.
              This implies that the erosion profile ends at zmax ≈ 0.75 H0s,                          To this end, the computational method was embedded in a
              substantially less than in the Provisional Guideline. For                               probabilistic setting (Van de Graaff, 1986). This relates the
              H0s = 7.6 m, w = 0.0268 m/s (median grain size d50 = 225 μm)                            recession distance to a frequency of occurrence. Also, various
              and a water level of 5 m +MSL, the eroded sand thus remains                             ad-hoc solutions were implemented to deal with strongly curved
              within 250 m from the new dune face at elevations above the                             coasts, where clearly the assumption of two-dimensionality
              ‘normal’ low-tide line. At the seaward side, the erosion profile                        does not hold and eroded sand is likely to be lost alongshore.
              is connected to the initial profile with a slope of 1 : 12.5, while                     The DUROS methodology replaced the Provisional Guideline in
              a 1 : 1 dune front is assumed above z = 0 m (Fig. 2b). The near-                        1984. A full description of the computational method can be
              vertical front is consistent with field observations during and                         found in TAW (1995).

                    360                                                                      Netherlands Journal of Geosciences — Geologie en Mijnbouw | 91 – 3 | 2012
Downloaded from https://www.cambridge.org/core. IP address: 46.4.80.155, on 04 Jan 2022 at 07:14:35, subject to the Cambridge Core terms of use, available at https://www.cambridge.org/core/terms.
https://doi.org/10.1017/S0016774600000494
DUROS+ a dune is safe when it does not breach with an occurrence
probability of 1 in 10,000 for a given year. With DUROS+ and
The DUROS method is based on a storm peak-wave period Tp the probabilistic model it is also possible to predict for which
of 12 s and does not contain a Tp dependence. This was based occurrence probability a dune will breach. When such a predic-
on a series of laboratory tests with different offshore wave tion is coupled to a digital elevation model (e.g., in a GIS), it
steepness (0.02-0.04) but no discernable difference in erosion becomes possible to make flood risk maps (Boers et al., 2011).
volume (Vellinga, 1983, 1986). Analysis of long-term wave data Figure 5 shows such a map for the central part of Ameland; the
indicated that Tp varies along the Dutch coast and can also be recession lines in this map are constructed by alongshore
considerably larger than 12 s. Despite Vellinga’s (1983, 1986) connecting the new dune top in each cross-shore profile. In the
observations, it was feared that a larger wave period would Ameland map, parts of the dunes are predicted to breach with
increase the amount of dune erosion substantially (Steetzel, an occurrence probability between 1 : 20,000 and 1 : 40,000. The
2002). Accordingly, new two-dimensional, small-scale (Coeveld area that will then flood is indicated with the blue colour and
et al., 2005) and large-scale (Van Gent et al., 2008) laboratory can be used to inform local stakeholders about the risk of
experiments were carried out to quantify the effect of Tp on having property or infrastructure near the sea.
dune erosion and, if necessary, to modify the DUROS method.
Furthermore, extensive process measurements were conducted Further developments
during the large-scale tests (see Van Thiel de Vries et al., 2008)
to facilitate the development and testing of a process-based Despite the various modifications from the Provisional Guideline
dune-erosion model. The tests indicated that an increase in Tp into DUROS+, the actual application of DUROS+ to large parts of
from 12 to 18 s increased the dune erosion volume by some 20%, the dune coast of the Wadden islands is doubtful. The main
substantially less than initially feared (Deltares, 2007). Van Gent reason is that these parts have substantially different dune
et al. (2008) modified DUROS into DUROS+, and cross-shore profile characteristics than found along the
0.5 Holland coast, on which (by means of the reference profile,
1.28 0.45
7.6 7.6 12 w 0.56
z = 0.47 x + 18 – 2.00 (4) Fig. 3) DUROS+ and its predecessors have been based. The main
H 0s H 0s Tp 0.0268
differences are (see also Diermanse et al., 2011):
The cross-shore location where the erosion profile changes – Large parts of the heads of Wadden islands are sheltered by
into the 1 : 12.5 slope, xmax, remained as given by Eq. (3), but ebb tidal deltas (Fig. 1) that are located between the –20 m
zmax now is MSL location and the nearshore. The deltas will dissipate
0.45 0.5 part of the energy of the incident storm waves. In such a
H 0s 12
z max = 0.4714 250 + 18 –2 (5) case, the –20 m MSL wave conditions will overestimate the
7.6 Tp
wave conditions closer to the beach. As a consequence, the
This implies that the length of the erosion profile is dune erosion volume will be overestimated and, potentially,
independent of the wave period but that the value of zmax the dunes are incorrectly considered to be unsafe. Walstra
decreases with the wave period. Eqs (4) and (5) can be applied et al. (2008), Huisman et al. (2010) and Diermanse et al.
for the range 12 < Tp < 20 s. When Tp is less than 12 s, Tp = 12 s (2011) have proposed a methodology whereby the shape of
has to be used. When Tp exceeds 20 s, Tp is set to 20 s. DUROS+ the erosion profile remains unaltered (i.e., DUROS+) and the
replaced DUROS in Dutch coastal policy in 2006. A full descrip- wave input is adjusted for energy loss over a shallow area.
tion can be found in ENW (2006). This methodology, termed D++ (Huisman et al., 2010), has at
the moment of writing not yet replaced DUROS+ as the
Flood risk maps official dune erosion assessment tool. Computations reported
in Diermanse et al. (2011) indicate that the reduction in
DUROS+ is a deterministic, cross-shore dune-erosion model that recession distance can increase to over 50% near the heads
predicts the post-storm equilibrium profile given schematised of the Wadden islands.
hydraulics load (H0s, Tp and maximum waterlevel) and dune – The first dune row in some transects is quite narrow and is
characteristics (sediment fall velocity and initial profile). From likely to breach during conditions that may recur more often
the shape of the equilibrium profile and a cross-shore balance than with a 1 in 10,000 probability. For example, a flood risk
between erosion and sedimentation, the actual erosion profile map for the northwestern part of Vlieland (Boers et al., 2011)
can be computed, as well as the dune recession distance. If the shows that some dunes may already breach with a probability
dune top in the erosion profile is above the maximum water of 1 in 100 to 500 years. If and how the erosion of the
level, the dune does not breach and is thus sufficiently wide to second dune row has to be considered, is strongly debated.
prevent the hinterland from flooding. The probabilistic model, – The deep tidal channels near the heads of the Wadden islands
originally due to Van de Graaff (1986), relates recession distance confuse the mass balance concept when the 1 : 12.5 part of
to a frequency of probability. Within the Dutch coastal policy, the erosion profile extends into the channel. The unrealistic
Netherlands Journal of Geosciences — Geologie en Mijnbouw | 91 – 3 | 2012 361
Downloaded from https://www.cambridge.org/core. IP address: 46.4.80.155, on 04 Jan 2022 at 07:14:35, subject to the Cambridge Core terms of use, available at https://www.cambridge.org/core/terms.
https://doi.org/10.1017/S0016774600000494infilling of the channel implies an over-estimation of the two main effects. Firstly, the shoreline curvature will result
amount of deposited material and, hence, of the erosion in gradients in alongshore sand transport. These gradients
volume. are negative, in other words, part of the eroded volume will
– The heads of the islands are strongly curved, at several be lost alongshore rather than be deposited within the
locations more than 24° per alongshore kilometre. This has eroding profile. This causes the rate in dune erosion to remain
Fig. 5. Flood risk map for the central part of Ameland. The dashed lines are recession lines for the indicated occurrence probability. For an occurrence probability between 1 : 20,000 and
1420
40,000 the dunes between alongshore distance 1240 and 1340 are predicted to breach. The hinterland that is then flooded is indicated with the blue color. After Boers et al. (2011).
1400
1380
1/40,000 p.a.
1/20,000 p.a.
1360
1/10,000 p.a.
1/4,000 p.a.
1/1,000 p.a.
1340
1/500 p.a.
1/100 p.a.
1320
1300
1280
1260
Flooded area (Storm Surge Level: 4.4 m +NAP)
1240
1220
1200
1180
500 Meters
Primary Sea Defence
1160
1140
250
125
0
362 Netherlands Journal of Geosciences — Geologie en Mijnbouw | 91 – 3 | 2012
Downloaded from https://www.cambridge.org/core. IP address: 46.4.80.155, on 04 Jan 2022 at 07:14:35, subject to the Cambridge Core terms of use, available at https://www.cambridge.org/core/terms.
https://doi.org/10.1017/S0016774600000494higher than in a pure alongshore-uniform case, leading to an These five differences imply that the dune safety cannot be
overall larger erosion volume. For coasts curving more than judged correctly with DUROS+. D++ is a potential candidate to
6° per alongshore kilometre this increased loss is embedded handle the first difference. Because further modifications to
within the cross-shore mass balance by simply increasing DUROS+ and D++ are not considered feasible, a shift towards a
the erosion volume (e.g., ENW, 2006). For situations with a process-based dune-erosion model has been proposed. Predictions
curvature of more than 24° per alongshore kilometre, ENW from this model are thus to replace the entirely empirical Eq. (4).
(2006) does not state the expected magnitude of the addi- Walstra et al. (2008) compared various process-based models,
tional loss; instead, it is mentioned that further research is including DUROSTA (Steetzel, 1993), SBeach (Larson and Kraus,
necessary. Secondly, the strong curvature causes part of the 1989) and XBeach (Roelvink et al., 2009), with a focus on the
dune coast to face the Wadden Sea rather than the North Sea. sensitivity of their dune-erosion predictions to surge level,
Wave computations indicate that here the peak wave period offshore wave height, and grain diameter, and on the temporal
can be less than 12 s (Diermanse et al., 2011), falling outside evolution of the dune-erosion volume during a storm. Broadly
the range on which DUROS+ is based. As aforementioned, speaking, all models performed about the same and sometimes
the peak wave period has to be raised to be 12 s and, as a produced quite unrealistic results. Because XBeach is the only
result, the dune erosion volume for the parts of the coast model that can be run in area mode and can thus handle along-
facing the Wadden Sea is likely to be too high. shore variability in beach and dune characteristics, Walstra et
– The slope of the initial profile is often substantially less than al. (2008) proposed to further develop XBeach into the process-
that of the erosion profile, i.e., Eq. (4). This is fundamentally based dune-erosion method that has to replace DUROS+ in
different from DUROS+, in which the initial profile is complicated coastal settings. This further development requires
supposed to be steeper than the erosion profile (e.g., Fig. 2b). 1) more advanced process descriptions of, for example, sand
Because of the very gentle slope, the point (xmax, zmax) lies transport; 2) improvements to various numerical issues, such as
below rather than above the initial profile; in other words, the possibility to use curvi-linear grids; 3) extensive validation
the erosion profile does not fit. The gently slopes are with existing and new field and laboratory data sets; and 4) the
particularly present near the heads of the islands, where embedding of the predictions in a probabilistic setting. The next
extensive, virtually flat beach-plains (backshore) are present two sections of this paper focus on recent laboratory and field
between the intertidal beach and the first dune row (e.g., measurements that were motivated by the effect of the very
Fig. 6). It is expected that the beach-plain reduces the gentle beach slopes typical of the Wadden islands on the water
incoming waves during storm-surge conditions such that motion, sand transport and beach profile evolution, including
dune erosion is essentially minimal. dune erosion.
Fig. 6. Beach-plain at the
western head of Ameland,
near the location labeled
PTs in Fig. 1. The 4WD car is
located on the high-water
line. The faint white line
just below the horizon is
due to wave breaking on
the ebb-tidal delta. The
beach-plain is covered by
up to 1 m high young dunes
that are washed away when
the beach-plain is flooded
during a severe storm.
Netherlands Journal of Geosciences — Geologie en Mijnbouw | 91 – 3 | 2012 363
Downloaded from https://www.cambridge.org/core. IP address: 46.4.80.155, on 04 Jan 2022 at 07:14:35, subject to the Cambridge Core terms of use, available at https://www.cambridge.org/core/terms.
https://doi.org/10.1017/S0016774600000494Laboratory experiments
The small-scale experiments described here were carried out
in 2010 in the Scheldegoot at Deltares, Delft, the Netherlands
(Hoonhout et al., 2010a, b). The flume has a length of 110 m, a
width of 1 m, and a height of 1.2 m. Eleven experiments were
carried out, five of which were dune-erosion experiments. The
rationale behind these 5 experiments was to create a data set
of dune erosion for coastal profiles with a shallow beach-plain
and to assess the performance of DUROS+ in hindcasting the
measured erosion volume. The initial profile was the same as
the reference profile but including an approximately 400 m
wide (in prototype) beach-plain (Fig. 3), as found, for example,
on Ameland (Fig. 6). The experimental conditions are shown in a.
Table 1, including the code to identify each experiment. During
experiment A1a, the wave and water level conditions varied as
proposed by Vellinga (1983, 1986), see also Fig. 4b. The purpose
of A1a and A2a was to validate the assumption that the erosion
volume due to time-varying conditions (A1a) can be approxi-
mated well by using the time-invariant conditions (A2a) for a
period of 5 hours at prototype scale, also when the profile
deviates from the reference profile. B1a and B2a are variations b.
on A2a, differing in wave height (B1a) and period (B2a). Fig. 7. a. Temporal evolution of the erosion volume above storm surge
Experiment C1a equals A2a but is based on the reference profile level (in prototype) during tests A1a (in red) and A2a (in blue). Panel (b)
without the beach-plain. All experiments lasted for 5 hours, shows the corresponding water level series. The dashed black line in (a)
corresponding to 32 hours in prototype. During each experiment indicates that the erosion volume in the test with time-varying water levels
the cross-shore profile was measured 6 times. Also, water levels is reached after about 5 hours with constant maximum water level (after
and flow velocities were measured to obtain data to guide Hoonhout et al., 2010a).
the further development and testing of a process-based dune
erosion model. The grain size in model was about 110 μm. respectively. The dependence of the erosion volume on Tp is
Figure 7 compares the cumulative erosion volume for tests less than observed previously for the reference profile; the
A1a and A2a. Similar to the results in Fig. 4 with the reference reason for this is not known. Figure 8 shows that the DUROS+
profile, most of the erosion takes places when the water level predictions are slightly larger than the observed erosion volumes
is highest. The total amount of erosion with the time-varying for all tests. From a coastal-management point of view, this is
conditions equals the erosion with the time-invariant conditions advantageous, as it is better to over- rather than to under-
after about 4 to 5 hours in prototype, similar to what was estimate the amount of dune erosion.
observed by Vellinga (1983, 1986) for the reference profile
(Fig. 4). The presence of the beach-plain reduced the erosion
volume above surge level by 85%, from about 312 m3/m in C1a
to 47 m3/m in A2a. Both the about 20% increase in H0s (A2a
versus B1a) and 35% increase in Tp (A2a versus B2a) caused the
dune erosion volume to become larger, by about 35% and 5%,
Table 1. Experimental conditions (after Hoonhout et al., 2010b).
Experiment Prototype Model
H0s (m) Tp (s) H0s (m) Tp (s) h* (m)
A1a varying varying varying varying varying
A2a 9.0 14.2 0.225 2.25 0.70
B1a 10.7 14.2 0.267 2.25 0.70
B2a 9.0 18.9 0.225 3.00 0.70 Fig. 8. DUROS+ predicted versus measured erosion volume (in prototype)
C1a 9.0 14.2 0.225 2.25 0.70 above surge level for experiments A2a, B1a, B2a and C1a. The diagonal line
* h is the water depth at the seaward end of the cross-shore laboratory profile. is the line of equality. (after Hoonhout et al., 2010a).
364 Netherlands Journal of Geosciences — Geologie en Mijnbouw | 91 – 3 | 2012
Downloaded from https://www.cambridge.org/core. IP address: 46.4.80.155, on 04 Jan 2022 at 07:14:35, subject to the Cambridge Core terms of use, available at https://www.cambridge.org/core/terms.
https://doi.org/10.1017/S0016774600000494Fig. 9. Cross-shore evolution
of the short (magenta) and
infragravity (green) wave
height for experiments A2a
(a) and C1a (b). The blue
line is the water level (5 m
+MSL) and the black line is
the bed-elevation profile. All
values are prototype. (after
Hoonhout et al., 2010a). a. b.
Figure 9 illustrates the cross-shore evolution of the proto- Field studies
type wave height for both the short (i.e., ‘storm’) and infra-
gravity waves. As expected, the beach-plain causes a more Extensive field campaigns to measure the water motion, sand
marked decrease in the short-wave height. This decrease is so transport and evolving bathymetry of a beach have been
substantial that the wave motion on the beach plain is carried out since the mid 1970s. In the Netherlands, most
dominated by infragravity waves (Fig. 9a), consistent with field campaigns were carried out at the Holland coast, most notably
observations on very gently sloping beaches by, for example, at the beaches of Groote Keeten and Egmond aan Zee (e.g.,
Ruessink et al. (1998a) and Ruggiero et al. (2004). Interestingly, Ruessink et al., 2001; Price & Ruessink, 2008). Field campaigns
also the infragravity-wave height decreases across the beach- on the beaches of the Wadden islands have been scarcer. As
plain. This is consistent with earlier field observations on very part of the EU-funded NOURTEC project, Ruessink et al. (1998b)
gently sloping profiles (e.g., Ruessink, 1998). Why infragravity investigated the role of storm waves, infragravity waves and
waves lose part of their energy is neither obvious from the mean flows to the cross-shore transport in 3 to 9 m water
present laboratory nor from the previous field data. We return depth, well seaward of the intertidal beach and the dunes, at
to this point in the next section. Because of a lack of detailed Terschelling. Van der Vegt et al. (2009) examined the hydro-
flow and sand-concentration measurements, it is difficult to dynamical processes responsible for the migration of a small
reason why the presence of the beach-plain reduces the dune channel in a secondary tidal inlet system on the island of
erosion volume so profoundly. Conceptually, the reduced Texel. In the remainder of this section, we focus on the 2010
short-wave height just seaward of the dune face will cause less Ameland campaign. This campaign was set-up specially to
intense slumping and retreat of the dune face. Furthermore, better understand the mutual interaction between water
the reduced short-wave height will cause less sand stirring motion (turbulence, waves, mean flows), sand suspension and
seaward of the retreating dune face and in a less pronounced transport, and morphological change of a gently sloping beach
undertow, hence in a much reduced offshore transport. during high-energy wave conditions in shallow (less than 2 m
depth) water. The collected data are expected to be useful to
guide the development and to test the process-based model
that will replace DUROS+ for complicated coastal settings.
Netherlands Journal of Geosciences — Geologie en Mijnbouw | 91 – 3 | 2012 365
Downloaded from https://www.cambridge.org/core. IP address: 46.4.80.155, on 04 Jan 2022 at 07:14:35, subject to the Cambridge Core terms of use, available at https://www.cambridge.org/core/terms.
https://doi.org/10.1017/S0016774600000494The 2010 Ameland field campaign stacks of optical backscatter sensors were also deployed to
measure the near-bed horizontal flow and sand concentrations
The field campaign was conducted from September 22, 2010, to (Fig. 10b). At P5, a rig (Fig. 10c) was deployed to study the
November 1, 2010, at the northernmost tip of the western head vertical structure of turbulence, oscillatory flow, cross-shore
of Ameland, the Netherlands (Fig. 1, label ‘PTs’). The scientific and alongshore mean flow, and sand concentration beneath
focus was on quantifying the importance of breaking-induced, breaking waves, see also Ruessink (2010). Sensors used here
surface-generated turbulence to sand suspension and on the include three single-point, downward-oriented, 5-MHz Sontek
cross-shore structure of infragravity waves. As mentioned in acoustic Doppler velocimeter ocean (ADVO) probes to measure
the Introduction section of this article, surface-generated turbulence, and a stack of 5 optical backscatter sensors to
turbulence is likely the major source for sand suspension under measure sand concentrations. At the remaining 10 positions,
storm conditions, while infragravity waves are one of the stand-alone PTs (Fig. 10d) were deployed. At all locations,
mechanisms expected to transport the suspended sand in the measurements were performed continuously with a sampling
seaward direction and hence to contribute to beach and dune frequency of 4 or 5 Hz when the instruments were submerged.
erosion. The beach is very low-sloping (~1 : 80), borders an The three ADVOs sampled at 10 Hz in bursts of approximately
approximately 400-m wide beach-plain (Fig. 6), is protected 29 minutes each half hour. The median grain size was about
from the full force of North Sea waves by a spatially extensive, 200 μm.
shallow ebb-tidal delta, and is located at a strongly curved Figure 11 shows the wave and water level conditions during
coast (Fig. 1). the field campaign. The offshore wave data, measured by a
During the campaign, 14 pressure transducers (PTs) were directional buoy in about 22 m depth seaward of the ebb-tidal
deployed with an approximately 10-20 m spacing in a cross- delta (labeled B12 in Fig. 1) and by a non-directional buoy in
shore transect from just below the spring low-tide level to the about 4 m depth landward of the delta (labeled B22 in Fig. 1),
high-tide level expected for a typical autumn storm coinciding comprise 10-minute values of the spectral significant wave
with spring tide (Fig. 10a). The instrument positions are labeled height H0s , mean period T and (for buoy B12 only) angle of wave
P1 to P14 in the onshore direction. At three of these positions incidence θ in the 30-500 mHz frequency band. The experi-
(P7, P9 and P11), electromagnetic flow meters, and vertical ment average H0s and T seaward of the delta were approximately
P14
P13
Bed elevation (m M.S.L.)
1 P12
P10
P8 P9
P6 P7 P11
0 P5
P2
P1 P4
-1 P3
0 50 100 150 200
a. Cross-shore distance (m)
STM SRPS
PT PT
PT STM
EMF
ADVO
b. c. d.
Fig. 10. a. Cross-shore profile measured at the start of the Ameland 2010 field campaign. The open circles are the locations of the instrument rigs in (b).
Rig (c) was located at P5 (square). Pressure transducers as shown in (d) were deployed at the other locations (filled circles). The instrument abbreviations
are PT = pressure transducer, ADVO = acoustical Doppler velocimeter Ocean, EMF = electromagnetic flow meter, STM = Seapoint turbidity meter (= optical
backscatter sensor), and SRPS = sand ripple profiling sonar. An approximately 500-m wide beach-plain (Fig. 6) separates P14 from the dunefoot.
366 Netherlands Journal of Geosciences — Geologie en Mijnbouw | 91 – 3 | 2012
Downloaded from https://www.cambridge.org/core. IP address: 46.4.80.155, on 04 Jan 2022 at 07:14:35, subject to the Cambridge Core terms of use, available at https://www.cambridge.org/core/terms.
https://doi.org/10.1017/S00167746000004941.45 m and 4.7 s, respectively. The wave height peaked during Under non-breaking waves (Hs/h < 0.3), turbulence levels are
a storm on yearday 297 (October 24, 2010) with a value just low ( k/gh < 0.02) and do not depend on the relative sensor
below 6 m (Fig. 11a). Figure 11a clearly demonstrates the height above the bed, ξ/h (Fig. 12b). We do not see an increase
effect of the delta on wave characteristics, as the wave height in turbulence levels very close to the bed, indicative of
shoreward of the delta is tide-modulated (compare Fig. 11a to turbulence generated near the bed because of strong shear in
Fig. 11d) and never reaches above 1.9 m. The water levels are oscillatory and mean flows (e.g., Nadaoka and Kondoh, 1982).
10-minute values for the tidal station Terschelling Noordzee Possibly, the measurements did not extend close enough to the
(labeled TN in Fig. 1), see Fig. 11d. Surge levels (Fig. 11e) were bed for Hs/h < 0.3 to witness this near-bed increase in k/gh.
estimated as the difference between measured and predicted With an increase in Hs/h, turbulence levels intensify in the
tide, and reached values up to +0.65 m during the most ener- entire water column, and especially so higher up in the column.
getic events and –0.7 m during mild conditions. In the following For Hs/h = 0.3-0.5 the increase in k/gh is most marked for
we present snapshots of the turbulence and infragravity-wave ξ/h > ≈0.3 (Fig. 12c), while for Hs/h > 0.5 the increase is notable
results. Details of data processing are given in Pieterse (2011) in the entire water column (Fig. 12d). Thus, Figures 12c-d signify
and De Bakker (2011), and are not reiterated here. that for Hs/h > ~0.3 turbulence is generated predominantly at
the sea surface due to wave breaking and that, as wave breaking
Turbulence beneath breaking waves intensifies, this turbulence penetrates deeper into the water
column towards the bed. The effect hereof on sand suspension
Turbulence levels were quantified by means of the Froude- and transport is currently being investigated; preliminary
scaled turbulent kinetic energy k/gh. Here, the turbulent results can be found in Pieterse (2011) and will be presented in
kinetic energy k is defined as k = 0.5 (〈u'2〉 + 〈v'2〉 + 〈w'2〉), g is more detail elsewhere.
gravitational acceleration, h is water depth, and the angle
brackets denote a burst-average. The instantaneous (i.e. 10 Hz) Infragravity waves
cross-shore, alongshore, and vertical turbulence fluctuations
(u', v' and w', respectively) were estimated for each ADVO using The significant height of the infragravity waves on the
the two-sensor separation technique of Feddersen et al. (2007). intertidal beach varied between approximately 0.02 and 0.67 m,
Turbulence estimates that did not pass the criteria given in with the variations closely linked to the offshore short-wave
Feddersen (2010) were removed from the data set. Figure 12a significant wave height (Hs0 at buoy B12). At P1, for example,
shows k/gh versus the local relative wave height, defined as the correlation coefficient amounted to 0.85. The constant of
the ratio of the significant wave height Hs to the water depth. proportionality between the significant infragravity-wave
This ratio can be seen as a measure of breaking intensity, with height at P1 and Hs0 at buoy B12 was about 0.11, and increased
waves starting to break at Hs/h ≈ 0.3 (Ruessink et al., 1998b). to 0.14 at P12.
6
H 0s (m)
4
2
a. 0
8
6
T (s)
Fig. 11. a. Offshore signifi-
4
cant wave height Hs0 (black
b. 360 2
line, buoy B12; red line,
270
θ (deg N)
buoy B22); b. mean period
180
T; c. angle of incidence θ;
90
d. water level ζ with respect c. 0 2
to MSL; and e. surge level
1
ζ (m)
versus time. Unless other- 0
wise indicated, the wave −1
data were measured at B12 d. 1 −2
and the water level data at
Surge (m)
TN, see Fig. 1 for location. 0
The shore-normal direction
of the instrument array is e. −1
265 270 275 280 285 290 295 300 305
about 0° N. Time (yearday in 2010)
Netherlands Journal of Geosciences — Geologie en Mijnbouw | 91 – 3 | 2012 367
Downloaded from https://www.cambridge.org/core. IP address: 46.4.80.155, on 04 Jan 2022 at 07:14:35, subject to the Cambridge Core terms of use, available at https://www.cambridge.org/core/terms.
https://doi.org/10.1017/S00167746000004940.1 0.1
0.08 0.08
0.06 0.06
k/gh
k/gh
0.04 0.04
0.02 0.02
0 0
0 0.2 0.4 0.6 0.8 0 0.2 0.4 0.6 0.8 1
H s /h ξ/ h
a. b.
0.1 0.1
0.08 0.08
Fig. 12. Froude-scaled turbulent
kinetic energy k/gh; a. versus
0.06 0.06
k/gh
k/gh
the relative wave height Hs /h
0.04 0.04 (all observations), and versus the
normalised sensor height above
0.02 0.02 the bed ξ /h; with b. Hs /h < 0.3;
c. Hs /h = 0.3-0.5; and d. Hs /h >
0 0 0.5 at P5. ξ /h = 0 is the sea bed,
0 0.2 0.4 0.6 0.8 1 0 0.2 0.4 0.6 0.8 1
ξ/ h ξ/ h ξ /h ≈ 0.7 is the approximate
c. d. wave trough level.
Figure 13 examines the measured cross-shore structure of the shore, x ≈ 160 m, and on the bar, x ≈ 25 m; Fig. 13a) and
infragravity waves at a representative high tide (here, during minima (x ≈ 130 m); a phase φ jump of ±180 degrees is located
the storm on September 25, 2010). The left column in Fig. 13 is at the minimum (Fig. 13b); and, the reflection coefficients R2
representative of the highest infragravity-wave periods (>60 s) are well above 0.5 (Fig. 13c). This standard picture starts to
and shows the classical picture of a standing infragravity wave: change with a decrease in period. For the 30-60 s range the
the pressure fluctuations have clear amplitude E maxima (at amplitude still has some amplitude fluctuations (Fig. 13d), but
Fig. 13. (from top to bottom) Non-dimensional Period = 90 s Period = 45 s Period = 22.5 s
0.6
amplitude E, phase φ, reflection coefficient R2
0.4
and bed elevation z versus cross-shore distance x.
E
Left panels: period = 90 s; middle panels = 45 s; 0.2
0 a. d. g.
right panels = 22.5 s. The amplitude E and phase
φ were extracted from an eigenfunction analysis 180
φ (deg)
of the cross-spectral matrix for each period, see
Henderson et al. (2000) for details. The 0
reflection coefficients R2 were obtained using b. e. h.
−180
the Van Dongeren et al. (2007) methodology to
split the total infragravity motion into shoreward 1
and seaward propagating components. The bed
R2
0.5
elevation is with respect to Mean Sea Level, MSL,
and cross-shore distance is with respect to P1. 0 c. f. i.
The results in (a-i) were based on a 2-hr record of 2
near-bed pressure at each measurement location.
z (m)
1
The offshore significant wave height (in 22-m 0
depth) amounted to 3.5 m and the tide level was −1
about 1 m above MSL (high tide). Short waves 0 50 100 150 200 0 50 100 150 200 0 50 100 150 200
broke over the entire measurement profile. x (m) x (m) x (m)
368 Netherlands Journal of Geosciences — Geologie en Mijnbouw | 91 – 3 | 2012
Downloaded from https://www.cambridge.org/core. IP address: 46.4.80.155, on 04 Jan 2022 at 07:14:35, subject to the Cambridge Core terms of use, available at https://www.cambridge.org/core/terms.
https://doi.org/10.1017/S0016774600000494the phase jump has been replaced by an increase in phase 1. 2
to the shore (Fig. 13e) and the reflection coefficients have
dropped to about 0.2 (Fig. 13f). The 30-60 s period range is 1
thus characterised by a mixture of shoreward-progressive and
standing waves. The standing pattern completely disappears 0. 8
for lower infragravity-wave periods: the amplitude decreases
0. 6
R
to the shore monotonically (Fig. 13g); the phase evolution is as
expected for an onshore progressive wave (Fig. 13h); and the
reflection coefficients are less than 0.05 (Fig. 13i). The bulk 0. 4 90 s
(i.e. integrated over the entire infragravity-period range) 45 s
reflection coefficient at the shallowest position (x = 125 m) is 0. 2 22.5 s
about 0.35 only. This implies that some 65% of the shoreward fit
infragravity energy flux must dissipate shoreward of x = 125 m, 0
in water depths less than 0.5-1 m, including the swash zone 0 2 4 6 8
(i.e. the region where waves run up and down the beach). This
β
H
represents a remarkably localised source of dissipation, Fig. 14. Reflection coefficient R at 3 infragravity-wave periods (90 s, 45 s
considering the short stretch in which it occurs (the distance and 22.5 s) versus the breaker parameter βH at P11. The fit is a theoretical
between x = 125 m and the shoreline is some 50 m). It also prediction (R = 0.2πβH 2) given in Van Dongeren et al. (2007), in which the
represents a major difference with findings on steeper beaches steep-slope regime (i.e., no dissipation, hence R = 1) starts at βH = 1.25.
where reflection coefficients in this depth range are about 1 In the Ameland data, the steep-slope regime appears to start around βH = 2.
(e.g., Sheremet et al., 2002; Thomson et al., 2006) and inshore
dissipation is thus negligible. Also, most infragravity-wave on gently sloping beaches typical of the Wadden islands and to
models are non-dissipative. On a 1 : 35 laboratory beach, Van explore if and how infragravity-wave dissipation alters the
Dongeren et al. (2007) also found localised, inshore infragravity- erosion magnitude and rate of dunes bordered by gently
wave dissipation. They noted how shoreward propagating sloping beaches or beach-plains compared to those bordered by
infragravity waves changed shape and postulated that this was steeper beaches.
indicative of breaking.
Figure 14 tests whether the results in Fig. 13 for the lower Concluding remarks
infragravity-wave periods (say, ≈2), while most of the shorter periods (T = 22.5 s and 45 s) DUROS+ estimates for large parts of the Wadden islands and
are in the mild-slope regime (βH < ≈2). On the whole, Figure 14 have led to the suggestion that a process-based and spatially
supports the hypothesis that infragravity-wave breaking is the extensive model should be set-up to replace DUROS+ as the
major source for infragravity-wave dissipation and may explain dune-erosion model in complicated coastal settings.
why the infragravity-wave height reduces across the laboratory A process-based model aims to predict the interaction
beach-plain (Fig. 9). Further work is required to more extensively between the water motion (waves, wave-induced flows), sand
prove the relevance of breaking to infragravity-wave dynamics suspension and transport, and the bathymetry in a time-stepping
Netherlands Journal of Geosciences — Geologie en Mijnbouw | 91 – 3 | 2012 369
Downloaded from https://www.cambridge.org/core. IP address: 46.4.80.155, on 04 Jan 2022 at 07:14:35, subject to the Cambridge Core terms of use, available at https://www.cambridge.org/core/terms.
https://doi.org/10.1017/S0016774600000494manner. Results like those presented in Figs 9, 12, 13 and 14 Acknowledgements
highlight just some of the challenges we are facing to develop
and test such a model. Firstly, the sand transport equations in The work presented here received funding from a variety of
many coastal-evolution models are engineering type models projects. BGR and RCW acknowledge funding by Utrecht
that are based on laboratory experiments with non-breaking University’s focus area ‘Earth and Sustainability’, subtheme
waves (e.g., Ribberink, 1998; Silva et al., 2006) and assume that ‘Earth and Climate’. FG was funded by the Netherlands
bed-generated turbulence is the dominant source of turbulence Organization for Scientific Research under project 825.10.035
to stir sediment. Attempts to include the effect of surface- (Rubicon/Marie Curie Cofund Action). The work presented here
generated turbulence in sand transport modelling have been has benefitted greatly from extensive discussions in the frame-
made by, for example, Deigaard et al. (1986), Roelvink and work of the Sterkte en Belastingen Waterkering (SBW) project,
Stive (1989) and Mocke (2001). These models remain largely commissioned by Rijkswaterstaat Waterdienst and carried out
untested because of a lack of simultaneously collected data by Deltares.
of the vertical structure of turbulence and sand suspension
under field conditions. The Ameland data, as well as the ECORS- References
TrucVert’08 field data (Ruessink, 2010; Sénéchal et al., 2011),
offer unique possibilities to test and improve these models, Boers, M., Diermanse, F. & Van Dongeren, A., 2011. Flood hazard maps in coastal
such that coastal-evolution models can make more realistic areas. In: Proceedings of CoastGIS 2011, Vol. 4: 67-74.
predictions of beach and dune erosion during storms. Secondly, Carter, R.W.G. & Stone, G.W., 1989. Mechanisms associated with the erosion of
the decline in infragravity-wave height on the laboratory sand dune cliffs, Magilligan, Northern Island. Earth Surface Processes and
beach-plain and the limited reflection of infragravity waves Landforms 14: 1-10.
with periodsHuisman, B.J.A., De Grave, P., Diermanse, F.L.M., Walstra, D.J.R. & Van Thiel Ruessink, B.G. & Jeuken, M.C.J.L., 2002. Dunefoot dynamics along the Dutch
de Vries, J.S.M., 2010. Ontwikkeling detailtoets duinen 2011 (D++). Deltares coast. Earth surface processes and landforms 27: 1043-1056.
Report 1202124-003-HYE-0004, 125 pp. (In Dutch) Ruessink, B.G., 2010. Observations of turbulence within a natural surf zone.
Larson, M. & Kraus, N.C., 1989. SBEACH: numerical model for simulating storm- Journal of Physical Oceanography 40: 2696-2712.
induced beach change. Report 1. Empirical foundation and model development. Ruggiero, P., Holman, R.A. & Beach, R.A., 2004. Wave runup on a high-energy
US Army Corps of Engineers Technical Report CERC-89-9, US Army Engineer dissipative beach, Journal of Geophysical Research 109: C06025, doi:10.1029/
Waterways Experiment Station, Vicksburg, MS. 2003JC002160.
Larson, M., Erikson, L. & Hanson, H., 2004. An analytical model to predict dune Russell, P., 1993. Mechanisms for beach erosion during storms. Continental Shelf
erosion due to wave impact. Coastal Engineering 51: 675-696. Research 13: 1243-1265.
McCall, R.T., Van Thiel de Vries, J.S.M., Plant, N.G., Van Dongeren, A.R., Schupp, C.A., McNinch, J.E. & List, J.H., 2006. Nearshore shore-oblique bars, gravel
Roelvink, J.A., Thompson, D.M. & Reniers, A.J.H.M., 2010. Two-dimensional outcrops, and their correlation to shoreline change. Marine Geology 233: 63-79.
time dependent hurricane overwash and erosion modeling at Santa Rosa Sénéchal, N., Abadie, S., Gallagher, E., MacMahan, J., Masselink, G., Michallet,
Island. Coastal Engineering 57: 668-683. H., Reniers, A., Ruessink, G. Russell, P., Sous, D., Turner, I., Ardhuin, F.,
McNinch, J.E., 2004. Geologic control in the nearshore: shore-oblique sandbars Bonneton, P., Bajun, S., Capo, S., Certain, R., Pedreros, R. & Garlan, T.,
and shoreline erosional hotspots, Mid-Atlantic Bight, USA. Marine Geology 211: 2011. The ECORS-Truc Vert 2008 nearshore field experiment: presentation of
121-141. a three-dimensional morphologic system in a macrotidal environment during
Mocke, G.P., 2011. Structure and modeling of surf zone turbulence due to wave consecutive extreme storm conditions. Ocean Dynamics, 61: 2073-2098.
breaking. Journal of Geophysical Research, 106: 17,039-17,057. Sheremet, A., Guza, R.T. Elgar, S. & Herbers, T.H.C., (2002), Observations of
Nadaoka, K. &. Kondoh, T., 1982. Laboratory measurements of velocity field nearshore infragravity waves: 1. Seaward and shoreward propagating compo-
structure in the surf zone by LDV. Coastal Engineering in Japan 25:125-145. nents, Journal of Geophysical Research, 107: 3095, doi:10.1029/2001JC000970.
Nadaoka, K., Ueno, S. & Igarashi, T.,1988. Sediment suspension due to large scale Short, A.D., 1992. Beach systems of the central Netherlands coast: processes,
eddies in the surf zone. In: Proceedings of the 21st Conference on Coastal morphology and structural impacts in a storm driven multi-bar system.
Engineering. ASCE, New York: 1646-1660. Marine Geology 107: 103-132.
Nishi, R. & Kraus, N.C., 1996. Mechanism and calculation of sand dune erosion by Silva, P.A., Temperville, A. & Santos, F.S., 2006. Sand transport under combined
storms. In: Proceedings of the 25th Conference on Coastal Engineering. ASCE, current and wave conditions: a semi-unsteady, practical model. Coastal
New York: 3034-3047. Engineering 53: 897-913.
Overton, M.F., Pratikto, W.A., Lu, J.C. & Fisher, J.S., 1994. Laboratory investigation Steetzel, H.J., 1993. Cross-shore transport during storm surges. Ph.D. thesis,
of dune erosion as a function of sand grain size and dune density. Coastal Delft University of Technology, Delft, the Netherlands.
Engineering 23: 151-165. Steetzel, H.J., 2002. Effect van zwaardere golfcondities op duinenkust. Verkenning
Pieterse, A., 2011. Downward spreading of turbulence beneath breaking waves effect grotere golfhoogte en langere golfperiode op mate duinafslag en
and its influence on sediment suspension. MSc thesis, Utrecht University, the veiligheid duinenkust. Alkyon Report A963. (In Dutch)
Netherlands, 98 pp. Swinkels, C.M., 2010. Storm hindcast January 2010. Analysis of the application
Price, T.D. & Ruessink, B.G., 2008. Morphodynamic zone variability on a microtidal of radar current data for hindcast purposes. Deltares Report 1202119-001-
barred beach. Marine Geology 251: 98-109 HYE-0003, 36 pp.
Ribberink, J.S., 1998. Bed-load transport for steady flows and unsteady oscillatory Thomson, J., Elgar, S., Raubenheimer, B., Herbers, T.H.C. & Guza, R.T., 2006.
flows. Coastal Engineering 34: 59-62. Tidal modulation of infragravity waves via nonlinear energy losses in the surf-
Roelvink, J.A. & Stive, M.J.F., 1989. Bar-generating cross-shore flow mechanisms zone, Geophysical Research Letters, 33: L05601, doi:10.1029/2005GL025514.
on a beach. Journal of Geophysical Research, 94: 4785-5800. TAW, 1995. Basisrapport Zandige Kust behorende bij de leidraad Zandige Kust.
Roelvink, D., Reniers, A., Van Dongeren, A., Van Thiel de Vries, J., McCall, R. & Technische Adviescommissie voor de Waterkeringen, Delft, 507 pp. (In Dutch)
Lescinski, J., 2009. Modeling storm impacts on beaches, dunes and barrier Van Alphen, J.S.L.J. & Damoiseaux, M.A., 1987. A morphological map of the
islands. Coastal Engineering 56: 1133-1152. Dutch shoreface and adjacent part of the continental shelf (1 : 250,000).
Ruessink, B.G., 1998. The temporal and spatial variability of infragravity waves Rijkswaterstaat. Nota NZ-N-87.21/MDLK-R-87.18, 20 pp.
in a barred nearshore zone. Continental Shelf Research 18: 585-605. Van de Graaff, J., 1977. Dune erosion during a storm. Coastal Engineering 1:
Ruessink, B.G., Kleinhans, M.G. & Van den Beukel, P.G.L., 1998a. Observations 99-134.
of swash under highly dissipative conditions. Journal of Geophysical Van de Graaff, J., 1986. Probabilistic design of dunes; an example from the
Research 103: 3111-3118. Netherlands. Coastal Engineering 9: 479-500.
Ruessink, B.G., Houwman K.T. & Hoekstra, P., 1998b. The systematic contribution Van Dongeren, A.R., Battjes, J.A., Janssen, T.T., Van Noorloos, J., Steenhauer,
of transporting mechanisms to the cross-shore sediment transport in water K., Steenbergen, G. & Reniers, A.J.H.M., 2007. Shoaling and dissipation of
depths of 3 to 9 m. Marine Geology 152: 295-324. low-frequency waves. Journal of Geophysical Research 112: C02011,
Ruessink, B.G., Miles, J.R., Feddersen, F., Guza,R.T. & Elgar, S., 2001. Modeling doi:10.1029/2006JC003701.
the alongshore current on barred beaches. Journal of Geophysical Research Van Gent, M.R.A., Van Thiel de Vries, J.S.M., Coeveld, E.M., De Vroeg J.H., &
106: 22451-22464. Van de Graaff, J., 2008. Large-scale dune erosion tests to study the influence
of wave periods. Coastal Engineering 55: 1041-1051.
Netherlands Journal of Geosciences — Geologie en Mijnbouw | 91 – 3 | 2012 371
Downloaded from https://www.cambridge.org/core. IP address: 46.4.80.155, on 04 Jan 2022 at 07:14:35, subject to the Cambridge Core terms of use, available at https://www.cambridge.org/core/terms.
https://doi.org/10.1017/S0016774600000494You can also read